bookmark_borderClimate Change Feedback Loops: Brown Carbon, Wildfires, and Arctic Melting

Feedback loops accelerate climate change at an exponential rate. In this case, brown carbon from wildfires warms the arctic. The warmer arctic absorbs more heat causing more wildfires. In turn, more wildfires cause more brown carbon resulting in a warmer arctic. The cycle keeps reinforcing itself as it repeats.

A study published in One Earth entitled “Brown carbon from biomass burning imposes strong circum-Arctic warming” reports:
• Brown carbon imposes strong Arctic warming
• Warming effect of water-soluble brown carbon is ∼30% relative to black carbon
• Biomass burning (wildfires) contributes ∼60% of the warming effect of brown carbon
• Warming climate leads to increased wildfires that reinforce Arctic warming

Rapid warming in the Arctic has a huge impact on the global environment. Atmospheric brown carbon (BrC) is one of the least understood and uncertain warming agents due to a scarcity of observations. Here, we performed direct observations of atmospheric BrC and quantified its light-absorbing properties during a 2-month circum-Arctic cruise in summer of 2017. Through observation-constrained modeling, we show that BrC, mainly originated from biomass burning in the mid- to high latitudes of the Northern Hemisphere (∼60%), can be a strong warming agent in the Arctic region, especially in the summer, with an average radiative forcing of ∼90 mW m−2 (∼30% relative to black carbon). As climate change is projected to increase the frequency, intensity, and spread of wildfires, we expect BrC to play an increasing role in Arctic warming in the future.

More on Climate Change

bookmark_borderClimate Change: Code Red for Humanity

The UN’s IPCC (Intergovernmental Panel on Climate Control) release their latest report that has been compiled and peer-reviewed over the last 8 years.

U.N. Secretary-General, António Guterres described the report as “a code red for humanity.”

“The alarm bells are deafening, and the evidence is irrefutable: greenhouse gas emissions from fossil fuel burning and deforestation are choking our planet and putting billions of people at immediate risk,” said Mr. Guterres.

Some of the changes already set in motion will be “irreversible” for centuries to come.

A press release from the IPCC states:

The report provides new estimates of the chances of crossing the global warming level of 1.5°C in the next decades, and finds that unless there are immediate, rapid and large-scale reductions in greenhouse gas emissions, limiting warming to close to 1.5°C or even 2°C will be beyond reach.

The report shows that emissions of greenhouse gases from human activities are responsible for approximately 1.1°C of warming since 1850-1900, and finds that averaged over the next 20 years, global temperature is expected to reach or exceed 1.5°C of warming. This assessment is based on improved observational datasets to assess historical warming, as well progress in scientific understanding of the response of the climate system to human-caused greenhouse gas emissions.

“This report is a reality check,” said IPCC Working Group I Co-Chair Valérie Masson-Delmotte. “We now have a much clearer picture of the past, present and future climate, which is essential for understanding where we are headed, what can be done, and how we can prepare.”

Every region facing increasing changes

Many characteristics of climate change directly depend on the level of global warming, but what people experience is often very different to the global average. For example, warming over land is larger than the global average, and it is more than twice as high in the Arctic.

“Climate change is already affecting every region on Earth, in multiple ways. The changes we experience will increase with additional warming,” said IPCC Working Group I Co-Chair Panmao Zhai.

The report projects that in the coming decades climate changes will increase in all regions. For 1.5°C of global warming, there will be increasing heat waves, longer warm seasons and shorter cold seasons. At 2°C of global warming, heat extremes would more often reach critical tolerance thresholds for agriculture and health, the report shows.

But it is not just about temperature. Climate change is bringing multiple different changes in different regions – which will all increase with further warming. These include changes to wetness and dryness, to winds, snow and ice, coastal areas and oceans. For example:

* Climate change is intensifying the water cycle. This brings more intense rainfall and associated flooding, as well as more intense drought in many regions.
* Climate change is affecting rainfall patterns. In high latitudes, precipitation is likely to increase, while it is projected to decrease over large parts of the subtropics. Changes to monsoon precipitation are expected, which will vary by region.
* Coastal areas will see continued sea level rise throughout the 21st century, contributing to more frequent and severe coastal flooding in low-lying areas and coastal erosion. Extreme sea level events that previously occurred once in 100 years could happen every year by the end of this century.
* Further warming will amplify permafrost thawing, and the loss of seasonal snow cover, melting of glaciers and ice sheets, and loss of summer Arctic sea ice.
* Changes to the ocean, including warming, more frequent marine heatwaves, ocean acidification, and reduced oxygen levels have been clearly linked to human influence. These changes affect both ocean ecosystems and the people that rely on them, and they will continue throughout at least the rest of this century.
* For cities, some aspects of climate change may be amplified, including heat (since urban areas are usually warmer than their surroundings), flooding from heavy precipitation events and sea level rise in coastal cities.

For the first time, the Sixth Assessment Report provides a more detailed regional assessment of climate change, including a focus on useful information that can inform risk assessment, adaptation, and other decision-making, and a new framework that helps translate physical changes in the climate – heat, cold, rain, drought, snow, wind, coastal flooding and more – into what they mean for society and ecosystems.

This regional information can be explored in detail in the newly developed Interactive Atlas interactive-atlas.ipcc.ch as well as regional fact sheets, the technical summary, and underlying report.

Human influence on the past and future climate

“It has been clear for decades that the Earth’s climate is changing, and the role of human influence on the climate system is undisputed,” said Masson-Delmotte. Yet the new report also reflects major advances in the science of attribution – understanding the role of climate change in intensifying specific weather and climate events such as extreme heat waves and heavy rainfall events.

The report also shows that human actions still have the potential to determine the future course of climate. The evidence is clear that carbon dioxide (CO2) is the main driver of climate change, even as other greenhouse gases and air pollutants also affect the climate.

“Stabilizing the climate will require strong, rapid, and sustained reductions in greenhouse gas emissions, and reaching net zero CO2 emissions. Limiting other greenhouse gases and air pollutants, especially methane, could have benefits both for health and the climate,” said Zhai.

More on The Human Induced Climate Change Experiment

bookmark_borderDroughts and Rising Sea Levels

“There has been a 500% increase in the US drought area,” said Al Roker of the Today show while reporting on 2020 being tied for the hottest year.

The Washington Post reports, “Drought is the sleeper weather story you’ll hear more about in 2021.” [1}

“The impact of desertification is intensifying due to climate change, which is reducing the availability of freshwater, fertile soil, and forest and vegetation. As the degraded land loses value, investments in agriculture and rural development decline even more.” — Ban Ki-moonUnited Nations Secretary-General [2}

This doesn’t have to do with drought episodes. It has to do with areas prone to having droughts. As the area of land that is prone to flooding is increasing exponentially, so too is the land prone to severe, long term drought. We make it even worse by pumping ground water out for agriculture. This depletes the aquifers. The result is sinking land and rising sea levels. The depleted fresh water is then intruded by salt water. Salt water intrusion has a severe impact on the world food supply.

So, you have rising seas above and below the land. Compounding the problem — water expands when it gets warmer. About 1/3 of the rise in sea level is due to thermal expansion of water. [Volumetric Thermal Expansion] The warmer sea water also melts sea ice. The ocean doesn’t reflect the energy the way ice does. In fact just he opposite, the ocean absorbs the heat… making the water warmer… melting more sea ice…. and warming the planet. Which melts the land ice, which raises the sea level. A vicious feedback cycle of fresh water depletion and sea level rise has been created.

Climate change is making weather events more extreme and more frequent. More severe droughts, more severe floods, etc. Energy is being added to the system. “Climate change increases the odds of worsening drought in many parts of the United States and the world in the decades ahead. A changing climate can also alter atmospheric rivers (narrow streams of moisture transported in the atmosphere), which can especially disrupt precipitation patterns in the Western United States. Droughts can persist through a “positive feedback,” where very dry soils and diminished plant cover can further suppress rainfall in an already dry area.” [3]

“Risks from desertification are projected to increase due to climate change (high confidence). The combination of pressures coming from climate variability, anthropogenic climate change and desertification will contribute to poverty, food insecurity, and increased disease burden (high confidence).” [4]

1. Drought is the sleeper weather story you’ll hear more about in 2021. (The Washington Post)
2. DESERTIFICaTION (United Nations)
3. Drought and Climate Change (Center for Energy and Climate Solutions)
4. SPECIAL REPORT: Climate Change and Land Desertification (International Panel on Climate Change)

bookmark_borderThe Horror World will Face from Climate Change

, explains:

“I said it was the new normal a few years ago,’’ Brown said in an exclusive interview with POLITICO. “This is serious …. but this is only the beginning. This is only a taste of the horror and the terror that will occur in decades.’’

“And it will occur in various spots: in America, in Africa, in Canada,’’ said Brown, who will travel to Washington this week to speak on climate change issues. “It’s unpredictable, other than the fact that it will get worse in present trajectory. Washington, under Trump, is doing very little — and even the Congress has been unable to mobilize under Washington.’’

“It’s a real threat, but it has to be managed. This is the world we live in. And it will get more dangerous.”

bookmark_borderExtreme Weather Events Getting More Extreme

The U.N. has released a report entitled, “Extreme Weather Continues in 2018 – a Continuing Call to Climate Action”.

Addressing the dangers associated with extreme weather conditions, the Executive Secretary of the UN Climate Change Patricia Espinosa said: “We must keep an eye on the future. As the superstorms and monsoon flooding of last year and the extreme heat and extreme cold of this year show – we still have a long way to go to deliver on the promise of the Paris Climate Change Agreement”.

This year, record warmth was observed across parts of North America, Europe and Asia, as well as the Atlantic, Pacific and Indian Oceans. Record cold May temperatures were limited to northeastern Canada and the northern Atlantic Ocean, off the southern coast of Greenland.

The study published in the journal Nature showed that ice losses from Antarctica are causing sea levels to rise faster today than at any time in the past 25 years. Results of the Ice Sheet Mass Balance Inter-Comparison Exercise (IMBIE).

According to NASA, “Antarctica’s potential contribution to global sea level rise from its land-held ice is almost 7.5 times greater than all other sources of land-held ice in the world combined. The continent stores enough frozen water to raise global sea levels by 190 feet (58 meters), if it were to melt entirely. Knowing how much ice it’s losing is key to understanding the impacts of climate change now and its pace in the future.”

NOAA points to climate change as part of the problem causing the largest wildfires in California.

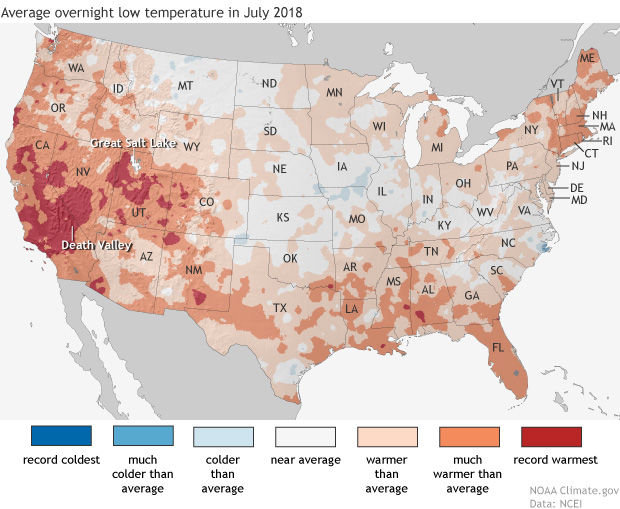
Daytime high temperatures were well above average across much of the western United States in July, but it was overnight low temperatures that were really extreme in large areas of California—where firefighters are battling multiple wildfires—and the Great Basin, and in isolated pockets of Colorado and the Southwest.

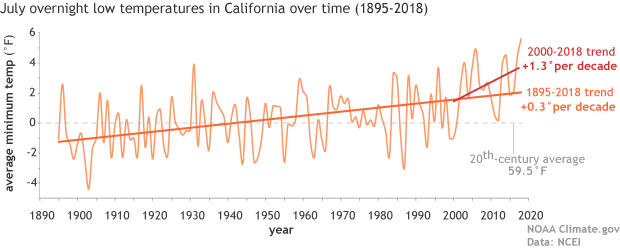
Map of the contiguous United States showing July 2018 overnight low temperature ranksAs the NCEI’s Deke Arndt has blogged about before, nighttime low temperatures are increasing faster than daytime high temperatures across most of the contiguous United States. For much of the West and Southwest, July’s record-breaking nighttime heat is a new highpoint in a long-term trend—one that has rapidly accelerated in recent decades. In California, average overnight low temperature in July rose by 0.3°F per decade over the historical record (1895-2018), but since 2000, the pace of warming has accelerated to 1.3°F per decade.

graph of July minimum temperature 1895–2018 with long-term trend and trend since 2000 shown

Average July minimum temperatures (overnight lows) in California  (light orange line) from 1895–2018. The trend over the historical record is shown in dark orange, and the recent trend (2000-2018) is shown in red. The twentieth-century average is shown with a gray line. NOAA Climate.gov graph, based on data from NCEI’s Climate at a Glance.

According to Tim Brown, director of NOAA’s Western Region Climate Center (WRCC), it’s a pattern that has serious consequences for wildfires and those who combat them. When temperatures cool off overnight, it’s not just a physical relief for firefighters who may be working in conditions that push the limits of human endurance; fire behavior itself relaxes as temperatures drop, winds grow calmer, and relative humidity rises. He explained via email,

Moisture in dead vegetation continuously tries to reach equilibrium with atmospheric moisture. So if nighttime temperature is staying warmer, then the humidity is lower, and the fuels stay drier. A dead fuel moisture reduction of a few percent can increase flammability, flame length, and subsequent overall fire behavior.

When fires remain active at night, it can increase both the time to containment and total burned area, while also affecting public health and safety through more smoke production and lower air quality.  Brown says that qualitatively, there seems to be an increase in firefighters’ reports of active nighttime fire behavior since around 2000.  He and other researchers are currently investigating whether that relationship can be confirmed quantitatively.

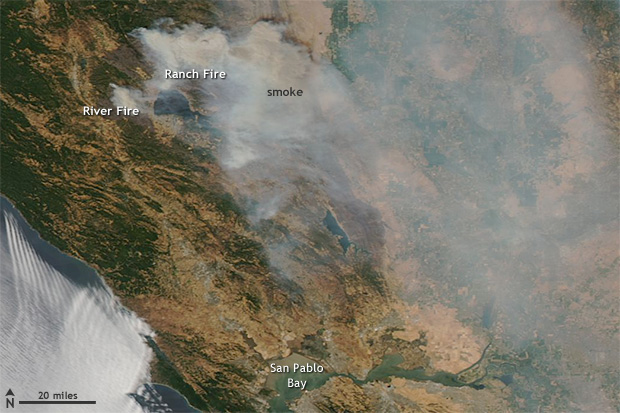
satellite image of fires and smoke near Clear Lake, California on August 6, 2018

NASA Aqua satellite image of the Ranch and River Fires in Northern California on August 6, 2018, with a pall of smoke spreading to the east.  These fires are part of the Mendocino Complex  Fire, which has become the largest fire in California history.  Extreme fire activity in the state was exacerbated by record-warm overnight low temperatures in July. Image from NASA Worldview website.

Nighttime warming has consequences for other aspects of public health. WRCC climatologist Nina Oakley pointed out via email that the South Coast region of California is experiencing the largest warming trends in nighttime temperatures, according to an environmental health hazard report from the California Environmental Protection Agency. In many communities in the region, air conditioning—rarely needed in the past—is uncommon. In addition, since 2000, heat waves in California have become more humid. In the report, experts offered a warning about the change:

People, animals, and plants that are adapted to California’s traditionally dry daytime heat and nighttime cooling are unable to recover from extreme heat, especially when humidity is high at night. The increase in nighttime heat waves presents an additional risk factor for vulnerable populations.

The rapid increase in the rate of warming in California and other parts of the U.S. West since the start of the new century is a sharp reminder that we can’t necessarily count on the future changing as slowly as the past. Asked about the July nighttime heat in California, California state climatologist Mike Anderson answered via email, “As for the past decade or two, we have noticed observations have looked different than the rest of the historical record. We are consistently sampling at the warm edge of the historical distribution now, and expectations are for that to continue, with new records being set with increasing frequency in the coming years.”

Parts of Pennsylvania recorded record rainfall during the summer of 2018 with frequent “tropical downpours” delivering thirteen or more inches of rain in a 5 day period. The Penn Environment Organization released a report entitled, “Hitting Close to Home | Global Warming is Fueling Extreme Weather Across the U.S.”

Weather-related disasters affect millions

  • Since September 2010, counties housing 84 percent of the total Pennsylvania population (over 10 million residents) were affected by federally-declared weather disasters.
  • Pennsylvania experienced five weather-related disasters, including severe storms, tornadoes, floods, and tropical storms since September 2010.

Extreme weather causes widespread destruction

  • In February 2015 a large winter storm and associated cold wave impacted many central, eastern and northeastern states, including Pennsylvania. The storm and cold wave caused at least 30 deaths and the total estimated costs were over $1 billion in the affected region.
  • In October 2012 Hurricane Sandy caused extensive damage to several states, including Pennsylvania from wind, rain, and heavy snow. Hurricane Sandy caused at least 159 deaths and the total estimated costs were $67.6 billion in the affected regions.
  • Since 2010, extreme weather events have caused at least 30 power outages in Pennsylvania, including one outage that lasted 10 days in 2012 during Hurricane Sandy. [3]


Weather extremes are becoming more common 

Globally, 2015 was Earth’s hottest year on record, surpassing 2014. [4] Many types of extreme weather are expected to become more frequent or severe in a warming world, which could lead to more weather-related disasters.

  • Tropical Storms and Hurricanes: Global warming has the potential to make tropical storms more destructive. Hurricanes and other coastal storms are likely to be more powerful [5] and rainier, [6] while storm surges could be more destructive as sea levels rise. [7]
  • Heavy Rain and Snow: Extreme precipitation is already increasing; continued trends could increase the risk of intense downpours, heavy snowstorms and severe flooding. [8]
  • Droughts and Wildfires: While global warming is anticipated to bring more rain to some areas, it will also likely elevate temperatures and extend dry spells. The potential for stronger drought—and greater area burned by wildfires—will increase, particularly in the West and Southwest.

Every year the World Economic Forum publishes the Global Risks Report. This year’s report suggests that experts anticipate another year of heightened risk. From the approximately 1000 respondents of the annual Global Risks Perception Survey, 59% expect an intensified risk, compared to 7% pointing to declining risks.

Environmental risks have grown in prominence over the 13-year history of the Global Risks Report. This trend continues in the 2018 report. All five risks in the environmental category are ranked higher than average in both likelihood and impact over a 10-year horizon.

“Extreme weather events” and “Natural disasters” rank among the top three risks in terms of likelihood and impact. “Failure of climate-change mitigation and adaptation” ranks among the top five.


The Human Induced Climate Change Experiment (Global Warming Research and Educational Materials)

bookmark_borderWildfires: Increase In Extreme Weather

The Membrane Domain started conducting global warming experiments in the 1990’s. It was about 1997 when we suggested the climate in Pennsylvania would turn more like Florida and the climate in California would turn more like Hades. The change wasn’t predicted to take place for hundreds of years. Now, only twenty years later, Pennsylvania has hot humid weather in October and California is on fire.

The Los Angeles Times entitled their article “The climate-change fire alarm from Northern California”. “These kinds of catastrophes have happened and they’ll continue to happen.” Gov. Jerry Brown observed at a news briefing Wednesday. “That’s the way it is with a warming climate, dry weather and reducing moisture.”

The article goes on to say, “California is fortunate to have a governor who understands the perils of ignoring climate change and is aggressively pushing policies to mitigate its future harm. Unfortunately, that puts him at odds with a head-in-the-sand president who blithely disregards the obvious connection between the warming climate and the multiple federal disaster areas he’s been forced to declare in Texas, Florida, Puerto Rico and, now, California.”

An article in Scientific American is entitled “Scientists See Climate Change in California’s Wildfires”. The subtitle is “Strong winds and months of record-high temperatures have fueled the destructive fires.”

As humans add fuel to storm systems, weather will become more extreme.

bookmark_borderClimate Change Breaks Multiple Records with Global Impacts

The World Meteorological Organization (WHO) issued a report that states records for 2016:

  • a record global temperature
  • exceptionally low sea ice
  • unabated sea level rise
  • ocean heat

Extreme weather and climate conditions have continued into 2017.

“This report confirms that the year 2016 was the warmest on record – a remarkable 1.1 °C above the pre-industrial period, which is 0.06 °C above the previous record set in 2015. This increase in global temperature is consistent with other changes occurring in the climate system,” said WMO Secretary-General Petteri Taalas.

“Globally averaged sea surface temperatures were also the warmest on record, global sea levels continued to rise, and Arctic sea-ice extent was well below average for most of the year,” he said.

“With levels of carbon dioxide in the atmosphere consistently breaking new records, the influence of human activities on the climate system has become more and more evident,” said Mr Taalas.

The report goes on to say: Global sea levels rose very strongly during the El Niño event, with the early 2016 values reaching new record highs. Global sea ice extent dropped more than 4 million square kilometres below average in November, an unprecedented anomaly for that month.

The very warm ocean temperatures contributed to significant coral bleaching and mortality was reported in many tropical waters, with important impacts on marine food chains, ecosystems and fisheries.

Carbon dioxide levels in the atmosphere reached the symbolic benchmark of 400 parts per millions in 2015 – the latest year for which WMO global figures are available – and will not fall below that level for many generations to come because of the long-lasting nature of CO2.

Noteworthy extreme events in 2016 included severe droughts that brought food insecurity to millions in southern and eastern Africa and Central America. Hurricane Matthew caused widespread suffering in Haiti as the first category 4 storm to make landfall since 1963, and inflicted significant economic losses in the United States of America, while heavy rains and floods affected eastern and southern Asia.

The extreme weather continues in 2017.
In addition to the report on 2016, the WHO issued a supplement for 2017:
“Even without a strong El Niño in 2017, we are seeing other remarkable changes across the planet that are challenging the limits of our understanding of the climate system. We are now in truly uncharted territory,” said World Climate Research Programme Director David Carlson.

At least three times so far this winter, the Arctic has witnessed the Polar equivalent of a heatwave, with powerful Atlantic storms driving an influx of warm, moist air. This meant that at the height of the Arctic winter and the sea ice refreezing period, there were days which were actually close to melting point. Antarctic sea ice has also been at a record low, in contrast to the trend in recent years.

Scientific research indicates that changes in the Arctic and melting sea ice is leading to a shift in wider oceanic and atmospheric circulation patterns. This is affecting weather in other parts of the world because of waves in the jet stream – the fast moving band of air which helps regulate temperatures.

Thus, some areas, including Canada and much of the USA, were unusually balmy, whilst others, including parts of the Arabian peninsula and North Africa, were unusually cold in early 2017.

In the USA alone, 11,743 warm temperature records were broken or tied in February, according to the US National Oceanic and Atmospheric Administration. Prolonged and extreme heat in January and February affected New South Wales, southern Queensland, South Australia and northern Victoria, and saw many new temperature records.

Highlights of the 2016 Statement

Global Temperatures:

2016’s warmth extended almost worldwide. Temperatures were above the 1961-90 average over the vast majority of the world’s land areas, the only significant exceptions being an area of South America centred on central Argentina, and parts of south-western Australia.

Mean annual temperatures at least 3 °C above the 1961-1990 average occurred in various high-latitude locations, particularly along the Russian coast and in Alaska and far north-western Canada, and on islands in the Barents and Norwegian Seas. In the high Arctic, Svalbard (Norway) Airport’s 2016 mean annual temperature of −0.1 °C was 6.5 °C above the 1961-1990 average, and 1.6 °C above the previous record.

Outside the Arctic, 2016’s warmth was more notable for its consistency across the globe than for its extreme nature in individual locations.

Oceans

Globally averaged sea surface temperatures in 2016 were the warmest on record. The anomalies were strongest in the early months of 2016.

Global ocean heat content was the second-highest on record after 2015. It reached new record highs in the northern hemisphere, but was cooler in the southern hemisphere.

Globally, sea level has risen by 20 cm since the start of the twentieth century, mostly due to thermal expansion of the oceans and melting of glaciers and ice caps. Global sea levels rose very strongly during the 2015/2016 El Niño, rising about 15 millimetres between November 2014 to a new record high in February 2016. This was well above the post-1993 trend of 3 to 3.5 mm per year. From February to August, sea levels remained fairly stable as the influence of the El Niño declined. Final 2016 sea level data are not yet available at the time of writing.

Arctic sea ice

The seasonal maximum, of 14.52 million square kilometres on 24 March, was the lowest in the 1979-2016 satellite record. The 2016 autumn freeze-up was exceptionally slow – with sea ice extent even contracting for a few days in mid-November.

Precipitation

Much of southern Africa began the year in severe drought. For the second year in succession, rainfall was widely 20 to 60% below average for the summer rainy season (October to April) in 2015/2016. The World Food Programme estimating that 18.2 million people would require emergency assistance by early 2017.

Provisional figures showed 2016 was the driest on record over the Amazon Basin, and there was also significant drought in north-east Brazil.  El Niño brought drought conditions elsewhere in Central America and northern South America.

The Yangtze basin in China experienced, overall, its most significant flood season since 1999, with some tributaries experiencing record flood levels. Averaged over China as a whole, it was the wettest year on record, with national mean rainfall of 730 mm being 16% above the long-term average.

Heatwaves

The year started with an extreme heatwave in southern Africa in the first week of January. On 7 January, it reached 42.7 °C at Pretoria and 38.9 °C at Johannesburg, both of which were 3 °C or more above the all-time records at those sites.

Extreme heat also affected South and South-East Asia in April and May, prior to the start of the summer monsoon. South-East Asia was badly affected in April. A national record of 44.6 °C was set at Mae Hong Son, Thailand, on 28 April, and 51.0 °C was observed on 19 May at Phalodi, the highest temperature on record for India.

Record or near-record temperatures occurred in parts of the Middle East and north Africa. The highest temperature observed was 54.0 °C at Mitribah (Kuwait) on 21 July which (subject to ratification) will be the highest temperature on record for Asia. Other extremely high temperatures included 53.9 °C at Basra (Iraq) and 53.0 °C at Delhoran (Islamic Republic of Iran – a national record), both on 22 July, whilst significant high temperatures were also reported in Morocco, Tunisia, Libya and the United Arab Emirates.

A late-season heatwave affected many parts of western and central Europe in the first half of September. In southern Spain, 45.4 °C was recorded at Cordoba on 6 September.

ABOUT WMO
WMO is a specialized agency of the United Nations (UN) with 191 Member States and Territories. It is the UN system’s authoritative voice on the state and behaviour of the Earth’s atmosphere, its interaction with the land and oceans, the weather and climate it produces and the resulting distribution of water resources.
Additional References
Guide To Climate Change
The Human Induced Climate Change Experiment

bookmark_borderCanada Wildfires

FORT MCMURRAY, CANADA — More than 80,000 people needed to be evacuated from the city of Fort McMurray in Canada’s Northern Alberta. The mandatory evacuation covered all of Fort McMurray and is the largest evacuation on record in Canada.

The fire has already destroyed over 1,600 buildings, including a new school. Resident Neil Scott told the BBC: “It was something you’d see in a movie probably. I was stuck between a concrete barrier and the fire and I thought ‘You know what? I might not make it out.’ There’s whole neighbourhoods that are gone. A hotel burned down, a gas station exploded. One lady that I met she actually was sheltered behind like an electrical box when it actually exploded and she felt a shockwave.”

Fort McMurray Wildfire by NASA

bookmark_borderCalifornia Wildfires Burn Over 700 Homes

The extreme weather conditions have fueled wildfires in Northern California.

“I’m in shock. I want to cry. I’m looking at my neighbors’ places, and they’re all gone, and I’m still here,” Middletown homeowner Jim Maurer said. “We’re just shaking our heads.”

The AP reports: The fire and another in the Gold Rush country of the Sierra Nevada foothills, about 120 miles to the southeast, are the worst of a dozen burning in the state. Between them, they have destroyed at least 720 homes and hundreds of other structures and displaced 23,000 people, fire officials said.

Citing dry conditions from four years of drought, Mark Ghilarducci, director of the Governor’s Office of Emergency Services, called this summer’s fires some of the most volatile he’s seen in 30 years of emergency response work.

California Wildfires

bookmark_borderSave the Monkey Puzzle Tree

Wildfires in Chile are threatening the Monkey Puzzle trees (Araucaria araucana) some of which are over a thousand years old. Chile has been in an 8 year drought that is largely blamed on global warming.

“Faced with this critical situation, there is no choice but to assume that the lack of water resources is a reality that is here to stay and that puts at risk the development of important regions of our country” President Bachelet said.

The BBC reports, “Scientists in Chile say they are expecting rainfall to drop significantly by 2050 as the country is increasingly affected by climate change. ”