bookmark_borderClimate Change: Code Red for Humanity

The UN’s IPCC (Intergovernmental Panel on Climate Control) release their latest report that has been compiled and peer-reviewed over the last 8 years.

U.N. Secretary-General, António Guterres described the report as “a code red for humanity.”

“The alarm bells are deafening, and the evidence is irrefutable: greenhouse gas emissions from fossil fuel burning and deforestation are choking our planet and putting billions of people at immediate risk,” said Mr. Guterres.

Some of the changes already set in motion will be “irreversible” for centuries to come.

A press release from the IPCC states:

The report provides new estimates of the chances of crossing the global warming level of 1.5°C in the next decades, and finds that unless there are immediate, rapid and large-scale reductions in greenhouse gas emissions, limiting warming to close to 1.5°C or even 2°C will be beyond reach.

The report shows that emissions of greenhouse gases from human activities are responsible for approximately 1.1°C of warming since 1850-1900, and finds that averaged over the next 20 years, global temperature is expected to reach or exceed 1.5°C of warming. This assessment is based on improved observational datasets to assess historical warming, as well progress in scientific understanding of the response of the climate system to human-caused greenhouse gas emissions.

“This report is a reality check,” said IPCC Working Group I Co-Chair Valérie Masson-Delmotte. “We now have a much clearer picture of the past, present and future climate, which is essential for understanding where we are headed, what can be done, and how we can prepare.”

Every region facing increasing changes

Many characteristics of climate change directly depend on the level of global warming, but what people experience is often very different to the global average. For example, warming over land is larger than the global average, and it is more than twice as high in the Arctic.

“Climate change is already affecting every region on Earth, in multiple ways. The changes we experience will increase with additional warming,” said IPCC Working Group I Co-Chair Panmao Zhai.

The report projects that in the coming decades climate changes will increase in all regions. For 1.5°C of global warming, there will be increasing heat waves, longer warm seasons and shorter cold seasons. At 2°C of global warming, heat extremes would more often reach critical tolerance thresholds for agriculture and health, the report shows.

But it is not just about temperature. Climate change is bringing multiple different changes in different regions – which will all increase with further warming. These include changes to wetness and dryness, to winds, snow and ice, coastal areas and oceans. For example:

* Climate change is intensifying the water cycle. This brings more intense rainfall and associated flooding, as well as more intense drought in many regions.
* Climate change is affecting rainfall patterns. In high latitudes, precipitation is likely to increase, while it is projected to decrease over large parts of the subtropics. Changes to monsoon precipitation are expected, which will vary by region.
* Coastal areas will see continued sea level rise throughout the 21st century, contributing to more frequent and severe coastal flooding in low-lying areas and coastal erosion. Extreme sea level events that previously occurred once in 100 years could happen every year by the end of this century.
* Further warming will amplify permafrost thawing, and the loss of seasonal snow cover, melting of glaciers and ice sheets, and loss of summer Arctic sea ice.
* Changes to the ocean, including warming, more frequent marine heatwaves, ocean acidification, and reduced oxygen levels have been clearly linked to human influence. These changes affect both ocean ecosystems and the people that rely on them, and they will continue throughout at least the rest of this century.
* For cities, some aspects of climate change may be amplified, including heat (since urban areas are usually warmer than their surroundings), flooding from heavy precipitation events and sea level rise in coastal cities.

For the first time, the Sixth Assessment Report provides a more detailed regional assessment of climate change, including a focus on useful information that can inform risk assessment, adaptation, and other decision-making, and a new framework that helps translate physical changes in the climate – heat, cold, rain, drought, snow, wind, coastal flooding and more – into what they mean for society and ecosystems.

This regional information can be explored in detail in the newly developed Interactive Atlas interactive-atlas.ipcc.ch as well as regional fact sheets, the technical summary, and underlying report.

Human influence on the past and future climate

“It has been clear for decades that the Earth’s climate is changing, and the role of human influence on the climate system is undisputed,” said Masson-Delmotte. Yet the new report also reflects major advances in the science of attribution – understanding the role of climate change in intensifying specific weather and climate events such as extreme heat waves and heavy rainfall events.

The report also shows that human actions still have the potential to determine the future course of climate. The evidence is clear that carbon dioxide (CO2) is the main driver of climate change, even as other greenhouse gases and air pollutants also affect the climate.

“Stabilizing the climate will require strong, rapid, and sustained reductions in greenhouse gas emissions, and reaching net zero CO2 emissions. Limiting other greenhouse gases and air pollutants, especially methane, could have benefits both for health and the climate,” said Zhai.

More on The Human Induced Climate Change Experiment

bookmark_borderStrange July Weather

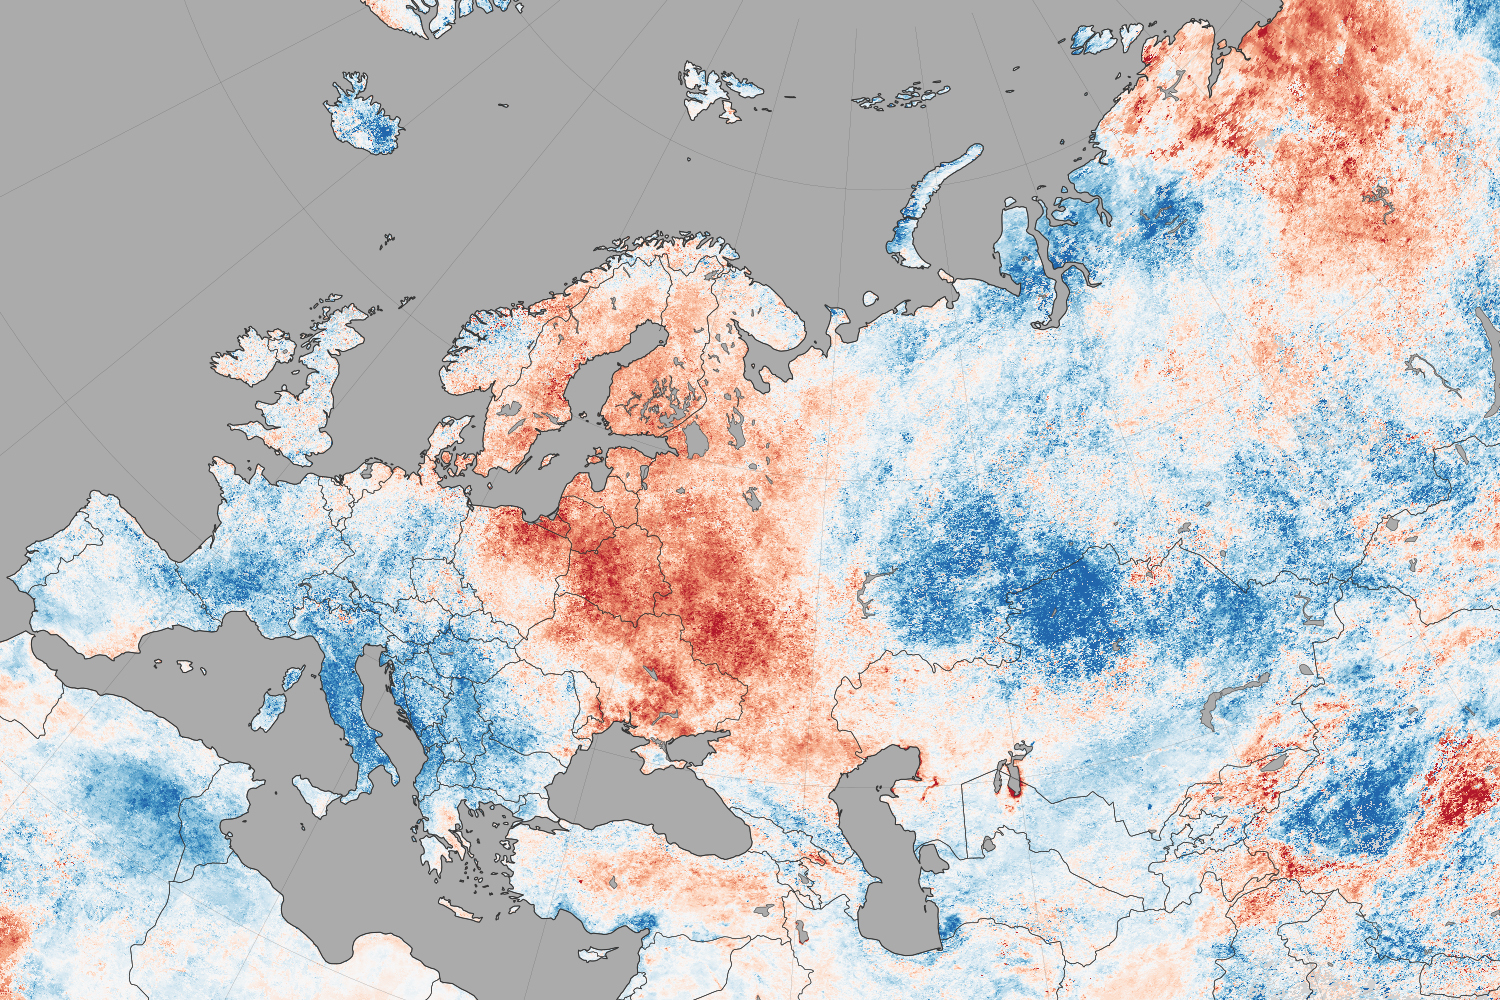
NASA reports that North America weather patterns for July 2014 were upside down:

If you live in the northern hemisphere, the past few weeks have been strange. In places where it should be seasonably hot—the eastern and southern United States and western Europe—it’s just been warm. In places where weather is usually mild in the summer—northern Europe, the Pacific coast of North America—it has been ridiculously hot.

Records for high temperatures (mid-30s°C, mid-90s°F) were approached or broken in Latvia, Poland, Belarus, Estonia, Lithuania, and Sweden in late July and early August. Searing temperatures also dried out forests and fueled wildfires in Siberia; in the U.S. states of Oregon, Washington, and California; in the Canadian provinces of British Columbia, Alberta, and Northwest Territories; and even in Sweden. At the same time, cool air moved from high northern latitudes into much of the U.S., setting record-low daytime and nighttime temperatures as far south as Florida and Georgia. Temperatures dropped to the winter-like levels in the mountains of Tennessee.

The maps on this page shows land surface temperature (LST) anomalies for July 27–August 3, 2014. They were built from data collected by the Moderate Resolution Imaging Spectroradiometer (MODIS) on NASA’s Aqua satellite, and the 2014 data is compared to the average for the same week as observed from 2005–2013. You can visit NASA Earth Observations for a view of temperature anomalies for the entire month of July.

Unusual July Temperatures

Color bar for Unusual July Temperatures

Observed by satellites uniformly across the entire globe, land surface temperatures are a measure of the amount of infrared energy (thermal radiance) emitted by Earth’s surface as it is heated by daylight and cooled in the dark of night. LSTs are sometimes referred to as land “skin” temperatures, and indeed they are a reflection of how hot a surface would feel to the touch. LST anomalies, as shown on this page, are not absolute temperatures; instead, they show how much temperatures were above or below the average. The darkest reds show areas that were as much as 10°C (20°F) above the norm; blues show areas that were below normal; light gray depicts areas with incomplete data (often due to cloud cover, such as in the area of the Indian monsoon); dark gray is ocean.

Meteorologists saw several possible and related causes for the heat waves and cooling patterns. High pressure systems over Scandinavia and northern Russia, as well as over the Pacific Northwest of North America, allowed stable air masses to build up heat domes and “block” incoming fronts that could bring changes in winds, precipitation, and temperatures. These blocking patterns worked together with unusual bends and meanders in the jet stream, which took on a see-sawing north-south pattern over the northern hemisphere. The jet moved air northward over the Pacific Ocean and warmed northwest Canada and the west coast of the U.S.; it dove south from cooler areas of Canada into the central and eastern U.S.; and it drove warm Atlantic air north into northern Europe. The jet took a similar north-south zig-zag in western and eastern Siberia. This pattern is more common in winter than in summer.

bookmark_borderCollapse Of West Antarctica

The collapse of the ice sheet in West Antarctica have raised concern about the rising sea level.

“This is really happening,” Thomas P. Wagner, who runs NASA’s programs on polar ice, said. “There’s nothing to stop it now. But you are still limited by the physics of how fast the ice can flow.”

“Today we present observational evidence that a large sector of the West Antarctic ice sheet has gone into irreversible retreat,” Dr. Rignot said in the NASA news conference. “It has passed the point of no return.”

“Even if the warm water now eating away at the ice were to dissipate, it would be too little, too late to stabilize the ice sheet,” Dr. Joughin said. “There’s no stabilization mechanism.”

“If we have indeed lit the fuse on West Antarctica, it’s very hard to imagine putting the fuse out,” Dr. Alley said. “But there’s a bunch more fuses, and there’s a bunch more matches, and we have a decision now: Do we light those?”

The NASA study says:
A new study by researchers at NASA and the University of California, Irvine, finds a rapidly melting section of the West Antarctic Ice Sheet appears to be in an irreversible state of decline, with nothing to stop the glaciers in this area from melting into the sea.

The study presents multiple lines of evidence, incorporating 40 years of observations that indicate the glaciers in the Amundsen Sea sector of West Antarctica “have passed the point of no return,” according to glaciologist and lead author Eric Rignot, of UC Irvine and NASA’s Jet Propulsion Laboratory (JPL) in Pasadena, California. The new study has been accepted for publication in the journal Geophysical Research Letters.

These glaciers already contribute significantly to sea level rise, releasing almost as much ice into the ocean annually as the entire Greenland Ice Sheet. They contain enough ice to raise global sea level by 4 feet (1.2 meters) and are melting faster than most scientists had expected. Rignot said these findings will require an upward revision to current predictions of sea level rise.

“This sector will be a major contributor to sea level rise in the decades and centuries to come,” Rignot said. “A conservative estimate is it could take several centuries for all of the ice to flow into the sea.”

Three major lines of evidence point to the glaciers’ eventual demise: the changes in their flow speeds, how much of each glacier floats on seawater, and the slope of the terrain they are flowing over and its depth below sea level. In a paper in April, Rignot’s research group discussed the steadily increasing flow speeds of these glaciers over the past 40 years. This new study examines the other two lines of evidence.

The glaciers flow out from land to the ocean, with their leading edges afloat on the seawater. The point on a glacier where it first loses contact with land is called the grounding line. Nearly all glacier melt occurs on the underside of the glacier beyond the grounding line, on the section floating on seawater.

Just as a grounded boat can float again on shallow water if it is made lighter, a glacier can float over an area where it used to be grounded if it becomes lighter, which it does by melting or by the thinning effects of the glacier stretching out. The Antarctic glaciers studied by Rignot’s group have thinned so much they are now floating above places where they used to sit solidly on land, which means their grounding lines are retreating inland.

“The grounding line is buried under a thousand or more meters of ice, so it is incredibly challenging for a human observer on the ice sheet surface to figure out exactly where the transition is,” Rignot said. “This analysis is best done using satellite techniques.”

The team used radar observations captured between 1992 and 2011 by the European Earth Remote Sensing (ERS-1 and -2) satellites to map the grounding lines’ retreat inland. The satellites use a technique called radar interferometry, which enables scientists to measure very precisely — within less than a quarter of an inch — how much Earth’s surface is moving. Glaciers move horizontally as they flow downstream, but their floating portions also rise and fall vertically with changes in the tides. Rignot and his team mapped how far inland these vertical motions extend to locate the grounding lines.

The accelerating flow speeds and retreating grounding lines reinforce each other. As glaciers flow faster, they stretch out and thin, which reduces their weight and lifts them farther off the bedrock. As the grounding line retreats and more of the glacier becomes waterborne, there’s less resistance underneath, so the flow accelerates.

Slowing or stopping these changes requires pinning points — bumps or hills rising from the glacier bed that snag the ice from underneath. To locate these points, researchers produced a more accurate map of bed elevation that combines ice velocity data from ERS-1 and -2 and ice thickness data from NASA’s Operation IceBridge mission and other airborne campaigns. The results confirm no pinning points are present upstream of the present grounding lines in five of the six glaciers. Only Haynes Glacier has major bedrock obstructions upstream, but it drains a small sector and is retreating as rapidly as the other glaciers.

The bedrock topography is another key to the fate of the ice in this basin. All the glacier beds slope deeper below sea level as they extend farther inland. As the glaciers retreat, they cannot escape the reach of the ocean, and the warm water will keep melting them even more rapidly.

The accelerating flow rates, lack of pinning points and sloping bedrock all point to one conclusion, Rignot said.

“The collapse of this sector of West Antarctica appears to be unstoppable,” he said. “The fact that the retreat is happening simultaneously over a large sector suggests it was triggered by a common cause, such as an increase in the amount of ocean heat beneath the floating sections of the glaciers. At this point, the end of this sector appears to be inevitable.”

Because of the importance of this part of West Antarctica, NASA’s Operation IceBridge will continue to monitor its evolution closely during this year’s Antarctica deployment, which begins in October. IceBridge uses a specialized fleet of research aircraft and the most sophisticated suite of science instruments ever assembled to characterize changes in thickness of glaciers, ice sheets and sea ice.

bookmark_borderClimate Change Time Machine

NASA has developed a web application that allows you to view the sea ice declining, sea level, carbon emissions and average temperature rising over time: Climate Time Machine


bookmark_borderWhat Is Global Warming

by the National Oceanic And Atmospheric Administration

What is Global Warming?

sun.jpg, photo courtesy of NOAA Photo Library
The term Global Warming refers, without any implications for the cause or magnitude, to the observation that the atmosphere near the Earth’s surface is warming. This warming is one of many kinds of climate change that the Earth has gone through in the past and will continue to go through in the future.

Why is Global Warming important?

Temperature increases will have significant impacts on human activities, including: where we can live, what food we can grow, how and where we can grow food, and where organisms we consider pests can thrive. To be prepared for the effects of these potential impacts we need to know how much the Earth is warming, how long the Earth has been warming, and what has caused the warming. Answers to these questions provide us with a better basis for making decisions related to issues such as water resources and agricultural planning.

What is the Greenhouse Effect?

Greenhouse effect image Our planet absorbs radiant energy from the sun and emits some of that energy back to space. The term greenhouse effect describes how water vapor, carbon dioxide, and other “greenhouse” gases in the atmosphere alter the return of energy to space, and in turn, change the temperature at the Earth’s surface. These greenhouse gases absorb some of the energy that is emitted from the Earth’s surface, preventing this energy from being lost to space. As a result, the lower atmosphere warms and sends some of this energy back to the Earth’s surface. When the energy is “recycled” in this way, the Earth’s surface warms.

Life on Earth would be very different without the greenhouse effect. The greenhouse effect keeps the long term annual average temperature of the Earth’s surface approximately 32°C (or about 58°F) higher than it would be otherwise.

How is the Greenhouse Effect related to Global Warming?

Greenhouse gases occur naturally in the Earth’s atmosphere, but are also being added by human activities. This happens primarily through the burning of fossil fuels, such as coal, oil and natural gas, which releases carbon dioxide to the atmosphere. Over the past century, atmospheric carbon dioxide (as measured from ice cores) has increased due to human activities from 300 to 380 parts per million (ppm), and the average Earth temperature has increased approximately 0.7°C (or about 1.3°F).

Co2 image
Given what we know about the ability of greenhouse gases to warm the Earth’s surface, it is reasonable to expect that as concentrations of greenhouse gases in the atmosphere rise above natural levels, the Earth’s surface will become increasingly warm. Many scientists have now concluded that global warming can be explained by a human-caused enhancement of the greenhouse effect.

It is important to remember both that the greenhouse effect occurs naturally, and that it has been intensified by humankind’s input of greenhouse gases into the atmosphere.

Are Ozone Holes related to Global Warming or the Greenhouse Effect?

ozone.gif, photo courtesy of NASA The formation of ozone holes is related to these scientific issues, yet is still distinct.
Ozone plays a very important, natural role in the upper atmosphere (called the stratosphere), where 90% of it exists. Stratospheric ozone acts as a shield against harmful ultraviolet (UV) radiation from the sun. This ozone can be destroyed by human-produced chemical compounds called chlorofluorocarbons, or CFCs. When these CFCs are combined with extremely cold stratospheric temperatures over the poles, solar radiation, and particular patterns of atmospheric circulation, chemical reactions occur that cause “Ozone Holes” over Antarctica (pictured above) and the Arctic.

The formation of ozone holes is related to global warming and the greenhouse effect in two ways. First, CFCs are greenhouse gases. Thus, the release of these compounds into the atmosphere will have two separate effects: to destroy ozone and to add to the greenhouse effect. Second, if stratospheric temperatures or patterns of atmospheric circulation change as part of global warming, this will affect the chemical reactions that destroy ozone and cause the ozone holes to either grow or shrink.

daily ozone image
For daily updated images of the ozone, please visit NOAA’s Stratosphere: SBUV-2 Total Ozone Page with images of the ozone from the NOAA-14 Satellite by clicking here or on image at left.

bookmark_borderSevere Weather The New Normal

Human Induced Climate Change Experiment

A study mandated by congress highlights the cost of global warming to United States citizens. One of the most significant costs is the impact of more severe weather events.

A LETTER TO THE AMERICAN PEOPLE

Climate change, once considered an issue for a distant future, has moved firmly into the present.  This report of the National Climate Assessment and Development Advisory Committee  concludes that the evidence for a changing climate has strengthened considerably since the last  National Climate Assessment report, written in 2009. Many more impacts of human-caused  climate change have now been observed. Corn producers in Iowa, oyster growers in Washington  State, and maple syrup producers in Vermont have observed changes in their local climate that  are outside of their experience. So, too, have coastal planners from Florida to Maine, water  managers in the arid Southwest and parts of the Southeast, and Native Americans on tribal lands  across the nation.

Americans are noticing changes all around them. Summers are longer and hotter, and periods of  extreme heat last longer than any living American has ever experienced. Winters are generally  shorter and warmer. Rain comes in heavier downpours, though in many regions there are longer dry spells in between.

Other changes are even more dramatic. Residents of some coastal cities see their streets flood  more regularly during storms and high tides. Inland cities near large rivers also experience more  flooding, especially in the Midwest and Northeast. Hotter and drier weather and earlier snow melt mean that wildfires in the West start earlier in the year, last later into the fall, threaten more homes, cause more evacuations, and burn more acreage. In Alaska, the summer sea ice that once protected the coasts has receded, and fall storms now cause more erosion and damage that is severe enough that some communities are already facing relocation.

Scientists studying climate change confirm that these observations are consistent with Earth’s  climatic trends. Long-term, independent records from weather stations, satellites, ocean buoys, tide gauges, and many other data sources all confirm the fact that our nation, like the rest of the world, is warming, precipitation patterns are changing, sea level is rising, and some types of  extreme weather events are increasing. These and other observed climatic changes are having 26 wide-ranging impacts in every region of our country and most sectors of our economy. Some of these changes can be beneficial, such as longer growing seasons in many regions and a longer shipping season on the Great Lakes. But many more have already proven to be detrimental, largely because society and its infrastructure were designed for the climate of the past, not for the rapidly changing climate of the present or the future.

This National Climate Assessment collects, integrates, and assesses observations and research  from around the country, helping to show what is actually happening and what it means for peoples’ lives, livelihoods, and future. This report includes analyses of impacts on seven selected sectors: human health, water, energy, transportation, agriculture, forests, and ecosystems and biodiversity. This report additionally focuses on the interactions among several sectors at the  national level. It also assesses key impacts on the regions of the U.S.: Northeast, Southeast and Caribbean, Midwest, Great Plains, Southwest, Northwest, Alaska and the Arctic, Hawaii and the Pacific Islands; as well as coastal areas, oceans, and marine resources. Finally, this report is the  first to explicitly assess the current state of adaptation, mitigation, and decision support activities.

STUDY

1. Executive Summary

2. Our Changing Climate

Introduction to Sectors

3. Water Resources

4. Energy Supply and Use

5. Transportation

6. Agriculture

7. Forestry

8. Ecosystems, Biodiversity, and Ecosystem Services

9. Human Health

10. Water, Energy, and Land Use

11. Urban Systems, Infrastructure, and Vulnerability

12. Impacts of Climate Change on Tribal, Indigenous, and Native Lands and Resources

13. Land Use and Land Cover Change

14. Rural Communities

15. Interactions of Climate Change and Biogeochemical Cycles

Introduction to Regions

16. Northeast

17. Southeast and Caribbean

18. Midwest

19. Great Plains

20. Southwest*

21. Northwest

22. Alaska and the Arctic

23. Hawaii and the U.S. Affiliated Pacific Islands

24. Oceans and Marine Resources

25. Coastal Zone Development and Ecosystems

Introduction to Response Strategies

26. Decision Support: Supporting Policy, Planning, and Resource Management Decisions in a Climate Change Context

27. Mitigation

28. Adaptation

29. Research Agenda for Climate Change Science

30. The NCA Long-Term Process: Vision and Future Development

Appendix I: NCA Climate Science – Addressing Commonly Asked Questions from A to Z

Appendix II: The Science of Climate Change

bookmark_borderWarmest Year on Record

The Human Induced Climate Change Experiment

According to NOAA scientists, the average temperature for the contiguous U.S. for 2012 was 55.3°F, which was 3.2°F above the 20th century average and 1.0°F above the previous record from 1998. The year consisted of the fourth warmest winter, a record warm spring, the second warmest summer, and a warmer-than-average autumn. Although the last four months of 2012 did not bring the same unusual warmth as the first 8 months of the year, the September through December temperatures were warm enough for 2012 to remain the record warmest year, by a wide margin.

The average precipitation total for the contiguous U.S. for 2012 was 26.57 inches, 2.57 inches below average, and the 15th driest year on record for the nation.

The U.S. Climate Extremes Index indicated that 2012 was the second most extreme year on record for the nation. The index, which evaluates extremes in temperature and precipitation, as well as landfalling tropical cyclones, was nearly twice the average value and second only to 1998.

Additional Resources        

bookmark_borderAre Bio-fuels Worse for the Environment?

by Daniel Brouse
The Membrane Domain

Q: Are bio-fuels, ethanol, and re-cycled restaurant oils worse for the environment?
A: Yes.

The more volatile nature and ozone emissions used as a fossil fuel substitute appear to be much more harmful to the environment than fossil fuels.  Though fossil fuels need to be eliminated as soon as possible, care should be taken.


CALIFORNIA, USA — State officials have argued since 1999 that the volatility of ethanol, a fuel blend made from corn that evaporates easily, contributes to smog by increasing ozone levels and adding particulates to the air.


REFERENCES:
End The Use Of Bio-fuels

Does Ethanol Use Result in More Air Pollution? More Bad Ozone?

Dying Trees

Land and Water Degradation Lead to Food Shortages