bookmark_borderThe End of Days: Floods

While record breaking droughts have been recorded on 5 of the 6 continents Africa, Australia, North and South America, and Eurasia, parts of the world are also seeing recorded breaking floods.

“A warmer atmosphere holds more moisture—about 7 percent more per 1.8°F (1°C) of warming—and scientists have already observed a significant increase in atmospheric moisture due to the air’s ability to hold more moisture as it warms,” reports Climate Signals.

The increased moisture in the air can create atmospheric rivers.

As the Earth warms, the air will hold more moisture. More moisture-laden air moves over land and creates atmospheric rivers (Pineapple Express). The Journal EOS in the article Atmospheric Rivers Spur High-Tide Floods on U.S. West Coast said, “Atmospheric rivers are narrow bands of moisture that travel across the lower troposphere, generally at the leading edges of massive low-pressure systems. At their peak, they can carry as much water through the sky as the Amazon River does on land. They unleash intense winds and heavy rain as they surge across the Pacific Ocean, eventually making landfall on the U.S. West Coast, contributing to many high-tide flooding events.”

The atmospheric rivers also bring heavy rainfall inland causing extreme flooding.

2022 has brought record flooding to much of the world:

* All across Appalachian Eastern Kentucky, the story of flood victims is the same: Homes that they had lived in for decades, properties that were safe for generations were wiped out by a 1,000-year flood of torrential rain. — Time

“My papaw was almost 80 years old. He lost everything in the house that he has lived in since he was two years old,” says Lakyn Bolen, 26, a resident of Knott County, where 14 inches of rain fell. “It’s nothing that we’re used to, we don’t get stuff like this. And the thing is, a lot of the people in this area don’t have flood insurance because they’re not even in a flood zone.”

* Residents in the area of Dallas, Texas are recovering from torrential rains and floodwaters that inundated entire neighborhoods and roads and prompted dozens of high-water rescues this week. More than 100 homes have been damaged after parts of the Dallas area saw more than 10 inches of rainfall on Monday. Flooding also caused sanitary sewers to overflow in several locations. — CNBC

* Officials hope to fully reopen the main highway from Los Angeles to Phoenix by early next week after a flash flood washed out part of the road through the Southern California desert. — AP

* After record-setting rainfall this week, Jackson, Mississippi, is preparing for the Pearl River to reach 36 feet by Tuesday, leading to flooded streets. — CNN

* Authorities in eastern New Mexico on Wednesday warned residents of continued flooding along the Pecos River. Storm runoff has led to historic flows, prompting the National Weather Service to issue a flood warning for the area near Lake Arthur. — AP

* SALT LAKE CITY (AP) — An Arizona woman has died after she was swept away during flash flooding four days ago at Utah’s Zion National Park, officials said Tuesday. — AP

* The Pakistan floods have been compared to The End of Days with desperation and displacement in Sindh province. The floods have killed nearly 1,000 people across Pakistan since June, while thousands have been displaced – and millions more affected. The full scale of the devastation in the province is yet to be fully understood – but the people described it as the worst disaster they’ve survived. Floods are not uncommon in Pakistan, but people here said these rains were different – more than anything that’s ever been seen. One local official called them “floods of biblical proportions”. — BBC

* Heavy rains set off flash floods, killing 182 in Afghanistan. At least 182 people have been killed and hundreds more injured during a month of heavy flooding from seasonal rains in Afghanistan, according to the United Nations and the ruling Taliban. — AP

* A tropical storm blew out of the northern Philippines on Wednesday, leaving at least three people injured and thousands displaced and prompting authorities to shut down schools and government offices in the capital and several provinces prone to flooding and landslides. — AP

* Torrential rainfall hit Paris on Tuesday evening after a recent heatwave across France, flooding metro stations in the French capital. — France 24

* The death toll from flash floods in Sudan since the start of the country’s rainy season in May has climbed to at least 89, an official said Tuesday, as the downpours continued to inundate villages across the east African nation. — AP

* Mass floods and heatwaves hit Asia: the role of global warming in extreme weather events. In recent weeks, India and Bangladesh have experienced floods that have killed close to 200 people and displaced 7 million. Beyond these numbers, these events pose serious consequences for people’s livelihoods, whether in rural areas or urban settings. — France 24

* Days of deadly floods and landslides wreak havoc in Iran. Dozens are dead and at least 45 people missing after most Iranian provinces were affected by the inundations (of rain and mudslides.) — Al Jazeera

More articles on Flood Insurance, Rising Sea Levels and Global Warming.

bookmark_borderClimate Change: Code Red for Humanity

The UN’s IPCC (Intergovernmental Panel on Climate Control) release their latest report that has been compiled and peer-reviewed over the last 8 years.

U.N. Secretary-General, António Guterres described the report as “a code red for humanity.”

“The alarm bells are deafening, and the evidence is irrefutable: greenhouse gas emissions from fossil fuel burning and deforestation are choking our planet and putting billions of people at immediate risk,” said Mr. Guterres.

Some of the changes already set in motion will be “irreversible” for centuries to come.

A press release from the IPCC states:

The report provides new estimates of the chances of crossing the global warming level of 1.5°C in the next decades, and finds that unless there are immediate, rapid and large-scale reductions in greenhouse gas emissions, limiting warming to close to 1.5°C or even 2°C will be beyond reach.

The report shows that emissions of greenhouse gases from human activities are responsible for approximately 1.1°C of warming since 1850-1900, and finds that averaged over the next 20 years, global temperature is expected to reach or exceed 1.5°C of warming. This assessment is based on improved observational datasets to assess historical warming, as well progress in scientific understanding of the response of the climate system to human-caused greenhouse gas emissions.

“This report is a reality check,” said IPCC Working Group I Co-Chair Valérie Masson-Delmotte. “We now have a much clearer picture of the past, present and future climate, which is essential for understanding where we are headed, what can be done, and how we can prepare.”

Every region facing increasing changes

Many characteristics of climate change directly depend on the level of global warming, but what people experience is often very different to the global average. For example, warming over land is larger than the global average, and it is more than twice as high in the Arctic.

“Climate change is already affecting every region on Earth, in multiple ways. The changes we experience will increase with additional warming,” said IPCC Working Group I Co-Chair Panmao Zhai.

The report projects that in the coming decades climate changes will increase in all regions. For 1.5°C of global warming, there will be increasing heat waves, longer warm seasons and shorter cold seasons. At 2°C of global warming, heat extremes would more often reach critical tolerance thresholds for agriculture and health, the report shows.

But it is not just about temperature. Climate change is bringing multiple different changes in different regions – which will all increase with further warming. These include changes to wetness and dryness, to winds, snow and ice, coastal areas and oceans. For example:

* Climate change is intensifying the water cycle. This brings more intense rainfall and associated flooding, as well as more intense drought in many regions.
* Climate change is affecting rainfall patterns. In high latitudes, precipitation is likely to increase, while it is projected to decrease over large parts of the subtropics. Changes to monsoon precipitation are expected, which will vary by region.
* Coastal areas will see continued sea level rise throughout the 21st century, contributing to more frequent and severe coastal flooding in low-lying areas and coastal erosion. Extreme sea level events that previously occurred once in 100 years could happen every year by the end of this century.
* Further warming will amplify permafrost thawing, and the loss of seasonal snow cover, melting of glaciers and ice sheets, and loss of summer Arctic sea ice.
* Changes to the ocean, including warming, more frequent marine heatwaves, ocean acidification, and reduced oxygen levels have been clearly linked to human influence. These changes affect both ocean ecosystems and the people that rely on them, and they will continue throughout at least the rest of this century.
* For cities, some aspects of climate change may be amplified, including heat (since urban areas are usually warmer than their surroundings), flooding from heavy precipitation events and sea level rise in coastal cities.

For the first time, the Sixth Assessment Report provides a more detailed regional assessment of climate change, including a focus on useful information that can inform risk assessment, adaptation, and other decision-making, and a new framework that helps translate physical changes in the climate – heat, cold, rain, drought, snow, wind, coastal flooding and more – into what they mean for society and ecosystems.

This regional information can be explored in detail in the newly developed Interactive Atlas interactive-atlas.ipcc.ch as well as regional fact sheets, the technical summary, and underlying report.

Human influence on the past and future climate

“It has been clear for decades that the Earth’s climate is changing, and the role of human influence on the climate system is undisputed,” said Masson-Delmotte. Yet the new report also reflects major advances in the science of attribution – understanding the role of climate change in intensifying specific weather and climate events such as extreme heat waves and heavy rainfall events.

The report also shows that human actions still have the potential to determine the future course of climate. The evidence is clear that carbon dioxide (CO2) is the main driver of climate change, even as other greenhouse gases and air pollutants also affect the climate.

“Stabilizing the climate will require strong, rapid, and sustained reductions in greenhouse gas emissions, and reaching net zero CO2 emissions. Limiting other greenhouse gases and air pollutants, especially methane, could have benefits both for health and the climate,” said Zhai.

More on The Human Induced Climate Change Experiment

bookmark_borderDroughts and Rising Sea Levels

“There has been a 500% increase in the US drought area,” said Al Roker of the Today show while reporting on 2020 being tied for the hottest year.

The Washington Post reports, “Drought is the sleeper weather story you’ll hear more about in 2021.” [1}

“The impact of desertification is intensifying due to climate change, which is reducing the availability of freshwater, fertile soil, and forest and vegetation. As the degraded land loses value, investments in agriculture and rural development decline even more.” — Ban Ki-moonUnited Nations Secretary-General [2}

This doesn’t have to do with drought episodes. It has to do with areas prone to having droughts. As the area of land that is prone to flooding is increasing exponentially, so too is the land prone to severe, long term drought. We make it even worse by pumping ground water out for agriculture. This depletes the aquifers. The result is sinking land and rising sea levels. The depleted fresh water is then intruded by salt water. Salt water intrusion has a severe impact on the world food supply.

So, you have rising seas above and below the land. Compounding the problem — water expands when it gets warmer. About 1/3 of the rise in sea level is due to thermal expansion of water. [Volumetric Thermal Expansion] The warmer sea water also melts sea ice. The ocean doesn’t reflect the energy the way ice does. In fact just he opposite, the ocean absorbs the heat… making the water warmer… melting more sea ice…. and warming the planet. Which melts the land ice, which raises the sea level. A vicious feedback cycle of fresh water depletion and sea level rise has been created.

Climate change is making weather events more extreme and more frequent. More severe droughts, more severe floods, etc. Energy is being added to the system. “Climate change increases the odds of worsening drought in many parts of the United States and the world in the decades ahead. A changing climate can also alter atmospheric rivers (narrow streams of moisture transported in the atmosphere), which can especially disrupt precipitation patterns in the Western United States. Droughts can persist through a “positive feedback,” where very dry soils and diminished plant cover can further suppress rainfall in an already dry area.” [3]

“Risks from desertification are projected to increase due to climate change (high confidence). The combination of pressures coming from climate variability, anthropogenic climate change and desertification will contribute to poverty, food insecurity, and increased disease burden (high confidence).” [4]

1. Drought is the sleeper weather story you’ll hear more about in 2021. (The Washington Post)
2. DESERTIFICaTION (United Nations)
3. Drought and Climate Change (Center for Energy and Climate Solutions)
4. SPECIAL REPORT: Climate Change and Land Desertification (International Panel on Climate Change)

bookmark_borderBittle at the Baffler on Floods and Sea Level Impacts in the USA

Bittle at the Baffler on flood and sea level impacts in the USA:

“a neighborhood that feels more like an unclaimed frontier than a subdivision in one of the nation’s fastest-growing metropolitan areas. Dogs run free across acres of empty land, the sound of a falling acorn echoes for blocks”

“Funded by the federal government, local governments in coastal states are buying out thousands of homes in vulnerable areas every year, reshaping and breaking up communities as they go. In their wake, the departed residents of these communities have left what may be the country’s first climate ghost towns, abandoned places made uninhabitable by the warming of the planet.”

“the federal bureaucracy tasked with handling response to these disasters still treats them as individual events rather than constituent parts of a larger crisis”

“No one would argue that these projects are useless, but they represent an outmoded way of thinking, one that assumes Mother Nature wreaks havoc in a relatively stable and predictable manner. Recent storm events in particular have disproved that assumption, becoming so monstrous and erratic over the past decade as to make designing the flood barriers of the 2030s and the 2040s a task akin to dressing for the weather on this day ten years from now.”

“what about the lessons no one sees coming? The other question, of course, is why invest in a barricade that you know will someday burst, if not in the 2040s then in the 2050s?”

“While the program often had to borrow money from the Treasury, the sums were once small and quickly repaid. But as the pace of natural disasters has escalated, the cost of flood recovery has outstripped the amount the program’s five million participating households can afford to pay into the central pot, and it has fallen into unprecedented debt. ”

“one house in Houston that flooded on twenty-two separate occasions between 1979 and 2017, filing an insurance claim each time.”

“The people who continue to live in these areas are doing something so risky that the government will at some point no longer be able to subsidize it, whether by repairing homes after a flood or fortifying them against the next one. ”

” “You have some places where there are high property values, high development, and people are incentivized to build there,” she says—think South Beach or the Hamptons. “But then you have these other communities in the same states, where [people are] not living there because it’s prime real estate or they’re wealthy, they’re living there because they historically can’t afford to live anywhere else.” ”

“Where buyouts do occur, they lead to different outcomes for the rich and the poor, disproportionately benefiting wealthier and whiter families who have the means to sustain themselves as they buy new houses and settle in new communities.”

“Even if New York City one day builds a seawall around Manhattan, protecting the East Village forever from the kind of dissolution that took place in Arbor Oaks, hundreds of smaller and less affluent communities will fall apart piece by piece in the coming decades as the storms continue.”

“Americans displaced by weather events often have at most the right to material compensation for whatever property they lost during a natural disaster. Such a system, pegged as it is to real estate valuations, will always reproduce the inequality that existed prior to the catastrophe, if it doesn’t make that inequality even worse.”

“In 2018, when the National Oceanic and Atmospheric Administration (NOAA) finally released new rainfall predictions for Texas, the agency found that storms which were previously considered once-in-a-century events could now be expected every twenty-five years.”

“When the new maps take effect in the early 2020s, Wade says, the floodplain will get much larger … the floodplain area will likely expand from a thin stripe on either side of a creek into a swath of land a mile wide, covering thousands of homes and businesses. ”

“A lot of our job, really, is to physically uncover the environment so we can have a more resilient place,”

” “[There] are entire neighborhoods that are now within the hundred-year floodplain,” and many residents are living there because that’s what they can afford. They aren’t likely to find comparable housing elsewhere for what the county can offer them in a buyout.”

“Our future is part of what we lost,”

“families who can’t move or don’t want to will become the living collateral of the retreat process, their neighborhoods emptied and lives uprooted because of forces well beyond their control: not only the weather itself, but the policies of the people who govern them. ”

https://thebaffler.com/salvos/on-the-waterfronts-bittle

Do you need flood insurance?

  • Homeowners insurance does NOT cover flooding
  • Flood insurance is obtained through the government’s flood insurance program
  • Flood insurance does not cover the basement of a house
  • Flood insurance covers a lifetime maximum of $250,000 in coverage
    This means if you make a claim for $150,000 the maximum coverage for the life of the property drops to $100,000.

The Human Induced Climate Change Experiment

bookmark_borderSea Level Rising Faster

Articles The New York Times “Rising Seas Will Erase More Cities by 2050, New Research Shows” and the BBC “Climate change: Sea level rise to affect ‘three times more people” report:

“Rising seas could affect three times more people by 2050 than previously thought, according to new research, threatening to all but erase some of the world’s great coastal cities.”

New Sea Level Rise Forecast for China

“In other places, the migration caused by rising seas could trigger or exacerbate regional conflicts.”

New estimate versus old estimate:

China – 93 million vs 29 million
Bangladesh – 42 million vs 5 million
India – 36 million vs 5 million
Vietnam – 31 million vs 9 million
Indonesia – 23 million vs 5 million
Thailand – 12 million vs 1 million

bookmark_borderUnderestimated Flood Risk

https://eos.org/opinions/millions-more-americans-face-flood-risks-than-previously-thought

text follows:

Millions More Americans Face Flood Risks Than Previously Thought

A different modeling approach fills large gaps in the U.S. governmentâ??s
flood risk estimates, revealing previously overlooked at-risk areas often
surrounding small flood-prone streams.
A Spring Lake, N.C., resident is carried from her flooded home on 17
September 2018, in the aftermath of Hurricane Florence.
An 84-year-old resident of Spring Lake, N.C., is carried from her flooded
home on 17 September 2018. The home flooded when the Little River, a small
tributary to the Cape Fear River, crested its banks after Hurricane
Florence made landfall. Credit: Joe Raedle/Staff/Getty Images News/Getty
Images

By Oliver Wing, Paul Bates, Christopher Sampson, Andrew Smith, Joseph
Fargione, and Kris Johnson 15 hours ago

Over the past week, the United States saw floodwaters rise near the coast
of North Carolina in the aftermath of Hurricane Florence. Swollen rivers
have effectively cut off Wilmington, a city of some 119,000 residents, and
residents in surrounding regions are being ordered to evacuate as rivers
continue to rise and test the strength of dams. Thus far, the storm has
claimed 36 lives.

The cost in lives and property damage from Florence will take years to
assess; initial estimates suggest that Florenceâ??s damage could reach $30
billion. Add this to last yearâ??s triumvirate of devastating U.S.
hurricanesâ??Harvey, Irma, and Mariaâ??which saw a combined death toll of
3,100 and damages estimated to be $275 billion. Not surprisingly given
these events, decision-makers and the American public are focusing on
issues related to flooding from hurricanes and other sources.

FEMA mapping currently covers only about 60% of the conterminous United
States and may not represent headwater areas and smaller floodplains.
To mitigate potential losses from floods yet to come, we first need an idea
of where these damaging floods can occur. In the United States, this
information is provided by the Federal Emergency Management Agency (FEMA),
which produces maps of flood zones to help enforce regulations under the
National Flood Insurance Program.

The approach FEMA takes involves developing separate hydraulic models for
individual river reaches and then stitching the model outputs together to
generate a nationwide view. This traditional â??bottom-upâ?? approach is
the gold standard in flood inundation modeling.

But although the approach allows important local details to be captured, it
also requires significant resources and time to accomplish. Also, there is
no efficient way to rerun a given simulation to incorporate new data or
test new scenarios. As a result, FEMA mapping currently covers only about
60% of the conterminous United States (CONUS), and the maps may not
represent headwater areas and smaller floodplains.

You may ask, Surely thereâ??s a better way to evaluate flood risks? The
short answer is yes. It involves a â??top-downâ?? approach, harnessing big
data to automatically create flood inundation models from local to global
scales.

A New Approach to Calculating the 100-Year Floodplain

Over the past 5 years, researchers across the globe have started to develop
a set of these alternative top-down approaches to flood inundation modeling
over vast areas, taking advantage of increasingly available large data sets
and high-performance computing resources. These methods take available
digital elevation models (DEMs), river hydrography, and gauging station
data and use them to automatically create flood inundation models of whole
regions, countries, or even the world.

Such approaches do not currently outperform local bespoke modeling, but
many flood management questions can be answered only by consistent flood
maps with the type of complete coverage that these top-down methods
produce. For many flood management questions, it may also be acceptable to
sacrifice a small amount of local accuracy to achieve a national-scale view.

We recently conducted a study [Wing et al., 2018] to quantify the number of
people exposed to flooding in the CONUS using just such a top-down
approach. Our team spanned both sides of the Atlantic, from the University
of Bristol and Fathom (a flood analytics company) in the United Kingdom and
The Nature Conservancy and the Environmental Protection Agency in the
United States.

(top) A new approach shows that 3 times more Americans are exposed to a
1-in-100-year flood than (bottom) FEMAâ??s estimate.
Fig. 1. (top) A large-scale modeling approach [Wing et al., 2018] estimates
the nationwide distribution of people exposed to a 1-in-100-year flood to
be about 3 times the estimate arrived at by (bottom) a local FEMA model
approach.
The regulatory flood zone mapped by FEMA captures the areas of land that
have a 1% or greater chance of being inundated in any given year, or to put
it another way, areas that would be expected to experience at least one
flood every 100 years. Using bottom-up approaches to calculating population
exposure (i.e., within these FEMA flood zones), we estimated that 13
million people are at risk of this so-called 100-year flood (Figure 1).

Our transatlantic team performed the same calculation with an automated,
large-scale hydraulic model covering the entire CONUS at ~30-meter
resolution [Wing et al., 2017]. We found that almost 41 million
peopleâ??more than 3 times the FEMA estimateâ??are exposed to the
possibility of a 100-year flood [Wing et al., 2017; Smith et al., 2015;
Sampson et al., 2015].
Comparing the Flood Maps

Both flood maps are the output of hydraulic models that in their simplest
sense receive input in the form of an extreme river flow. The models then
work out how this translates to flood extent on the ground.

Two key pieces of information are required: the magnitude of the extreme
river flow and the elevation of the adjacent land. The input to both
models, the 1-in-100-year maximum discharge for a particular stretch of
river, is calculated on the basis of historic annual river gauge records.
The lay of the land is determined by a DEM. The quality of DEMs varies
across the United States; the majority of densely populated areas are
covered by highly accurate airborne laser scanning (lidar) data, with
correspondingly sparser coverage in less populated areas.
Flood map in Illinois shows FEMAâ??s tendency to focus on larger rivers,
missing flood risks associated with smaller streams.
Fig. 2. A typical snapshot of the flood maps produced by each model
approach for an area of Illinois demonstrates FEMAâ??s tendency to focus on
larger rivers, missing the flood risk associated with smaller streams. Our
modeling method, on the other hand, captures a finer level of detail.

Thus, although both FEMAâ??s bottom-up approach and our top-down approach
use the same input, the two methods produce different estimates of exposed
populations. Examining the simulation results obtained using both
approaches highlights why the discrepancy in flood-exposed population
estimates arises. Unlike the FEMA map, our map is able to estimate flood
hazard in all basins down to just a few square kilometers in area, thus
capturing the risk posed by smaller streams (Figure 2).

How does our top-down approach achieve a higher precision than FEMAâ??s
bottom-up approach? Our approachâ??s ability to represent smaller streams
is not by virtue of obtaining better or more localized data. Rather, our
spatially consistent, automated, and efficient model-building process,
coupled with our computational capacity, can produce flood maps in every
river basin. In contrast, FEMAâ??s highly detailed approaches take skilled
operators several months to perform for river reaches a few tens of
kilometers in length, and this is why spatial coverage is relatively low.
FEMA engineers triage the larger streams in a catchment, often to the
detriment of the headwaters, whereas our approach captures conditions in
the headwater areas as well.

A map comparing our large-scale model with FEMAâ??s model for an area of
Alabama.
Fig. 3. A map comparing our large-scale model with FEMAâ??s model for an
area of Alabama. The two approaches produce similar results here, where the
FEMA data exist, with our large-scale floodplain model capturing more than
90% of the FEMA floodplain with minimal genuine overprediction. From Wing
et al. [2017].
The caveat here is that our approach sacrifices some local accuracy to
achieve this broad view of flood hazard across the CONUS. In areas where
FEMA models do contain detailed surveys of flow-controlling structures
(e.g., levees, culverts, dikes, bridges), these models will likely
supersede the large-scale alternative. However, a study that performed a
point-by-point comparison between the FEMA model and large-scale models
suggests that where FEMA maps exist, the two approaches often produce
similar results (Figure 3).

Compared to high-quality FEMA flood maps, the large-scale model captured
86% of the specified floodplain [Wing et al., 2017]. The correspondence was
even better on larger rivers, in temperate climates, and in more rural
basins. This top-down model therefore fills in the areas that the bottom-up
FEMA maps miss, such as areas around small streams and across broad swaths
of the midwestern and northwestern United States.

We find that this data gap equates to an extra 28 million Americans living
in the 100-year flood zone. This difference is so large that even amid
likely model uncertainties, it is a significant result.
Implications for Flood Risk Management in the United States

Scientists and policy makers require comprehensive floodplain mapping to
manage U.S. flood risk in a coordinated way. Accurate, engineering-grade
flood models in every river basin in the CONUS would be ideal, but given
realistic financial constraints, it is clear that we need new, affordable
approaches to generating comprehensive national maps.

Through a large-scale modeling approach, nationwide flood maps can be
produced quickly and relatively cheaply.
An understanding of flood risk across the nation, rather than in patches,
could lead to fewer surprises akin to Hurricanes Harvey in Texas and Irma
in Florida. Such a comprehensive understanding could also assist opponents
of continued development in risky areas and ensure that the culture of
preparedness FEMA wishes to build becomes a reality across the country.

In addition, a large-scale modeling approach can answer a number of crucial
questions that cannot be addressed by a patchwork of local models. Because
nationwide flood maps can be produced quickly and relatively cheaply, a
wealth of new products could be generated. For example, in addition to the
100-year floodplain, other return periods can be mapped, which enables
improved risk management through a graded system. With this information,
community authorities could perhaps seek to impose more stringent
regulations on buildings in the 1-in-20-year floodplain while relaxing
those in the 1-in-500-year floodplain.

This nuanced approach could also lead to more realistic risk assessments
and flood preparation measures. Right now, risk zones in maps are treated
as binary, which can be problematic: People who live just outside the
currently mapped 100-year flood boundary do not face considerably less risk
than people who live just within it. Yet new development tends to cluster
around these boundaries, often still in risky areas. Maps that contour
risks in a more detailed way could prevent this effect through ensuring a
smoother gradient of development increase as you move farther outside of
the higher risk zones.
Flood waters from rising rivers inundate the town of Trenton, N.C. on 16
September 2018, following Hurricane Florence.
Floodwaters from rising rivers and streams inundate the town of Trenton,
N.C., on 16 September 2018, following Hurricane Florence. Credit:
Associated Press/Steve Helber

Large-scale and automated modeling approaches offer flexibility as well:
The ability to rerun multiple flood maps allows modelers to test the effect
of different scenarios by perturbing inputs to the model. For example, the
effects of climate change, population growth, land use change, and flood
risk management scenarios can be included for making decisions on a
national scale.

Large-scale models wonâ??t completely replace the bottom-up approach:
Certain decisions can only be made using accurate local modeling
techniques. There is unambiguous value to engineering-grade local models.
Such models are needed, for example, when exploring the effect of
installing or removing levees. Highly localized decisions will still
require a FEMA-style analysis.
What Next for Hydraulic Modelers?

Flood inundation models, two types of which are outlined here, are subject
to fundamental constraints with regard to their accuracy. The performance
of FEMA-style models is approaching a ceiling: The characterization of
extreme flows often imposes a fundamental limit on further model
improvements. Errors of 25% or more are common in gauge observations [Di
Baldassarre and Montanari, 2009], and there are gaps in the data required
for the statistical analysis used to calculate flow return periods [Smith
et al., 2015].

There is little value to a centimeter-scale hydraulic model if you donâ??t
actually know how big the 100-year flow is.
For modeling results to be meaningful, any improvements in calculations
must be accompanied by commensurate improvements in the measured data and
other factors in the modeling approach. For instance, there is little value
to a centimeter-scale hydraulic model if you donâ??t actually know how big
the 100-year flow is.

This need for better data, coupled with the need for many more decades or
even centuries of river flow observations and an expanded river gauge
network, means that the flow characterization gap is not likely to be
resolved any time soon.

There is, however, still plenty of room for improvement in large-scale
modeling. For example, scientists have yet to generate seamless,
hyperresolution DEMs of entire continents, and the remote detection of
local-scale, hydraulically important features is not yet feasible. With
solutions to these problems on the horizon, it may not be long before
large-scale models, too, hit the ceiling imposed by extreme flow
characterization.

Despite these limitations, scientists assessing flood risk could expand and
deepen their insights using a multimodel approach similar to the approach
that climate scientists use. Also, on an international scale, the next big
step is to run flood models with data from the high-accuracy DEM of the
world. Creating a high-resolution global flood hazard model [Sampson et
al., 2015] could help identify at-risk populations in areas like Africa,
South America, and Southeast Asia that donâ??t have FEMA-style local flood
maps.
Floods of Data Can Help Address Flood Risk

To help protect people from floods, we will continue to need a deluge of data.
Without freely available data, we could not have conducted our assessments,
which means that we could not have identified that millions of Americans
face flood risks beyond those charted in FEMA maps. One thing, then, is
clear: To help protect people from floods, we will continue to need a
deluge of data.

Ultimately, better predictions also require better data, which is why
itâ??s so important that the United States continues to fund U.S.
Geological Survey (USGS) efforts to maintain river gauges and expand lidar
data coverage to areas in the United States that lack this coverage. And it
is equally important that the USGS continue to make these data public.
References

Di Baldassarre, G., and A. Montanari (2009), Uncertainty in river discharge
observations: A quantitative analysis, Hydrol. Earth Syst. Sci., 13,
913â??921, https://doi.org/10.5194/hess-13-913-2009.

Sampson, C. C., et al. (2015), A high-resolution global flood hazard model,
Water Resour. Res., 51, 7358â??7381, https://doi.org/10.1002/2015WR016954.

Smith, A., C. Sampson, and P. Bates (2015), Regional flood frequency
analysis at the global scale, Water Resour. Res., 51, 539â??553,
https://doi.org/10.1002/2014WR015814.

Wing, O. E. J., et al. (2017), Validation of a 30 m resolution flood hazard
model of the conterminous United States, Water Resour. Res., 53, 7968-7986,
https://doi.org/10.1002/2017WR020917.

Wing, O. E. J., et al. (2018), Estimates of present and future flood risk
in the conterminous United States, Environ. Res. Lett., 13, 034023,
https://doi.org/10.1088/1748-9326/aaac65.

More About Flood Insurance

bookmark_borderExtreme Weather Events Getting More Extreme

The U.N. has released a report entitled, “Extreme Weather Continues in 2018 – a Continuing Call to Climate Action”.

Addressing the dangers associated with extreme weather conditions, the Executive Secretary of the UN Climate Change Patricia Espinosa said: “We must keep an eye on the future. As the superstorms and monsoon flooding of last year and the extreme heat and extreme cold of this year show – we still have a long way to go to deliver on the promise of the Paris Climate Change Agreement”.

This year, record warmth was observed across parts of North America, Europe and Asia, as well as the Atlantic, Pacific and Indian Oceans. Record cold May temperatures were limited to northeastern Canada and the northern Atlantic Ocean, off the southern coast of Greenland.

The study published in the journal Nature showed that ice losses from Antarctica are causing sea levels to rise faster today than at any time in the past 25 years. Results of the Ice Sheet Mass Balance Inter-Comparison Exercise (IMBIE).

According to NASA, “Antarctica’s potential contribution to global sea level rise from its land-held ice is almost 7.5 times greater than all other sources of land-held ice in the world combined. The continent stores enough frozen water to raise global sea levels by 190 feet (58 meters), if it were to melt entirely. Knowing how much ice it’s losing is key to understanding the impacts of climate change now and its pace in the future.”

NOAA points to climate change as part of the problem causing the largest wildfires in California.

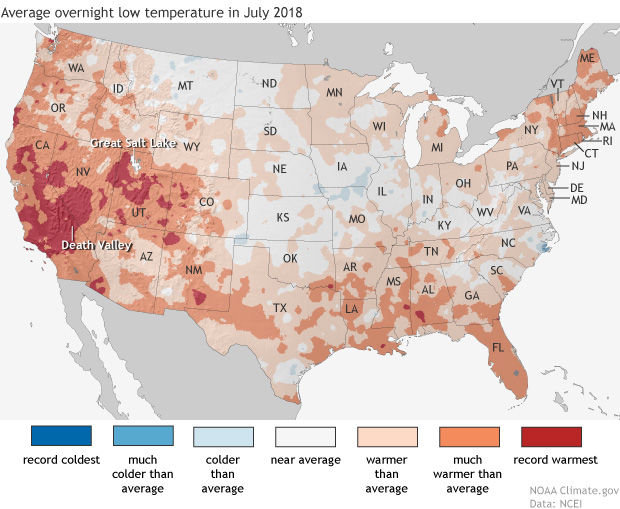
Daytime high temperatures were well above average across much of the western United States in July, but it was overnight low temperatures that were really extreme in large areas of California—where firefighters are battling multiple wildfires—and the Great Basin, and in isolated pockets of Colorado and the Southwest.

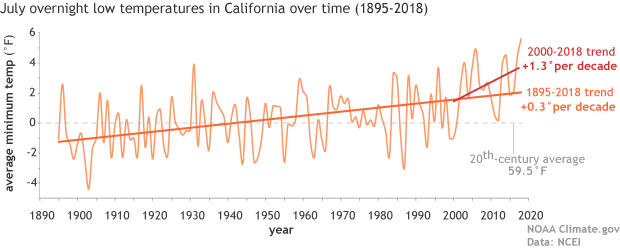
Map of the contiguous United States showing July 2018 overnight low temperature ranksAs the NCEI’s Deke Arndt has blogged about before, nighttime low temperatures are increasing faster than daytime high temperatures across most of the contiguous United States. For much of the West and Southwest, July’s record-breaking nighttime heat is a new highpoint in a long-term trend—one that has rapidly accelerated in recent decades. In California, average overnight low temperature in July rose by 0.3°F per decade over the historical record (1895-2018), but since 2000, the pace of warming has accelerated to 1.3°F per decade.

graph of July minimum temperature 1895–2018 with long-term trend and trend since 2000 shown

Average July minimum temperatures (overnight lows) in California  (light orange line) from 1895–2018. The trend over the historical record is shown in dark orange, and the recent trend (2000-2018) is shown in red. The twentieth-century average is shown with a gray line. NOAA Climate.gov graph, based on data from NCEI’s Climate at a Glance.

According to Tim Brown, director of NOAA’s Western Region Climate Center (WRCC), it’s a pattern that has serious consequences for wildfires and those who combat them. When temperatures cool off overnight, it’s not just a physical relief for firefighters who may be working in conditions that push the limits of human endurance; fire behavior itself relaxes as temperatures drop, winds grow calmer, and relative humidity rises. He explained via email,

Moisture in dead vegetation continuously tries to reach equilibrium with atmospheric moisture. So if nighttime temperature is staying warmer, then the humidity is lower, and the fuels stay drier. A dead fuel moisture reduction of a few percent can increase flammability, flame length, and subsequent overall fire behavior.

When fires remain active at night, it can increase both the time to containment and total burned area, while also affecting public health and safety through more smoke production and lower air quality.  Brown says that qualitatively, there seems to be an increase in firefighters’ reports of active nighttime fire behavior since around 2000.  He and other researchers are currently investigating whether that relationship can be confirmed quantitatively.

satellite image of fires and smoke near Clear Lake, California on August 6, 2018

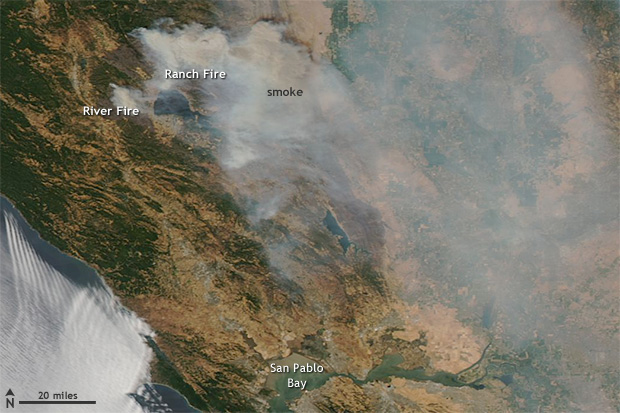
NASA Aqua satellite image of the Ranch and River Fires in Northern California on August 6, 2018, with a pall of smoke spreading to the east.  These fires are part of the Mendocino Complex  Fire, which has become the largest fire in California history.  Extreme fire activity in the state was exacerbated by record-warm overnight low temperatures in July. Image from NASA Worldview website.

Nighttime warming has consequences for other aspects of public health. WRCC climatologist Nina Oakley pointed out via email that the South Coast region of California is experiencing the largest warming trends in nighttime temperatures, according to an environmental health hazard report from the California Environmental Protection Agency. In many communities in the region, air conditioning—rarely needed in the past—is uncommon. In addition, since 2000, heat waves in California have become more humid. In the report, experts offered a warning about the change:

People, animals, and plants that are adapted to California’s traditionally dry daytime heat and nighttime cooling are unable to recover from extreme heat, especially when humidity is high at night. The increase in nighttime heat waves presents an additional risk factor for vulnerable populations.

The rapid increase in the rate of warming in California and other parts of the U.S. West since the start of the new century is a sharp reminder that we can’t necessarily count on the future changing as slowly as the past. Asked about the July nighttime heat in California, California state climatologist Mike Anderson answered via email, “As for the past decade or two, we have noticed observations have looked different than the rest of the historical record. We are consistently sampling at the warm edge of the historical distribution now, and expectations are for that to continue, with new records being set with increasing frequency in the coming years.”

Parts of Pennsylvania recorded record rainfall during the summer of 2018 with frequent “tropical downpours” delivering thirteen or more inches of rain in a 5 day period. The Penn Environment Organization released a report entitled, “Hitting Close to Home | Global Warming is Fueling Extreme Weather Across the U.S.”

Weather-related disasters affect millions

  • Since September 2010, counties housing 84 percent of the total Pennsylvania population (over 10 million residents) were affected by federally-declared weather disasters.
  • Pennsylvania experienced five weather-related disasters, including severe storms, tornadoes, floods, and tropical storms since September 2010.

Extreme weather causes widespread destruction

  • In February 2015 a large winter storm and associated cold wave impacted many central, eastern and northeastern states, including Pennsylvania. The storm and cold wave caused at least 30 deaths and the total estimated costs were over $1 billion in the affected region.
  • In October 2012 Hurricane Sandy caused extensive damage to several states, including Pennsylvania from wind, rain, and heavy snow. Hurricane Sandy caused at least 159 deaths and the total estimated costs were $67.6 billion in the affected regions.
  • Since 2010, extreme weather events have caused at least 30 power outages in Pennsylvania, including one outage that lasted 10 days in 2012 during Hurricane Sandy. [3]


Weather extremes are becoming more common 

Globally, 2015 was Earth’s hottest year on record, surpassing 2014. [4] Many types of extreme weather are expected to become more frequent or severe in a warming world, which could lead to more weather-related disasters.

  • Tropical Storms and Hurricanes: Global warming has the potential to make tropical storms more destructive. Hurricanes and other coastal storms are likely to be more powerful [5] and rainier, [6] while storm surges could be more destructive as sea levels rise. [7]
  • Heavy Rain and Snow: Extreme precipitation is already increasing; continued trends could increase the risk of intense downpours, heavy snowstorms and severe flooding. [8]
  • Droughts and Wildfires: While global warming is anticipated to bring more rain to some areas, it will also likely elevate temperatures and extend dry spells. The potential for stronger drought—and greater area burned by wildfires—will increase, particularly in the West and Southwest.

Every year the World Economic Forum publishes the Global Risks Report. This year’s report suggests that experts anticipate another year of heightened risk. From the approximately 1000 respondents of the annual Global Risks Perception Survey, 59% expect an intensified risk, compared to 7% pointing to declining risks.

Environmental risks have grown in prominence over the 13-year history of the Global Risks Report. This trend continues in the 2018 report. All five risks in the environmental category are ranked higher than average in both likelihood and impact over a 10-year horizon.

“Extreme weather events” and “Natural disasters” rank among the top three risks in terms of likelihood and impact. “Failure of climate-change mitigation and adaptation” ranks among the top five.


The Human Induced Climate Change Experiment (Global Warming Research and Educational Materials)

bookmark_borderFlood Insurance Rates Rising

“your flood insurance premiums could rise up to 18 percent each year”

A recent article in the Miami Herald reports:

“FEMA confirmed to the Miami Herald that it is looking into switching to risk-based pricing in 2020, which would end the subsidies most coastal communities enjoy on their flood insurance premiums and show the true dollar cost of living in areas repeatedly pounded by hurricanes and drenched with floods — like South Florida.

“That means insurance is about to become very expensive, and it kind of sounds the bell that these are high-risk areas,” said Wayne Pathman, a Miami-based land use attorney and chair of the city’s Sea Level Rise Committee.

Premiums through the National Flood Insurance Policy are already rising an average of eight percent this year; the first wave of pricier policies started in April. That brings the average annual price (including surcharges) for a policy holder to $1,062.

It’s all part of a strategy to make the NFIP financially stable. The program is $20 billion in debt (and that’s after the government forgave $16 billion of that debt last year) because it pays out much more each year than it takes in.”

More about Flood Insurance
More about Climate Change

bookmark_borderClimate Change Hammers US Coasts

In a report published by NOAA, the 2017 nation‐wide average annual frequency of high tide flooding hit an all‐time record.

If high tide flooding in 2018 follows historical patterns, flooding will be most common during the winter (Dec‐Feb) along the West Coast and the northern section of Northeast Atlantic Coast in response to winter storms and more‐predictable monthly highest astronomical tides (predicted tides). Along the Gulf and along much of the Atlantic Coasts, flood patterns are less predictable and occur usually in response to weather effects.

Flooding is, however, most common during the fall (Sep‐Nov) when the mean sea level cycle peaks, and more often during monthly highest predicted tides in some Southeast Atlantic locations. Breaking of annual flood records is to be expected next year and for decades to come as sea levels rise, and likely at an accelerated rate (Sweet et al., 2017b).

When high tide flood frequencies along the entire U.S. coastline are averaged (Figure 3b), the 2017 national average of 6 days . . . is record breaking. Rising ocean levels along the U.S. coastline (Figure 3b, blue line) of about 2 mm/year since 1920 are driving (along with local land subsidence) a rapid increase in U.S. high tide flood frequencies. The U.S. average high tide flood frequency is now 50% greater since 2000 and 100% greater than it was 30 years ago.

Also see:
Flood Insurance
Atlantic City Going Under

bookmark_borderCalifornia Increasing Weather Volatility

One of the most notable changes in weather doing to global warming is volatility. “We are not saying that the Earth’s temperature is just going to rise. In general, as energy is added to a system, the fluctuations in the system increase. So, we expect more storms, more droughts, more wildfires, more floods, more fluctuations of all kinds. What we are saying is that weather conditions will become more volatile due to the impact of humans,” said Sidd Mukherjee and Daniel Brouse of The Membrane Domain (2004). The increase in extreme weather events wreak havoc on humans’ ability to adapt to the changing environment. For instance, severe droughts followed by severe rains create devastating floods.

A new study (23 April 2018) published in the Journal Nature, Increasing precipitation volatility in twenty-first-century California, forecasts extreme weather events in California:

Mediterranean climate regimes are particularly susceptible to rapid shifts between drought and flood—of which, California’s rapid transition from record multi-year dryness between 2012 and 2016 to extreme wetness during the 2016–2017 winter provides a dramatic example. Projected future changes in such dry-to-wet events, however, remain inadequately quantified, which we investigate here using the Community Earth System Model Large Ensemble of climate model simulations. Anthropogenic forcing is found to yield large twenty-first-century increases in the frequency of wet extremes, including a more than threefold increase in sub-seasonal events comparable to California’s ‘Great Flood of 1862’. Smaller but statistically robust increases in dry extremes are also apparent. As a consequence, a 25% to 100% increase in extreme dry-to-wet precipitation events is projected, despite only modest changes in mean precipitation. Such hydrological cycle intensification would seriously challenge California’s existing water storage, conveyance and flood control infrastructure.