bookmark_borderClimate Change: Code Red for Humanity

The UN’s IPCC (Intergovernmental Panel on Climate Control) release their latest report that has been compiled and peer-reviewed over the last 8 years.

U.N. Secretary-General, António Guterres described the report as “a code red for humanity.”

“The alarm bells are deafening, and the evidence is irrefutable: greenhouse gas emissions from fossil fuel burning and deforestation are choking our planet and putting billions of people at immediate risk,” said Mr. Guterres.

Some of the changes already set in motion will be “irreversible” for centuries to come.

A press release from the IPCC states:

The report provides new estimates of the chances of crossing the global warming level of 1.5°C in the next decades, and finds that unless there are immediate, rapid and large-scale reductions in greenhouse gas emissions, limiting warming to close to 1.5°C or even 2°C will be beyond reach.

The report shows that emissions of greenhouse gases from human activities are responsible for approximately 1.1°C of warming since 1850-1900, and finds that averaged over the next 20 years, global temperature is expected to reach or exceed 1.5°C of warming. This assessment is based on improved observational datasets to assess historical warming, as well progress in scientific understanding of the response of the climate system to human-caused greenhouse gas emissions.

“This report is a reality check,” said IPCC Working Group I Co-Chair Valérie Masson-Delmotte. “We now have a much clearer picture of the past, present and future climate, which is essential for understanding where we are headed, what can be done, and how we can prepare.”

Every region facing increasing changes

Many characteristics of climate change directly depend on the level of global warming, but what people experience is often very different to the global average. For example, warming over land is larger than the global average, and it is more than twice as high in the Arctic.

“Climate change is already affecting every region on Earth, in multiple ways. The changes we experience will increase with additional warming,” said IPCC Working Group I Co-Chair Panmao Zhai.

The report projects that in the coming decades climate changes will increase in all regions. For 1.5°C of global warming, there will be increasing heat waves, longer warm seasons and shorter cold seasons. At 2°C of global warming, heat extremes would more often reach critical tolerance thresholds for agriculture and health, the report shows.

But it is not just about temperature. Climate change is bringing multiple different changes in different regions – which will all increase with further warming. These include changes to wetness and dryness, to winds, snow and ice, coastal areas and oceans. For example:

* Climate change is intensifying the water cycle. This brings more intense rainfall and associated flooding, as well as more intense drought in many regions.
* Climate change is affecting rainfall patterns. In high latitudes, precipitation is likely to increase, while it is projected to decrease over large parts of the subtropics. Changes to monsoon precipitation are expected, which will vary by region.
* Coastal areas will see continued sea level rise throughout the 21st century, contributing to more frequent and severe coastal flooding in low-lying areas and coastal erosion. Extreme sea level events that previously occurred once in 100 years could happen every year by the end of this century.
* Further warming will amplify permafrost thawing, and the loss of seasonal snow cover, melting of glaciers and ice sheets, and loss of summer Arctic sea ice.
* Changes to the ocean, including warming, more frequent marine heatwaves, ocean acidification, and reduced oxygen levels have been clearly linked to human influence. These changes affect both ocean ecosystems and the people that rely on them, and they will continue throughout at least the rest of this century.
* For cities, some aspects of climate change may be amplified, including heat (since urban areas are usually warmer than their surroundings), flooding from heavy precipitation events and sea level rise in coastal cities.

For the first time, the Sixth Assessment Report provides a more detailed regional assessment of climate change, including a focus on useful information that can inform risk assessment, adaptation, and other decision-making, and a new framework that helps translate physical changes in the climate – heat, cold, rain, drought, snow, wind, coastal flooding and more – into what they mean for society and ecosystems.

This regional information can be explored in detail in the newly developed Interactive Atlas interactive-atlas.ipcc.ch as well as regional fact sheets, the technical summary, and underlying report.

Human influence on the past and future climate

“It has been clear for decades that the Earth’s climate is changing, and the role of human influence on the climate system is undisputed,” said Masson-Delmotte. Yet the new report also reflects major advances in the science of attribution – understanding the role of climate change in intensifying specific weather and climate events such as extreme heat waves and heavy rainfall events.

The report also shows that human actions still have the potential to determine the future course of climate. The evidence is clear that carbon dioxide (CO2) is the main driver of climate change, even as other greenhouse gases and air pollutants also affect the climate.

“Stabilizing the climate will require strong, rapid, and sustained reductions in greenhouse gas emissions, and reaching net zero CO2 emissions. Limiting other greenhouse gases and air pollutants, especially methane, could have benefits both for health and the climate,” said Zhai.
More on The Human Induced Climate Change Experiment

bookmark_borderRecord Temperatures

NASA — Two key climate change indicators — global surface temperatures and Arctic sea ice extent — have broken numerous records through the first half of 2016, according to NASA analyses of ground-based observations and satellite data.

Each of the first six months of 2016 set a record as the warmest respective month globally in the modern temperature record, which dates to 1880, according to scientists at NASA’s Goddard Institute for Space Studies (GISS) in New York. The six-month period from January to June was also the planet’s warmest half-year on record, with an average temperature 1.3 degrees Celsius (2.4 degrees Fahrenheit) warmer than the late nineteenth century.

Five of the first six months of 2016 also set records for the smallest respective monthly Arctic sea ice extent since consistent satellite records began in 1979, according to analyses developed by scientists at NASA’s Goddard Space Flight Center, in Greenbelt, Maryland. The one exception, March, recorded the second smallest extent for that month.

While these two key climate indicators have broken records in 2016, NASA scientists said it is more significant that global temperature and Arctic sea ice are continuing their decades-long trends of change. Both trends are ultimately driven by rising concentrations of heat-trapping carbon dioxide and other greenhouse gases in the atmosphere.

The extent of Arctic sea ice at the peak of the summer melt season now typically covers 40 percent less area than it did in the late 1970s and early 1980s. Arctic sea ice extent in September, the seasonal low point in the annual cycle, has been declining at a rate of 13.4 percent per decade.

“While the El Niño event in the tropical Pacific this winter gave a boost to global temperatures from October onwards, it is the underlying trend which is producing these record numbers,” GISS Director Gavin Schmidt said.

Previous El Niño events have driven temperatures to what were then record levels, such as in 1998. But in 2016, even as the effects of the recent El Niño taper off, global temperatures have risen well beyond those of 18 years ago because of the overall warming that has taken place in that time.

The global trend in rising temperatures is outpaced by the regional warming in the Arctic, said Walt Meier, a sea ice scientist at NASA Goddard.

“It has been a record year so far for global temperatures, but the record high temperatures in the Arctic over the past six months have been even more extreme,” Meier said. “This warmth as well as unusual weather patterns have led to the record low sea ice extents so far this year.”

NASA tracks temperature and sea ice as part of its effort to understand the Earth as a system and to understand how Earth is changing. In addition to maintaining 19 Earth-observing space missions, NASA also sends researchers around the globe to investigate different facets of the planet at closer range. Right now, NASA researchers are working across the Arctic to better understand both the processes driving increased sea ice melt and the impacts of rising temperatures on Arctic ecosystems.

NASA’s long-running Operation IceBridge campaign last week began a series of airborne measurements of melt ponds on the surface of the Arctic sea ice cap. Melt ponds are shallow pools of water that form as ice melts. Their darker surface can absorb more sunlight and accelerate the melting process. IceBridge is flying out of Barrow, Alaska, during sea ice melt season to capture melt pond observations at a scale never before achieved. Recent studies have found that the formation of melt ponds early in the summer is a good predictor of the yearly minimum sea ice extent in September.

“No one has ever, from a remote sensing standpoint, mapped the large-scale depth of melt ponds on sea ice,” said Nathan Kurtz, IceBridge’s project scientist and a sea ice researcher at NASA Goddard. “The information we’ll collect is going to show how much water is retained in melt ponds and what kind of topography is needed on the sea ice to constrain them, which will help improve melt pond models.”

Operation IceBridge is a NASA airborne mission that has been flying multiple campaigns at both poles each year since 2009, with a goal of maintaining critical continuity of observations of sea ice and the ice sheets of Greenland and Antarctica.

At the same time, NASA researchers began in earnest this year a nearly decade-long, multi-faceted field study of Arctic ecosystems in Alaska and Canada. The Arctic-Boreal Vulnerability Experiment (ABoVE) will study how forests, permafrost and other ecosystems are responding to rising temperatures in the Arctic, where climate change is unfolding faster than anywhere else on the planet.

ABoVE consists of dozens individual experiments that over years will study the region’s changing forests, the cycle of carbon movement between the atmosphere and land, thawing permafrost, the relationship between fire and climate change, and more.

bookmark_borderHumans Set World Pollution Record

by Daniel Brouse

Scientists wrote in the journal Nature Geoscience, “Given currently available records, the present anthropogenic carbon release rate is unprecedented during the past 66 million years.”

The largest known natural surge is believed to have happened 56 million years ago and was likely caused by a release of frozen methane beneath the seabed.

“Our results suggest that future ocean acidification and possible effects on marine calcifying organisms will be more severe than during the PETM (Paleoeocene-Eocene Thermal Maximum),” said lead author Richard Zeebe of the University of Hawaii. “Future ecosystem disruptions are likely to exceed the relatively limited extinctions observed at the PETM.” It is believed in previous warming animals had more time to adapt. In the current warming trend, creatures (such as humans) will unlikely be able to adapt. The warming rate is too fast.

Article from Nature Geoscience:
Anthropogenic carbon release rate unprecedented during the past 66 million years
by Richard E. Zeebe, Andy Ridgwell & James C. Zachos

Abstract
Carbon release rates from anthropogenic sources reached a record high of ~10 Pg C yr−1 in 2014. Geologic analogues from past transient climate changes could provide invaluable constraints on the response of the climate system to such perturbations, but only if the associated carbon release rates can be reliably reconstructed. The Palaeocene–Eocene Thermal Maximum (PETM) is known at present to have the highest carbon release rates of the past 66 million years, but robust estimates of the initial rate and onset duration are hindered by uncertainties in age models. Here we introduce a new method to extract rates of change from a sedimentary record based on the relative timing of climate and carbon cycle changes, without the need for an age model. We apply this method to stable carbon and oxygen isotope records from the New Jersey shelf using time-series analysis and carbon cycle–climate modelling. We calculate that the initial carbon release during the onset of the PETM occurred over at least 4,000 years. This constrains the maximum sustained PETM carbon release rate to less than 1.1 Pg C yr−1. We conclude that, given currently available records, the present anthropogenic carbon release rate is unprecedented during the past 66 million years. We suggest that such a ‘no-analogue’ state represents a fundamental challenge in constraining future climate projections. Also, future ecosystem disruptions are likely to exceed the relatively limited extinctions observed at the PETM.

More Human Induced Climate Change Experiments

bookmark_borderRecord-Setting Rain

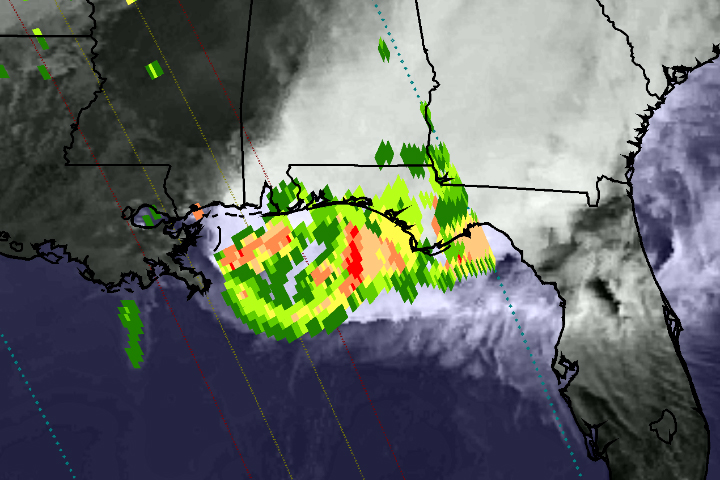
On April 29, 2014, the Global Precipitation Measurement (GPM) satellite observed the heavy rain that produced floods near Pensacola, Florida. The National Weather Service reported record-setting rainfall totals of more than 380 mm (15 inches) in Pensacola from the storm system that inundated the southeastern and eastern United States in recent days.

This image shows GPM Microwave Imager (GMI) rainfall estimates (green to red) superimposed on infrared observations (showing clouds and land) over the southeastern United States. Because the GPM satellite was launched only two months ago, the rainfall-estimation algorithms are currently undergoing a checkout period. For this reason, the scale indicates only qualitative information with green for light rain and red for heavy rain.

This GPM data was collected during a single satellite overpass shortly after noon local time, providing a snapshot of rain rates at that time. The outer blue dotted lines show the width of observations from the GMI instrument, while the two inner lines represent the area measured by the Ka-band (inner lines) and Ku-band (outer lines) of the Dual-Frequency Precipitation Radar. Once the radar data become available, they will provide a three-dimensional view of rain, ice, and snow in the atmosphere.

Extreme Weather
Extreme Weather

bookmark_borderWhat Is Global Warming

by the National Oceanic And Atmospheric Administration

What is Global Warming?

sun.jpg, photo courtesy of NOAA Photo Library
The term Global Warming refers, without any implications for the cause or magnitude, to the observation that the atmosphere near the Earth’s surface is warming. This warming is one of many kinds of climate change that the Earth has gone through in the past and will continue to go through in the future.

Why is Global Warming important?

Temperature increases will have significant impacts on human activities, including: where we can live, what food we can grow, how and where we can grow food, and where organisms we consider pests can thrive. To be prepared for the effects of these potential impacts we need to know how much the Earth is warming, how long the Earth has been warming, and what has caused the warming. Answers to these questions provide us with a better basis for making decisions related to issues such as water resources and agricultural planning.

What is the Greenhouse Effect?

Greenhouse effect image Our planet absorbs radiant energy from the sun and emits some of that energy back to space. The term greenhouse effect describes how water vapor, carbon dioxide, and other “greenhouse” gases in the atmosphere alter the return of energy to space, and in turn, change the temperature at the Earth’s surface. These greenhouse gases absorb some of the energy that is emitted from the Earth’s surface, preventing this energy from being lost to space. As a result, the lower atmosphere warms and sends some of this energy back to the Earth’s surface. When the energy is “recycled” in this way, the Earth’s surface warms.

Life on Earth would be very different without the greenhouse effect. The greenhouse effect keeps the long term annual average temperature of the Earth’s surface approximately 32°C (or about 58°F) higher than it would be otherwise.

How is the Greenhouse Effect related to Global Warming?

Greenhouse gases occur naturally in the Earth’s atmosphere, but are also being added by human activities. This happens primarily through the burning of fossil fuels, such as coal, oil and natural gas, which releases carbon dioxide to the atmosphere. Over the past century, atmospheric carbon dioxide (as measured from ice cores) has increased due to human activities from 300 to 380 parts per million (ppm), and the average Earth temperature has increased approximately 0.7°C (or about 1.3°F).

Co2 image
Given what we know about the ability of greenhouse gases to warm the Earth’s surface, it is reasonable to expect that as concentrations of greenhouse gases in the atmosphere rise above natural levels, the Earth’s surface will become increasingly warm. Many scientists have now concluded that global warming can be explained by a human-caused enhancement of the greenhouse effect.

It is important to remember both that the greenhouse effect occurs naturally, and that it has been intensified by humankind’s input of greenhouse gases into the atmosphere.

Are Ozone Holes related to Global Warming or the Greenhouse Effect?

ozone.gif, photo courtesy of NASA The formation of ozone holes is related to these scientific issues, yet is still distinct.
Ozone plays a very important, natural role in the upper atmosphere (called the stratosphere), where 90% of it exists. Stratospheric ozone acts as a shield against harmful ultraviolet (UV) radiation from the sun. This ozone can be destroyed by human-produced chemical compounds called chlorofluorocarbons, or CFCs. When these CFCs are combined with extremely cold stratospheric temperatures over the poles, solar radiation, and particular patterns of atmospheric circulation, chemical reactions occur that cause “Ozone Holes” over Antarctica (pictured above) and the Arctic.

The formation of ozone holes is related to global warming and the greenhouse effect in two ways. First, CFCs are greenhouse gases. Thus, the release of these compounds into the atmosphere will have two separate effects: to destroy ozone and to add to the greenhouse effect. Second, if stratospheric temperatures or patterns of atmospheric circulation change as part of global warming, this will affect the chemical reactions that destroy ozone and cause the ozone holes to either grow or shrink.

daily ozone image
For daily updated images of the ozone, please visit NOAA’s Stratosphere: SBUV-2 Total Ozone Page with images of the ozone from the NOAA-14 Satellite by clicking here or on image at left.