bookmark_borderHurricane Ian: Florida Becoming Uninhabitable

October 2, 2022

How long would it take to go 100% green?
“It depends on cooperation. If we all cooperated, we could change over within 6 months. However, we don’t expect the climate deniers will cooperate. In the meantime, many countries plan to reduce fossil fuels by 2030. Some countries, such as China, are building nuclear plants. The UK will transition from natural gas to green hydrogen with most of the regulations in place by 2030.”

“The key to how fast the US transitions is in the cost to ourselves (since we don’t seem to care about the rest of the world.) This can already be seen in Florida and Louisiana where almost all of the homeowners/hazard insurance companies have pulled out. FEMA is a good place to focus our forecasts. FEMA’s flood insurance is the only government subsidized insurance available to everybody. When the government stops subsidizing extreme weather events, you will see an instant turnover to 100% green. The intensity and frequency of extreme weather events is growing exponentially; therefore, we expect FEMA will be bankrupted in short order. At that time, much of US real estate will become worthless and the cost of burning fossil fuels will be deemed too costly. The people impacted by financial and life losses will litigate the fossil fuel industry out-of-business,” said climate scientist Daniel Brouse.

The Costs of Climate Change
Hurricane Ian will be one of the most costly disasters on record, both in terms of money and lives. Over 2 million people lost power. Roads and bridges were destroyed. Some inhabited islands literally got washed away. The hurricane was so powerful that it is difficult to calculate the number of deaths as the bodies can not be found.

The Insurance Journal reports:
Wind and storm-surge losses from Hurricane Ian could reach as $47 billion in Florida alone, a figure made larger by inflation and rising interest rates, the property analytics firm CoreLogic said in a new analysis.

“This is the costliest Florida storm since Hurricane Andrew made landfall in 1992 and a record number of homes and properties were lost due to Hurricane Ian’s intense and destructive characteristics,” said Tom Larsen, associate vice president for hazard and risk management at CoreLogic.

“Hurricane Ian will forever change the real estate industry and city infrastructure,” Larsen said in a news release. “Insurers will go into bankruptcy, homeowners will be forced into delinquency and insurance will become less accessible in regions like Florida.”

More articles on Flood Insurance, Rising Sea Levels and Global Warming.

bookmark_borderClimate Change: Code Red for Humanity

The UN’s IPCC (Intergovernmental Panel on Climate Control) release their latest report that has been compiled and peer-reviewed over the last 8 years.

U.N. Secretary-General, António Guterres described the report as “a code red for humanity.”

“The alarm bells are deafening, and the evidence is irrefutable: greenhouse gas emissions from fossil fuel burning and deforestation are choking our planet and putting billions of people at immediate risk,” said Mr. Guterres.

Some of the changes already set in motion will be “irreversible” for centuries to come.

A press release from the IPCC states:

The report provides new estimates of the chances of crossing the global warming level of 1.5°C in the next decades, and finds that unless there are immediate, rapid and large-scale reductions in greenhouse gas emissions, limiting warming to close to 1.5°C or even 2°C will be beyond reach.

The report shows that emissions of greenhouse gases from human activities are responsible for approximately 1.1°C of warming since 1850-1900, and finds that averaged over the next 20 years, global temperature is expected to reach or exceed 1.5°C of warming. This assessment is based on improved observational datasets to assess historical warming, as well progress in scientific understanding of the response of the climate system to human-caused greenhouse gas emissions.

“This report is a reality check,” said IPCC Working Group I Co-Chair Valérie Masson-Delmotte. “We now have a much clearer picture of the past, present and future climate, which is essential for understanding where we are headed, what can be done, and how we can prepare.”

Every region facing increasing changes

Many characteristics of climate change directly depend on the level of global warming, but what people experience is often very different to the global average. For example, warming over land is larger than the global average, and it is more than twice as high in the Arctic.

“Climate change is already affecting every region on Earth, in multiple ways. The changes we experience will increase with additional warming,” said IPCC Working Group I Co-Chair Panmao Zhai.

The report projects that in the coming decades climate changes will increase in all regions. For 1.5°C of global warming, there will be increasing heat waves, longer warm seasons and shorter cold seasons. At 2°C of global warming, heat extremes would more often reach critical tolerance thresholds for agriculture and health, the report shows.

But it is not just about temperature. Climate change is bringing multiple different changes in different regions – which will all increase with further warming. These include changes to wetness and dryness, to winds, snow and ice, coastal areas and oceans. For example:

* Climate change is intensifying the water cycle. This brings more intense rainfall and associated flooding, as well as more intense drought in many regions.
* Climate change is affecting rainfall patterns. In high latitudes, precipitation is likely to increase, while it is projected to decrease over large parts of the subtropics. Changes to monsoon precipitation are expected, which will vary by region.
* Coastal areas will see continued sea level rise throughout the 21st century, contributing to more frequent and severe coastal flooding in low-lying areas and coastal erosion. Extreme sea level events that previously occurred once in 100 years could happen every year by the end of this century.
* Further warming will amplify permafrost thawing, and the loss of seasonal snow cover, melting of glaciers and ice sheets, and loss of summer Arctic sea ice.
* Changes to the ocean, including warming, more frequent marine heatwaves, ocean acidification, and reduced oxygen levels have been clearly linked to human influence. These changes affect both ocean ecosystems and the people that rely on them, and they will continue throughout at least the rest of this century.
* For cities, some aspects of climate change may be amplified, including heat (since urban areas are usually warmer than their surroundings), flooding from heavy precipitation events and sea level rise in coastal cities.

For the first time, the Sixth Assessment Report provides a more detailed regional assessment of climate change, including a focus on useful information that can inform risk assessment, adaptation, and other decision-making, and a new framework that helps translate physical changes in the climate – heat, cold, rain, drought, snow, wind, coastal flooding and more – into what they mean for society and ecosystems.

This regional information can be explored in detail in the newly developed Interactive Atlas interactive-atlas.ipcc.ch as well as regional fact sheets, the technical summary, and underlying report.

Human influence on the past and future climate

“It has been clear for decades that the Earth’s climate is changing, and the role of human influence on the climate system is undisputed,” said Masson-Delmotte. Yet the new report also reflects major advances in the science of attribution – understanding the role of climate change in intensifying specific weather and climate events such as extreme heat waves and heavy rainfall events.

The report also shows that human actions still have the potential to determine the future course of climate. The evidence is clear that carbon dioxide (CO2) is the main driver of climate change, even as other greenhouse gases and air pollutants also affect the climate.

“Stabilizing the climate will require strong, rapid, and sustained reductions in greenhouse gas emissions, and reaching net zero CO2 emissions. Limiting other greenhouse gases and air pollutants, especially methane, could have benefits both for health and the climate,” said Zhai.
More on The Human Induced Climate Change Experiment

bookmark_borderStrongest Hurricane On Record

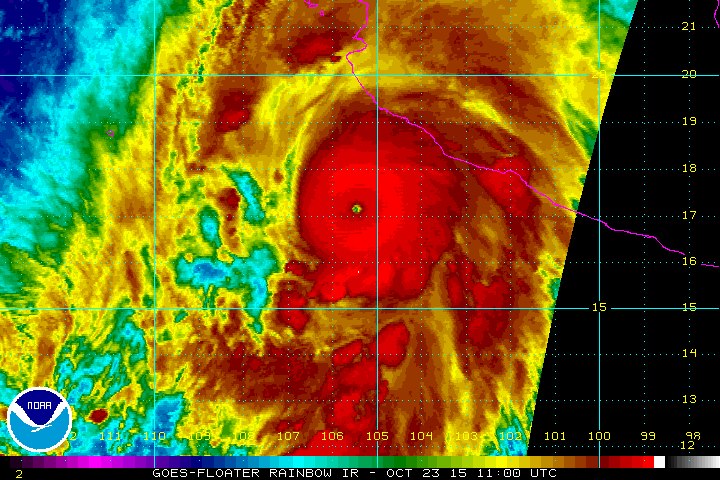
NOAA — Hurricane Patricia is the strongest hurricane on record in the National Hurricane Center’s area of responsibility (AOR) which includes the Atlantic and the eastern North Pacific basins. The minimum central pressure estimated from the aircraft data, 880 mb, is the lowest ever for our AOR. Maximum sustained winds remain near 200 mph (325 km/h) with higher gusts. Patricia is a category 5 hurricane on the Saffir-Simpson Hurricane Wind Scale. Some fluctuations in intensity are possible today, but Patricia is expected to remain an extremely dangerous category 5 hurricane through landfall.

A Hurricane Warning continues from San Blas to Punta San Telmo, and a Hurricane Watch and Tropical Storm Warning from east of Punta San Telmo to Lazaro Cardenas. Preparations to protect life and property should now be completed now.

Patricia is centered as of 7 a.m. CDT about 145 miles (235 km) southwest of Manzanillo, moving toward the north-northwest near 12 mph (19 km/h). A turn toward the north is expected later this morning, followed by a turn toward the north-northeast this afternoon. On the forecast track, the core of Patricia will make landfall in the hurricane warning area this afternoon or evening.

Preparations to protect life and property should be rushed to
completion. Tropical storm conditions are now beginning to spread across portions of the warning area. Hurricane conditions are expected to first reach the hurricane warning area this afternoon.

Strongest Hurricane On Record

bookmark_borderWhat Is Global Warming

by the National Oceanic And Atmospheric Administration

What is Global Warming?

sun.jpg, photo courtesy of NOAA Photo Library
The term Global Warming refers, without any implications for the cause or magnitude, to the observation that the atmosphere near the Earth’s surface is warming. This warming is one of many kinds of climate change that the Earth has gone through in the past and will continue to go through in the future.

Why is Global Warming important?

Temperature increases will have significant impacts on human activities, including: where we can live, what food we can grow, how and where we can grow food, and where organisms we consider pests can thrive. To be prepared for the effects of these potential impacts we need to know how much the Earth is warming, how long the Earth has been warming, and what has caused the warming. Answers to these questions provide us with a better basis for making decisions related to issues such as water resources and agricultural planning.

What is the Greenhouse Effect?

Greenhouse effect image Our planet absorbs radiant energy from the sun and emits some of that energy back to space. The term greenhouse effect describes how water vapor, carbon dioxide, and other “greenhouse” gases in the atmosphere alter the return of energy to space, and in turn, change the temperature at the Earth’s surface. These greenhouse gases absorb some of the energy that is emitted from the Earth’s surface, preventing this energy from being lost to space. As a result, the lower atmosphere warms and sends some of this energy back to the Earth’s surface. When the energy is “recycled” in this way, the Earth’s surface warms.

Life on Earth would be very different without the greenhouse effect. The greenhouse effect keeps the long term annual average temperature of the Earth’s surface approximately 32°C (or about 58°F) higher than it would be otherwise.

How is the Greenhouse Effect related to Global Warming?

Greenhouse gases occur naturally in the Earth’s atmosphere, but are also being added by human activities. This happens primarily through the burning of fossil fuels, such as coal, oil and natural gas, which releases carbon dioxide to the atmosphere. Over the past century, atmospheric carbon dioxide (as measured from ice cores) has increased due to human activities from 300 to 380 parts per million (ppm), and the average Earth temperature has increased approximately 0.7°C (or about 1.3°F).

Co2 image
Given what we know about the ability of greenhouse gases to warm the Earth’s surface, it is reasonable to expect that as concentrations of greenhouse gases in the atmosphere rise above natural levels, the Earth’s surface will become increasingly warm. Many scientists have now concluded that global warming can be explained by a human-caused enhancement of the greenhouse effect.

It is important to remember both that the greenhouse effect occurs naturally, and that it has been intensified by humankind’s input of greenhouse gases into the atmosphere.

Are Ozone Holes related to Global Warming or the Greenhouse Effect?

ozone.gif, photo courtesy of NASA The formation of ozone holes is related to these scientific issues, yet is still distinct.
Ozone plays a very important, natural role in the upper atmosphere (called the stratosphere), where 90% of it exists. Stratospheric ozone acts as a shield against harmful ultraviolet (UV) radiation from the sun. This ozone can be destroyed by human-produced chemical compounds called chlorofluorocarbons, or CFCs. When these CFCs are combined with extremely cold stratospheric temperatures over the poles, solar radiation, and particular patterns of atmospheric circulation, chemical reactions occur that cause “Ozone Holes” over Antarctica (pictured above) and the Arctic.

The formation of ozone holes is related to global warming and the greenhouse effect in two ways. First, CFCs are greenhouse gases. Thus, the release of these compounds into the atmosphere will have two separate effects: to destroy ozone and to add to the greenhouse effect. Second, if stratospheric temperatures or patterns of atmospheric circulation change as part of global warming, this will affect the chemical reactions that destroy ozone and cause the ozone holes to either grow or shrink.

daily ozone image
For daily updated images of the ozone, please visit NOAA’s Stratosphere: SBUV-2 Total Ozone Page with images of the ozone from the NOAA-14 Satellite by clicking here or on image at left.

bookmark_borderIsaac

Isaac The Storm
Isaac The Storm


tab Eastern Pacific tab tab Atlantic tab
tab
Click for Eastern Pacific
TC Activity
Graphical Tropical Weather Outlook   |   Active Storms   |   Marine Forecasts


Atlantic – Caribbean Sea – Gulf of Mexico
Tropical Weather Outlook (en Español*)
800 AM EDT MON AUG 27 2012
Tropical Weather Discussion
805 AM EDT MON AUG 27 2012
Tropical Storm ISAAC RSS Feed icon NESDIS Satellite | NDBC Obs | Storm Archive
…ISAAC GETTING A LITTLE BETTER ORGANIZED AS IT MOVES WEST-NORTHWESTWARD OVER THE EASTERN GULF OF MEXICO… …U.S. Warnings in Effect…


8:00 AM EDT Mon Aug 27
Location: 25.7°N 84.7°W
Moving: WNW at 14 mph
Min pressure: 988 mb
Max sustained: 65 mph
Public
Advisory
#25A

800 AM EDT
Aviso
Publico
#25A

800 AM EDT
Forecast
Advisory
#25

0900 UTC
Forecast
Discussion
#25

500 AM EDT
Wind Speed
Probabilities
#25

0900 UTC
NWS Local
Statements
US Watch/
Warning

800 AM EDT
Hurricane Wind Speed Probability
Hurricane Wind
Speed Probability
50-knot Wind Speed Probability
50-knot Wind
Speed Probability
34-knot Wind Speed Probability
Trop Storm Wind
Speed Probability
Max Wind Speed Probability Table
Maximum Wind
Speed Probability
Google Maps API Warnings and Track Forecast Cone
Warnings/Cone
Interactive Map
Warnings and 5-Day Cone
Warnings/Cone
Static Images
Surface Wind Field
Warnings and
Surface Wind
Mariner's 1-2-3 Rule
Mariner’s
1-2-3 Rule
Wind History
Wind
History

*Spanish translations courtesy of the NWS San Juan Weather Forecast Office


Eastern Pacific (out to 140°W)
Tropical Weather Outlook
500 AM PDT MON AUG 27 2012
Tropical Weather Discussion
1005 UTC MON AUG 27 2012
There are no tropical cyclones at this time.


Hurricane Preparedness Sign Image of Hurricane Preparedness
Learn about hurricane hazards and what you can do to help protect yourself, your family, and your
property.

Tropical Cyclone Centers Worldwide

Lat/Lon Distance Calculator
Find distance between latitude/longitude points

Hurricane Season Dates

Hurricane season in the Atlantic begins June 1st and ends November 30th. The Eastern Pacific hurricane season begins May 15th and also ends November 30th.

Hurricane Season Summaries and Reports

Atlantic: Monthly Tropical Cyclone Summary | Tropical Cyclone Reports
East Pacific: Monthly Tropical Cyclone Summary | Tropical Cyclone Reports

bookmark_borderHurricane Daniel

In early July 2012, two simultaneous hurricanes blew over the eastern Pacific Ocean: Hurricane Emilia and Hurricane Daniel. The first of the two storms to form, Daniel started as a tropical depression on July 4. The storm had strengthened to a Category 2 hurricane by 12:20 p.m. Pacific Daylight Time on July 8, when the Moderate Resolution Imaging Spectroradiometer (MODIS) on NASA’s Terra satellite captured this natural-color image. By that time, Daniel sported a distinct eye characteristic of hurricanes, and its spiral arms spanned hundreds of kilometers over the open ocean.

At 2:00 p.m. PDT on July 8, not long after MODIS acquired this image, the U.S. National Hurricane Center (NHC) reported that Daniel was located roughly 1,120 miles (1,800 kilometers) west-southwest of the southern tip of Baja, California. The storm had maximum sustained winds of 105 miles (165 kilometers) per hour.

By the following day, Daniel had weakened, though it remained a hurricane. At 8:00 a.m. PDT on July 9, Daniel had moved farther away from Baja California, and the storm’s wind speeds had dropped to 85 miles (140 kilometers) per hour. No hazards affected land as of July 9, the NHC reported, and Daniel was expected to weaken further as it continued moving westward.

Though the storm posed no threat to Mexico, it had the potential to bring unsettled weather to Hawaii. Daniel’s remnants were expected to pass south of the island chain around July 13, 2012, AccuWeather reported. Remnants of the storm might cause gusty winds, heavy rains, and even localized flash flooding.

  1. References

  2. National Hurricane Center. (2012, July 9) Hurricane Advisory Archive. Accessed July 9, 2012.
  3. Edwards, B. (2012, July 9) Hurricane Daniel could impact Hawaii by late week. AccuWeather. Accessed July 9, 2012.

NASA image courtesy Jeff Schmaltz, LANCE MODIS Rapid Response Team, Goddard Space Flight Center. Caption by Michon Scott.

Instrument: 
Terra – MODIS
Hurricane Daniel
Hurricane Daniel


bookmark_borderHurricane Irene

Hurricane Irene
Hurricane Irene

Tropical Storm Conditions Spreading Northward Along Delmarva Coast

Published: Sat, 27 Aug 2011 10:58:54 EDT
At 11:00 a.m. EDT, the center of Hurricane Irene was located near latitude 35.2 north, longitude 76.4 west, or about 100 miles southwest of Cape Hatteras, N.C. Irene is moving toward the north-northeast near 15 mph and this general motion is expected to continue for the next 24 hours. The center of Irene is forecast to move across northeastern North Carolina this afternoon before moving near or over the Mid-Atlantic coast tonight and over southern New England on Sunday. Maximum sustained winds remain near 85 mph, with higher gusts. Irene is a Category One hurricane. Slight weakening is forecast as Irene crosses eastern North Carolina, but Irene is forecast to remain near hurricane strength as it moves near or over the Mid-Atlantic states and approaches New England. For storm information specific to your area in the U.S., please monitor products issued by your local NWS forecast office.

from noaa.gov