bookmark_borderThe United States and the 1.5°C Climate Tipping Point Crisis

by Daniel Brouse and Sidd Mukherjee

Overview

The United States bears an oversized responsibility for the climate crisis through its enormous historical contribution to greenhouse gas emissions. Yet U.S. climate policy is moving backward while Earth’s interconnected climate systems are destabilizing.

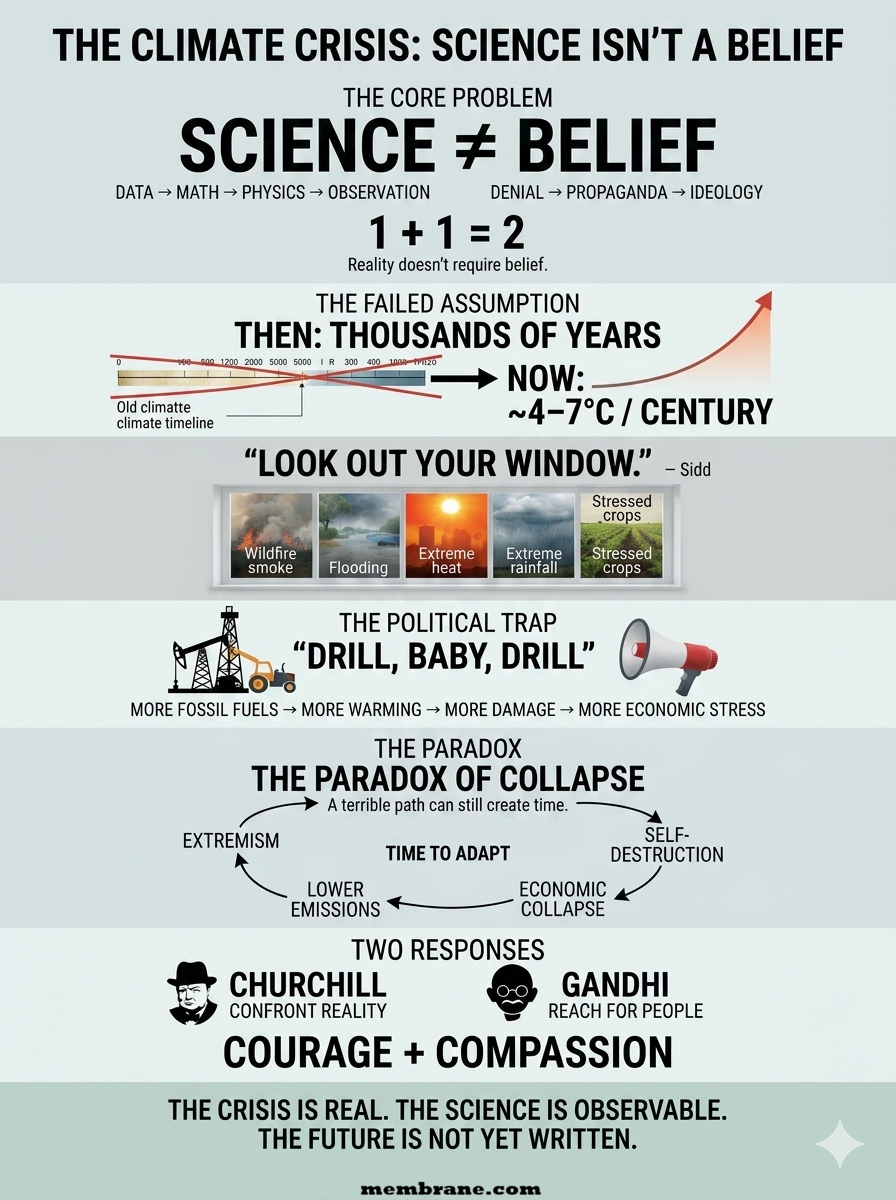
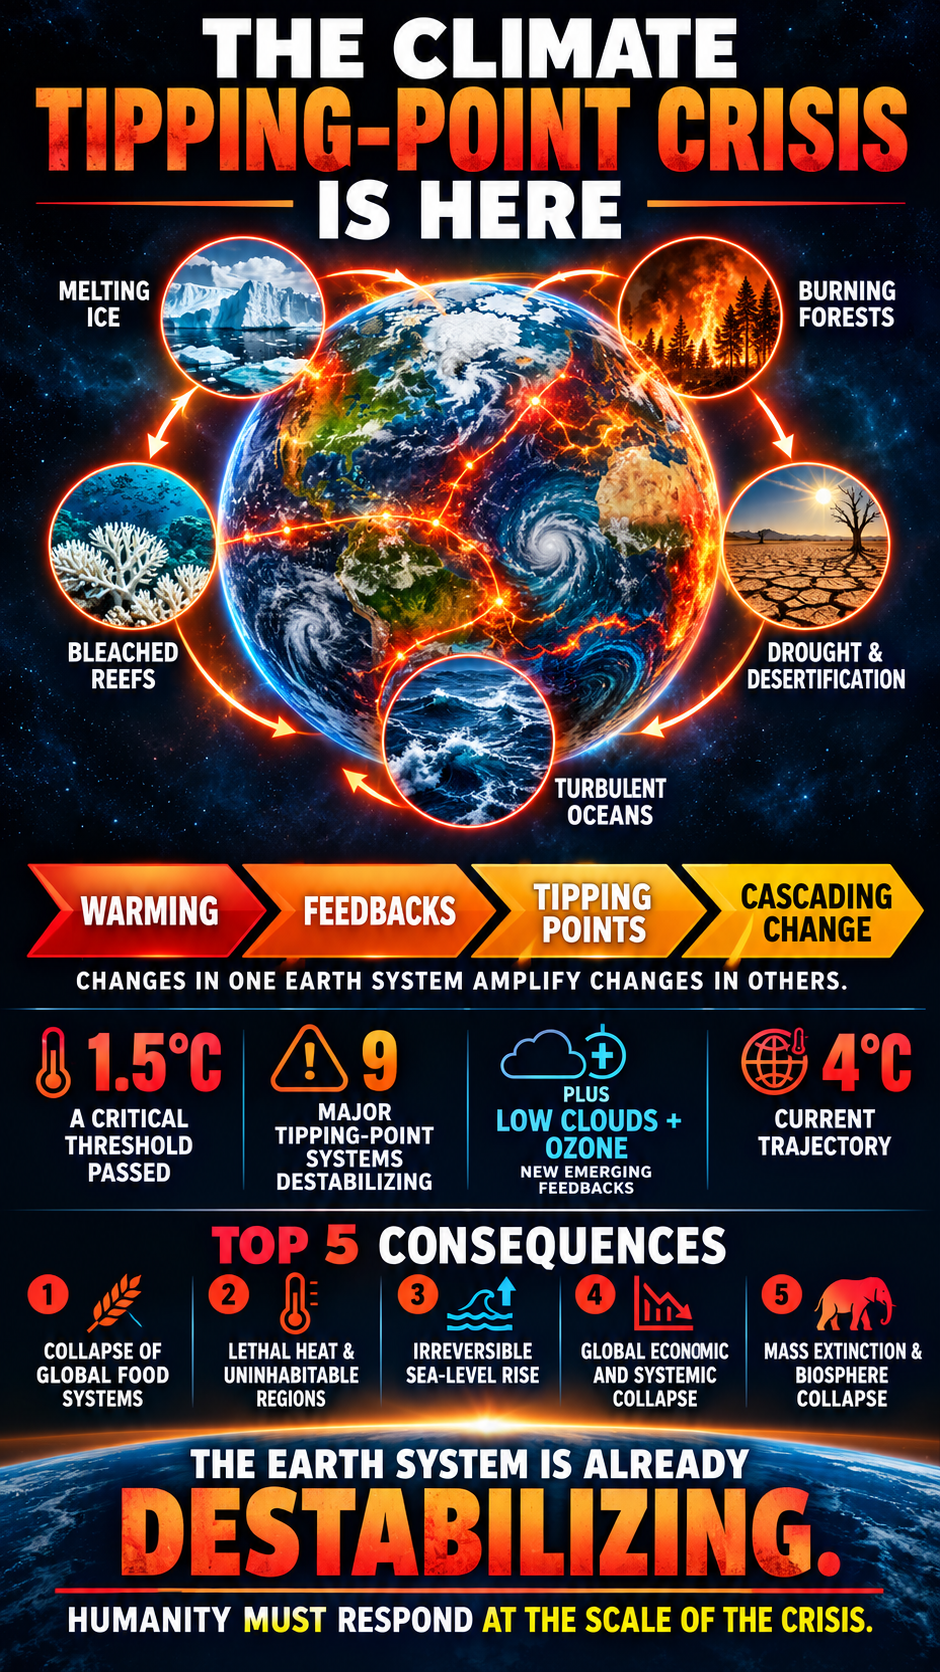
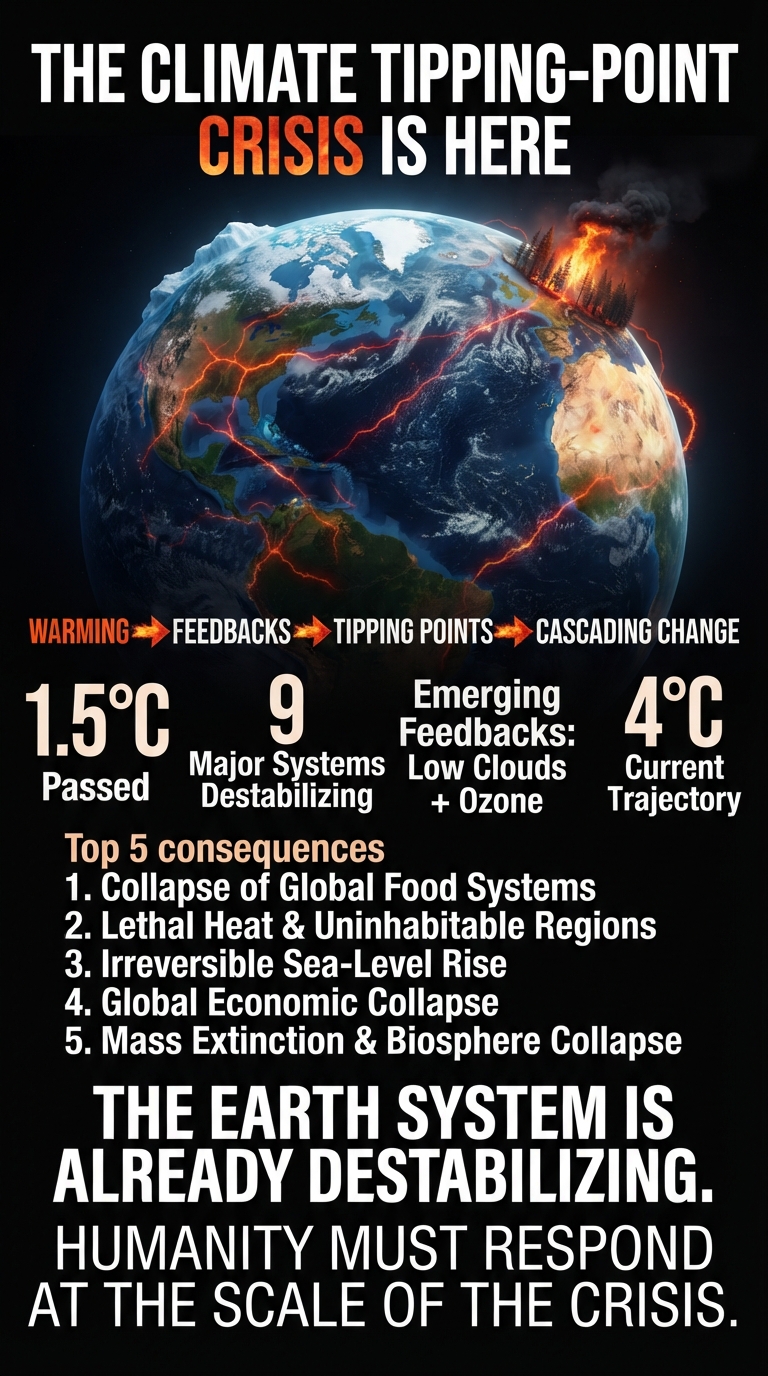
THE CLIMATE TIPPING-POINT CRISIS IS HERE.

Warming is no longer just a matter of rising temperatures. It is activating feedbacks that amplify changes across interconnected Earth systems, accelerating a climate domino effect.

WARMING → FEEDBACKS → TIPPING POINTS → CASCADING CHANGE

When one system destabilizes, it changes the conditions affecting others. Melting ice reduces Earth’s reflectivity. Thawing permafrost releases greenhouse gases. Forest degradation weakens natural carbon sinks. Declining low-level clouds and tropospheric ozone add further warming pressure.

THE KEY FACTS

  • 1.5°C — A critical climate threshold already crossed in individual years.
  • 9 major climate tipping-point systems — Already exhibiting destabilization.
  • LOW CLOUDS + OZONE — Emerging feedbacks intensifying the climate challenge.
  • 4°C — The severe warming trajectory examined in this analysis for this century.

THE TOP FIVE CONSEQUENCES

  1. Collapse of Global Food Systems
  2. Lethal Heat and Uninhabitable Regions
  3. Irreversible Sea-Level Rise
  4. Global Economic and Systemic Collapse
  5. Mass Extinction and Biosphere Collapse

These are interconnected threats. Food insecurity, extreme heat, coastal inundation, economic disruption, and ecological collapse reinforce one another, placing human civilization and natural ecosystems under mounting pressure.

THE EARTH SYSTEM IS ALREADY DESTABILIZING.

The climate crisis is not simply a future problem. Observed changes are already underway, and interconnected feedbacks threaten to amplify their consequences. Political delay and continued emissions deepen the challenge.

HUMANITY MUST RESPOND AT THE SCALE OF THE CRISIS.

Read the full paper for the scientific framework, emerging feedbacks, climate tipping points, and consequences of a high-warming trajectory.

#ClimateChange #ClimateTippingPoints #GlobalWarming #ClimateScience #ClimateAction

Crossing 1.5°C: The Tipping Points Are Already Activating

The significance of crossing the 1.5°C global warming threshold extends far beyond a numerical temperature target. This threshold marks a critical boundary for the activation of major climate tipping points. At least nine major tipping-point systems are already exhibiting destabilization, with activation beginning below 1.5°C of global warming.

Other major tipping points associated with warming between 1.5°C and 2°C are also experiencing periods of activation. These observations demonstrate that the climate system is already undergoing fundamental changes as interconnected feedback processes intensify.

According to the UN Environment Programme (UNEP) and the Copernicus Climate Change Service, the long-term global average surface temperature has risen approximately 1.4°C above pre-industrial levels (1850–1900). Understanding this figure requires distinguishing sustained warming from individual annual temperature records.

1. Long-Term Warming: Approximately 1.4°C

To assess the Paris Agreement’s 1.5°C threshold, scientists examine long-term temperature averages rather than treating a single unusually warm year as proof of a sustained breach. A 20-year average smooths temporary fluctuations associated with natural climate variability, including El Niño.

By this long-term measure, global warming stands at approximately 1.4°C. The world is approaching the threshold associated with increasingly widespread and consequential climate tipping-point activation.

2. Annual Temperature Records: 1.55°C

Individual calendar years have already exceeded 1.5°C of warming.

In 2024, the global average surface temperature reached approximately 1.55°C above the pre-industrial baseline, making it the hottest year in the instrumental record. Human-caused greenhouse gas emissions, combined with natural climate variability, contributed to this record.

The 1.5°C threshold is therefore no longer merely a distant benchmark. Annual global temperatures have already crossed it, while long-term warming continues to approach the same boundary.

Once tipping points activate, self-reinforcing feedback processes intensify changes within the climate system. These processes connect warming to additional warming, accelerating the redistribution of energy throughout the atmosphere, oceans, cryosphere, and biosphere.

Nine Major Climate Tipping-Point Systems Undergoing Destabilization

A landmark synthesis published in Nature by leading international scientists identifies nine major climate tipping-point systems exhibiting destabilization. These systems have moved beyond abstract future concerns: measurable changes are occurring across interconnected components of the Earth system.

The Cryosphere: Ice Masses and Frozen Ground

Greenland Ice Sheet: Accelerating surface melting threatens the long-term stability of the ice sheet. Crossing its tipping threshold commits the planet to eventual, irreversible sea-level rise of approximately seven meters.

West Antarctic Ice Sheet: Marine ice-sheet instability is intensifying as warming ocean waters melt glaciers from below, undermining the structural stability of the ice sheet.

Parts of East Antarctica: Major subglacial basins are showing signs of accelerated ice loss, challenging earlier assumptions about the stability of these regions.

Arctic Sea Ice: Arctic sea ice is rapidly declining in extent and thickness. This loss reduces Earth’s albedo, or reflectivity, allowing the ocean to absorb more incoming solar energy and amplifying regional and global warming.

Permafrost: Abrupt thaw is occurring across northern latitudes. Decomposition of previously frozen organic material releases carbon dioxide and methane, adding greenhouse gases to the atmosphere and strengthening warming feedbacks.

Ocean and Atmospheric Circulation

Atlantic Meridional Overturning Circulation (AMOC): This major system of Atlantic Ocean currents, which includes the Gulf Stream, is experiencing substantial disruption. Freshwater entering the North Atlantic from melting Arctic and Greenland ice alters ocean density and threatens the circulation system’s stability.

Changes in ocean circulation affect heat transport, regional climate patterns, marine ecosystems, and the distribution of energy throughout the climate system.

The Biosphere: Forests and Marine Ecosystems

Amazon Rainforest: Deforestation and rising temperatures are intensifying drought stress across the Amazon. Increasingly dry conditions, forest degradation, and fire interact to push parts of the rainforest toward a degraded, fire-prone savannah state.

Boreal Forests: Extensive tree mortality and increasingly destructive wildfire cycles are disrupting forest regeneration across northern latitudes. These changes threaten the long-term stability of major forest ecosystems and their role in carbon storage.

Warm-Water Coral Reefs: Marine heatwaves have repeatedly exceeded critical thermal thresholds, producing widespread and severe coral bleaching. Repeated bleaching and ecological degradation threaten reef survival and accelerate transitions toward algae-dominated ecosystems.

These tipping-point systems do not operate independently. Destabilization in one part of the Earth system changes conditions in others, creating interconnected feedbacks and increasing the risk of cascading failures. The resulting domino effect makes the combined behavior of the climate system more consequential than any single tipping point considered in isolation.

The United States: A Major Setback in Global Climate Action

The United States’ climate policy direction represents a major setback in the international response to global warming.

According to the 2026 UN Environment Programme Emissions Gap Report: The Point of Return, the United States was identified as the only major economy experiencing a dramatic annual increase in greenhouse gas emissions. The reported increase of 133 million metric tons of carbon dioxide equivalent represents a substantial reversal in U.S. emissions performance.

The reported surge reflects the interaction of energy demand, fossil-fuel dependence, and federal policy changes. While other G20 economies reduced or stabilized their emissions, the United States moved in the opposite direction.

Policy Reversal: Withdrawal from the Paris Agreement

Following his second inauguration in January 2025, President Donald Trump signed an executive order initiating a second U.S. withdrawal from the 2015 Paris Climate Agreement. The withdrawal became official on January 27, 2026.

The administration defended the decision as a means of protecting American energy independence and resisting international regulations it characterized as unfair to domestic workers.

At the same time, federal policy reversed or weakened multiple climate measures. These changes targeted vehicle fuel-efficiency standards, halted tax credits supporting wind and solar development, and imposed requirements intended to keep aging fossil-fuel power plants operating.

Together, these policies weakened federal support for emissions reductions and reinforced the role of conventional fossil fuels in the U.S. energy system.

Coal, Electricity Demand, and Artificial Intelligence

The reported 133-million-metric-ton emissions increase coincided with rising electricity demand and renewed reliance on carbon-intensive power generation.

Coal resurgence: Increased coal-fired generation helped meet electricity demand while older power plants remained operational. Extending the operation of these plants reversed a longstanding downward trend in U.S. power-sector emissions.

Artificial intelligence and data centers: Rapid expansion of AI infrastructure created substantial new electricity demand. Data-center growth increased pressure on existing power grids, while the deployment of new energy infrastructure struggled to keep pace. Utilities consequently relied heavily on existing coal and natural-gas generation.

The interaction of rising electricity demand, fossil-fuel generation, and policy changes demonstrates how technological expansion without corresponding clean-energy deployment increases emissions.

Global Consequences

The UNEP report projects that current global climate policies and emissions trajectories will produce warming of approximately 2.6°C to 2.8°C by the end of the century. This trajectory represents a substantial overshoot of the Paris Agreement’s 1.5°C objective.

The United States’ retreat from climate commitments deepens the international leadership gap. The European Union, China, India, Brazil, and South Africa are among the major actors pursuing international climate cooperation outside the framework of U.S. participation.

The central problem is not simply that one country has changed its policies. It is that the world’s largest historical contributor to greenhouse gas emissions is weakening its climate response while the Earth system is already showing signs of destabilization.

The Deeper Problem: Climate Change Is Accelerating Beyond Historical Human Experience

The difficulty of predicting future climate conditions lies in the unprecedented speed and complexity of the changes now underway.

Humanity has never experienced human-driven climate change at the present rate of acceleration. As one scientific assessment explains, the current speed of human-induced carbon dioxide change and warming is nearly without precedent in the geological record, with the instantaneous meteorite impact associated with the extinction of non-avian dinosaurs 66 million years ago representing the principal known exception.

Past climate records provide essential evidence about Earth’s sensitivity and behavior. However, those records do not provide a direct historical precedent for a technologically advanced civilization deliberately transforming the atmosphere at the current rate while simultaneously confronting interconnected climate tipping points.

Humanity understands the mechanisms behind many individual climate feedbacks. The unprecedented challenge is determining how these mechanisms interact when multiple thresholds are crossed and destabilization spreads across interconnected systems.

A reasonable expectation is that a society confronting its greatest existential environmental threat would respond decisively. The U.S. policy reversal demonstrates that political and economic behavior does not necessarily follow that expectation, even as climate risks intensify.

From Individual Tipping Points to Cascading Feedbacks

The activation of nine major tipping-point systems raises a fundamental issue: the climate system is interconnected, and its response to multiple simultaneous disturbances is not equivalent to the sum of isolated changes.

As ice melts, albedo declines. As oceans absorb additional energy, marine heatwaves intensify. As forests deteriorate, carbon storage and ecosystem resilience decline. As permafrost thaws, greenhouse gases enter the atmosphere. These processes interact, reinforcing the original warming and altering the conditions under which other feedbacks operate.

This is the climate domino effect: warming activates feedbacks, feedbacks amplify warming, and interconnected systems move toward additional thresholds. The resulting cascade changes the trajectory of the entire Earth system.

The problem is compounded by emerging feedback mechanisms whose combined influence is not adequately represented in conventional climate projections.

Two Emerging Feedbacks: Low-Level Clouds and Tropospheric Ozone

Declining low-level clouds represent a major emerging climate feedback. Low clouds reflect incoming solar radiation back into space. A sustained decline in their coverage reduces this cooling influence and increases the energy retained by the Earth system.

Tropospheric ozone is another major climate-forcing agent. In addition to contributing to atmospheric warming, ozone damages vegetation, reduces photosynthetic performance, and impairs the ability of forests and other ecosystems to absorb carbon dioxide. These ecological effects weaken natural carbon sinks while adding to the climate system’s existing greenhouse forcing.

The significance of these feedbacks extends beyond their individual contributions. Their interaction with established feedbacks changes the overall balance of energy entering, leaving, and being redistributed throughout the climate system.

Previous probabilistic projections placed end-of-century warming on a trajectory approaching 2.8°C. Accounting for the combined influence of declining low-level clouds and tropospheric ozone supports a substantially more severe assessment, with warming of approximately 4°C this century representing the trajectory advanced in this analysis.

A 4°C outcome is not simply a more intense version of today’s climate. It represents a fundamental transformation of the conditions supporting human civilization and natural ecosystems.

The Consequences of a 4°C World

Warming of 4°C above pre-industrial levels would impose extraordinary stresses on food production, human habitability, coastlines, global economic systems, and biodiversity. The following risks describe the consequences associated with such a high-warming trajectory.

1. Collapse of Global Food Systems

Extreme heat, prolonged drought, and shifting precipitation patterns threaten agricultural productivity across the world’s major food-producing regions.

  • Simultaneous crop failures: Concurrent failures of wheat, maize, rice, and soybean harvests across multiple continents threaten global food supplies and destabilize international markets.
  • Tropical agricultural losses: Agricultural productivity in tropical and subtropical regions faces declines of up to 50%, undermining food security across major agricultural zones.
  • Marine food-system disruption: Marine heatwaves and ocean acidification damage fisheries and marine ecosystems, threatening a major source of protein for billions of people.

The convergence of agricultural losses and declining marine productivity places global food security under severe systemic pressure.

2. Lethal Heat and Uninhabitable Regions

Extreme heat and humidity threaten human survival across increasingly large areas of the planet.

  • Wet-bulb temperature extremes: Parts of the Middle East, South Asia, Central Africa, and the Amazon face dangerous combinations of heat and humidity. A sustained wet-bulb temperature of 35°C approaches the theoretical upper limit of human heat tolerance under the conditions used to define that threshold.
  • Mass displacement: A large share of the global population faces living conditions outside the historical human climate envelope, driving displacement on a scale involving hundreds of millions of people.

The consequences extend beyond direct heat mortality. Extreme temperatures undermine outdoor labor, public health, infrastructure, water availability, and the viability of entire communities.

3. Irreversible Sea-Level Rise and Coastal Inundation

A 4°C warming trajectory places the major ice sheets under extreme long-term stress and commits the planet to substantial, persistent sea-level rise.

  • Long-term inundation: Sea-level rise of approximately one to two meters by 2100 represents a severe coastal risk under high-warming scenarios. Continued ice-sheet loss commits the planet to much greater sea-level rise over subsequent centuries, with estimates of 10 to 20 meters associated with the most severe long-term outcomes.
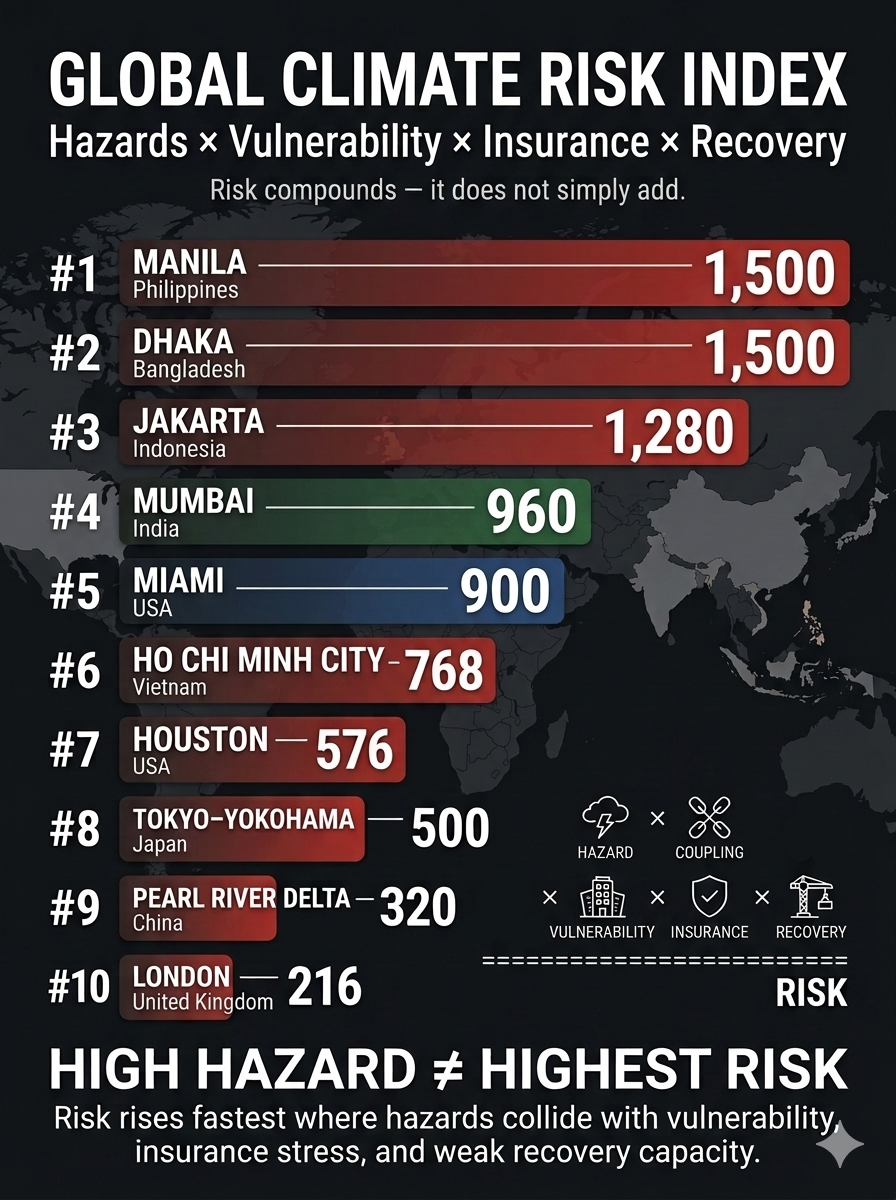
  • Threats to major cities: Tokyo, New York, Shanghai, Mumbai, and Lagos, together with low-lying island nations, face escalating coastal inundation, infrastructure destruction, and displacement as sea levels rise.

The long response time of major ice sheets means that the consequences of sustained warming extend far beyond the end of this century.

4. Global Economic and Systemic Collapse

Climate disasters occurring simultaneously across regions place interconnected financial, economic, and political systems under extraordinary strain.

  • Severe economic contraction: High-warming assessments include scenarios involving global economic losses on the order of 30% to 50% by 2100. Losses of this magnitude would exceed the economic disruption associated with the Great Depression.
  • Resource conflicts: Competition over freshwater, fertile land, and other essential resources intensifies as drought expands and mountain glaciers diminish. These pressures increase the risks of geopolitical conflict, displacement, and state failure.

Insurance markets, public infrastructure, food distribution, financial systems, and government budgets face overlapping losses. The scale and interdependence of these impacts threaten the stability of the global economy.

5. Mass Extinction and Biosphere Collapse

Rapid climate disruption forces ecosystems to change faster than many species can adapt or migrate. Habitat loss, extreme heat, drought, wildfire, and ocean warming compound existing pressures on biodiversity.

  • Accelerating extinction risk: Under severe warming, a substantial share of plant and animal species faces extinction risk as habitats disappear or undergo fundamental transformation.
  • Amazon forest dieback: Continued warming, drought, deforestation, and fire intensify the risk of large-scale Amazon forest degradation and transition toward savannah-like ecosystems. The release of stored carbon would reinforce atmospheric warming and further destabilize the climate system.

Biosphere collapse is not an isolated ecological concern. Forests, soils, wetlands, and marine ecosystems regulate carbon storage, water cycles, regional climates, and food webs. Their deterioration weakens the natural systems on which human societies depend.

Conclusion: The Climate Tipping-Point Crisis Is Already Underway

The 1.5°C threshold represents a critical boundary in a climate system already undergoing measurable destabilization. Major ice sheets, Arctic sea ice, permafrost, ocean circulation, forests, and coral reefs are experiencing changes that interact through reinforcing feedbacks.

The danger lies in the coupling of these processes. Individual changes alter the conditions governing other components of the Earth system, creating a cascading response that conventional assessments of isolated climate risks fail to capture fully.

The United States’ retreat from climate commitments adds a major political and economic obstacle to the global response. Rising fossil-fuel emissions, expanding electricity demand, and the weakening of climate safeguards deepen the gap between the scale of the threat and the scale of the response.

Declining low-level clouds and tropospheric ozone further complicate the climate outlook by strengthening warming and undermining natural cooling and carbon-absorption processes. Their combined influence demands serious consideration when evaluating the trajectory toward 4°C of warming this century.

The central conclusion is clear: climate change is not merely a future problem defined by a temperature target. It is an accelerating Earth-system crisis involving interconnected feedbacks, tipping points, ecological disruption, and profound risks to human civilization.

The question is no longer whether climate change is destabilizing the Earth system. The observed evidence establishes that it is. The defining challenge is whether humanity will respond to the scale and speed of that destabilization before cascading consequences become substantially more severe.
bookmark_borderTrump’s Hypocrisy: White Nationalism, Science Denial, and Government Intervention

Overview

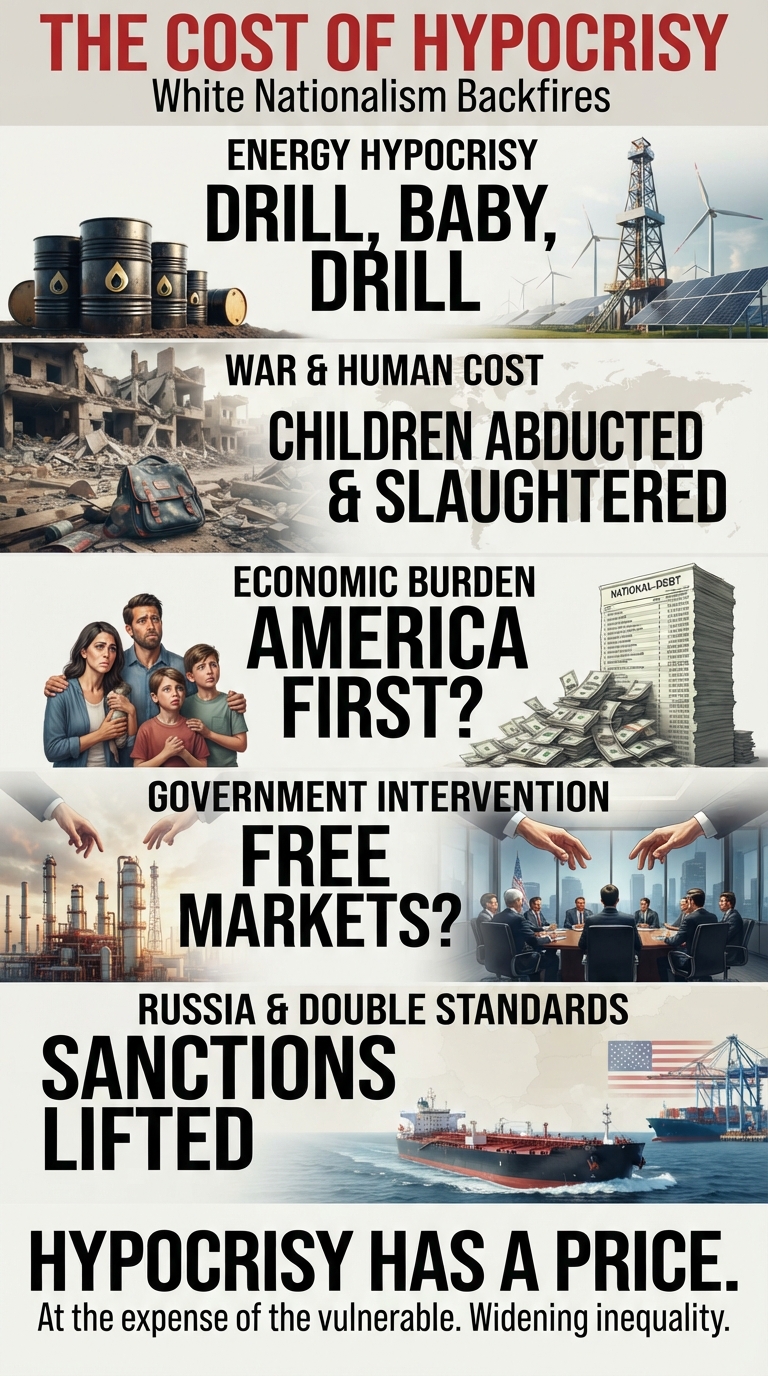
HYPOCRISY HAS A PRICE.

Trump promises to put America first. But his policies tell a different story.

From fossil-fuel subsidies and Russian diesel imports to government intervention, mounting economic burdens, and policies that deepen inequality, the contradictions are impossible to ignore.

Who pays the price? American families, the most vulnerable, and future generations.

Promises versus reality. Political rhetoric versus consequences.

The result: ideological extremism, economic inequality, and a governing agenda that contradicts its own claims.

When hypocrisy becomes policy, we all pay the price.

The Facts

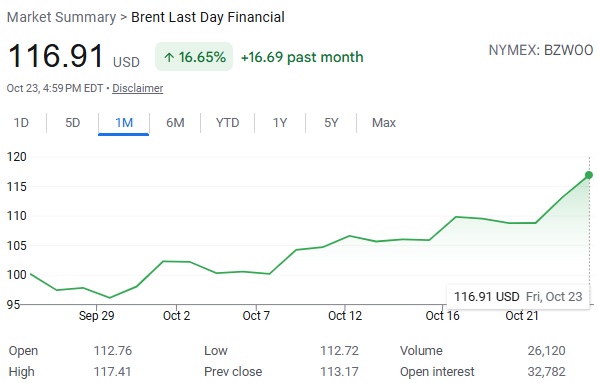
Brent crude futures recently approached $117 per barrel. However, futures prices tell only half the story. Due to the geopolitical instability associated with Trump’s support for Vladimir Putin and Benjamin Netanyahu, both indicted war criminals, the cost of delivering physical oil has soared to approximately half the futures price, pushing the final cost of a barrel to $150–$175.

Ironically, this has triggered the fastest and most significant global shift away from fossil-fuel dependency, directly contradicting Trump’s “Drill, Baby, Drill” ideology and its rejection of climate science. His policies and geopolitical alliances are accelerating the very energy transition his administration seeks to obstruct.

Russia claims to have abducted more than 700,000 Ukrainian children. Meanwhile, Netanyahu’s military campaign in Gaza has killed tens of thousands of Palestinians, including tens of thousands of children..

Trump himself faces allegations of war crimes and crimes against humanity involving U.S. military operations in the Caribbean and the targeting and deaths of schoolchildren at Shajareh Tayyebeh Elementary School in Minab, Hormozgan Province, Iran. These events expose the devastating human consequences of the conflicts associated with these leaders.

The Economy: Tariffs, Deficits, and the Cost of Corruption

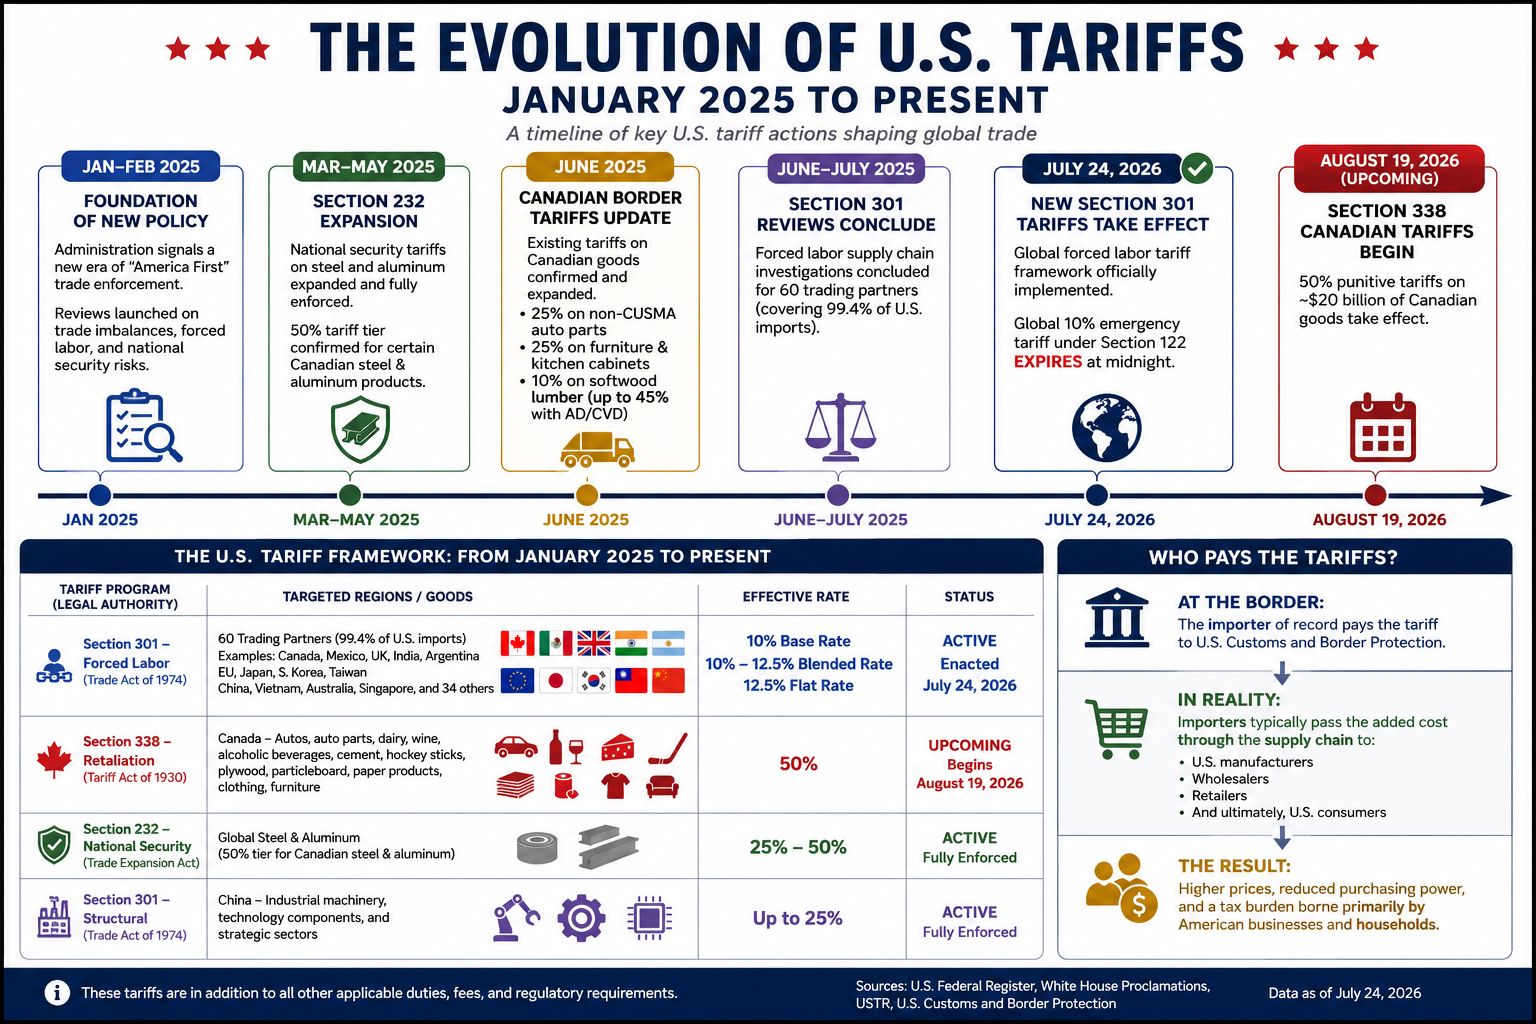
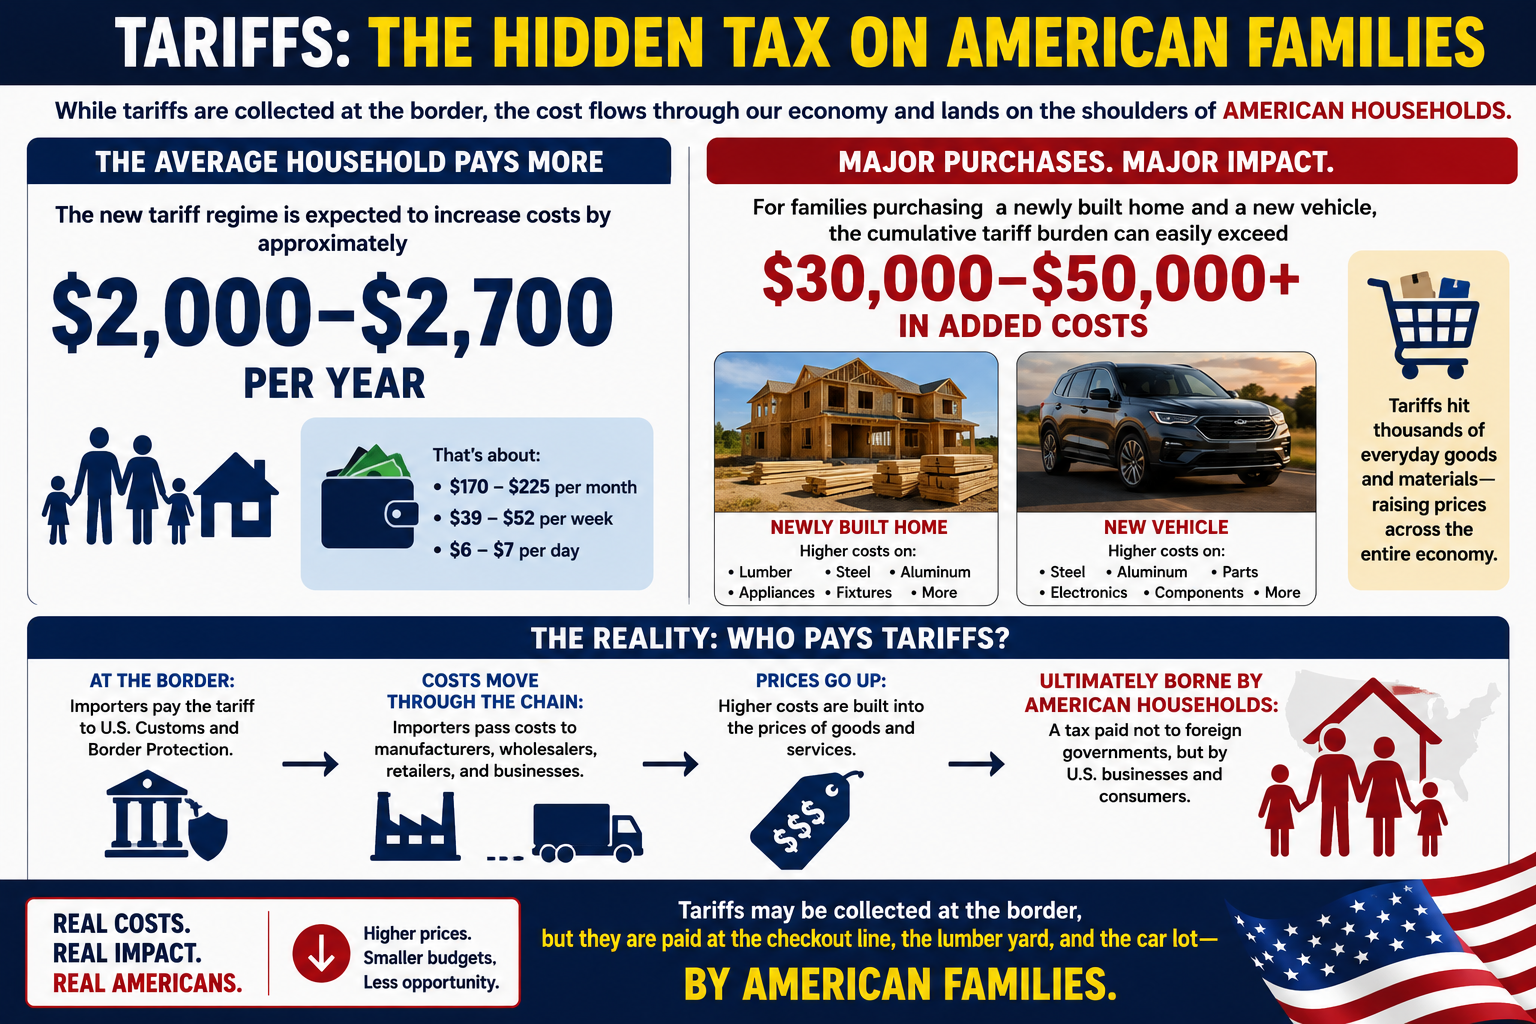
Trump’s tariffs, acts of war, anti-science claims, white nationalist policies, and corruption have contributed to unprecedented trade and budget deficits and an unsustainable national debt at record levels. The resulting fiscal pressures compound the economic burden of interest payments, while federal borrowing adds upward pressure to interest rates.

The Trump administration’s claims that racist, bigoted, and white nationalist policies “Make America Great Again” and put “America First” are contradicted by the economic consequences of its policies. Tariffs raise costs, trade conflicts disrupt markets, and government resources are directed toward favored industries while American households bear the burden.

This is not economic nationalism delivering broad-based prosperity. It is an economic agenda that places ideological priorities and political interests above the financial well-being of ordinary Americans. Its rhetoric bears the hallmarks of neo-fascist propaganda: ultranationalism, scapegoating, authoritarianism, and the presentation of exclusionary policies as patriotic necessities.

Fossil-Fuel Subsidies: Government Intervention Disguised as National Security

In his latest move, Trump has used his warmongering to subsidize the fossil-fuel industry. President Donald Trump invoked the Cold War-era Defense Production Act (DPA) to allocate up to $150 million in federal funding to subsidize and expand domestic oil-refining capacity.

This is direct government intervention in private markets, using public money and federal authority to protect and expand fossil-fuel infrastructure. The policy contradicts the administration’s free-market rhetoric while reinforcing dependence on the very fuels driving climate change.

Lifting Russian Diesel Sanctions: Fueling Putin’s War Machine

Trump’s intervention extends beyond domestic subsidies. On October 9, 2026, Trump announced a diesel-supply agreement with Russian President Vladimir Putin and temporarily eased U.S. sanctions on Russian diesel exports. The agreement reverses the direction of U.S. policy established after Russia’s invasion of Ukraine, when restrictions were imposed to deprive Moscow of revenue supporting its war. The U.S. Treasury subsequently issued a license allowing covered Russian diesel shipments to proceed without sanctions through April 2027.

On October 22, the Malta-flagged tanker Agioi Fanendes loaded approximately 40,000 metric tons of Russian diesel at Primorsk and headed for New York. Its cargo of 298,000–320,000 barrels represents just 7–8% of U.S. daily diesel consumption.

The irony is profound: after imposing sanctions to restrict Russian energy revenues and pressure Putin over his invasion of Ukraine, Trump has relaxed those restrictions to facilitate Russian diesel exports. This marginal contribution to U.S. fuel supplies undermines American credibility, weakens sanctions enforcement, and provides Moscow with renewed access to U.S. markets while its war against Ukraine continues.

The policy also exposes the weakness of the administration’s energy-security argument. A shipment representing a small fraction of one day’s U.S. diesel consumption does not resolve America’s structural dependence on volatile global fuel markets. Instead, the agreement ties American energy policy more closely to a Russian government waging war against a U.S. partner.

Trump’s Russian diesel agreement undermines U.S. credibility, weakens the rule-of-law framework behind sanctions, and rewards Putin with renewed access to American buyers. It also demonstrates how quickly the administration abandons its declared principles when political priorities demand it.

Government Ownership: Accusing China of What Washington Is Doing

The intervention extends far beyond oil refining and Russian diesel. As part of a major shift in U.S. industrial policy, ostensibly designed to strengthen national security and reduce reliance on China, the Trump administration has committed more than $26 billion to acquire equity stakes, warrants, or options in dozens of strategic private companies.

Financed through a combination of CHIPS Act funding, Department of Defense programs, and energy-related mandates, the federal portfolio encompasses at least 34 corporate deals.

This is a substantial expansion of government involvement in private enterprise. Rather than leaving investment decisions to private markets, the administration is using public resources to acquire financial interests in strategic businesses and influence the direction of American industry.

The hypocrisy is unmistakable: Trump condemns China for state-directed economic intervention while pursuing an increasingly interventionist industrial policy in the United States.

When China uses government resources to advance national industrial priorities, Trump presents it as a threat to free markets. When his own administration deploys federal funding, government ownership, strategic investment, and sanctions relief to advance its industrial and geopolitical priorities, he presents those actions as national security.

The distinction is political, not economic. Government intervention remains government intervention, regardless of whether it benefits Washington, Beijing, Moscow, or a favored private industry.

The Bottom Line: Hypocrisy as a Governing Strategy

The contradictions are undeniable.

An administration that rejects climate science and champions fossil fuels is presiding over geopolitical and economic developments that accelerate the global transition away from fossil-fuel dependence.

A president who claims to champion free markets is using federal power and taxpayer money to subsidize favored industries, acquire financial interests in private companies, and direct investment toward political and strategic priorities.

A political movement that promises to put America first is pursuing policies that impose substantial costs on American households, increase economic uncertainty, and compound the financial burdens inherited by future generations.

A president who condemns China’s government-directed economic policies is implementing comparable forms of intervention at home while claiming that his actions are fundamentally different.

The central issue is not whether government intervention is always wrong. It is the administration’s selective application of its own principles: free markets when criticizing political opponents, government intervention when advancing its own agenda, and national security as the justification for policies that benefit favored industries.

Trump’s record exposes the contradiction between his public rhetoric and his administration’s actions. White nationalism is presented as patriotism, science denial as economic policy, fossil-fuel subsidies as energy security, and government intervention as free-market leadership.

The result is a governing agenda defined by hypocrisy, ideological extremism, and policies that contradict the promises used to justify them—all at the expense of the most vulnerable, while further widening income inequality.

bookmark_borderInsurance, Housing, Credit, and the Global Economy

by Daniel Brouse and Sidd Mukherjee

The Insurance Feedback Crisis: Climate Change Is Already Destabilizing Housing, Credit, and the Global Economy

How Rising Costs, Restricted Coverage, and Insurance Withdrawals Are Transmitting Climate Risk Through the Financial System

October 2026

Introduction

Climate change is already disrupting insurance markets, and the consequences extend far beyond rising premiums. Insurers are increasing prices, restricting coverage, declining renewals, and withdrawing from some markets. These developments are creating a growing financial vulnerability for homeowners, mortgage lenders, investors, businesses, and governments.

One of the most dangerous—and least understood—parts of this crisis is the expansion of restricted coverage. When an insurer refuses to cover a property, the problem is obvious. When a policy remains in force but excludes important risks, limits payouts, or imposes conditions that leave substantial losses uncovered, the danger is hidden. Homeowners may continue paying premiums believing they are protected, only to discover after a disaster that their policies do not cover the damage they suffered.

This is the delayed-disclosure trap: the financial vulnerability exists before the disaster, but its full consequences may not become apparent until a claim is denied or severely limited. By then, the homeowner may face repair costs, mortgage obligations, and a damaged property without the insurance proceeds expected to cover the loss.

Restricted coverage can therefore undermine property values and mortgage security even when insurance remains available. A property may appear insured on paper while carrying substantial uninsured exposure. As these gaps widen, the difference between having an insurance policy and having adequate financial protection becomes increasingly important.

These developments are part of a larger system of interconnected feedbacks. Climate-related losses drive insurance costs higher and encourage insurers to limit their exposure. Higher costs and narrower protection weaken housing affordability and property values. Reduced property values and inadequate coverage increase financial risks for lenders and investors. When private insurance retreats, more costs shift to homeowners, businesses, and governments. Those added burdens can weaken the financial resources needed to adapt to future climate risks.

The central finding is that this feedback crisis is already underway. Rising premiums, insurance withdrawals, coverage restrictions, and growing exposure to uninsured losses are observable market developments. The interactions among these forces are creating additional risks that can reinforce one another, extending climate-related financial stress well beyond the locations directly affected by disasters.

The ultimate danger is not simply that insurance becomes more expensive. It is that insurance increasingly fails to provide the protection that households, lenders, and financial markets depend on. When that happens, climate risk can become a broader housing, credit, and economic problem.

1. The Crisis Is Already Underway

For years, the economic consequences of climate change were discussed primarily in terms of future damage: projected disaster losses, future insurance costs, declining property values, and the possibility that some regions would eventually become uninsurable.

That framing is increasingly inadequate.

In vulnerable markets, insurance premiums have already risen sharply, coverage has become more restrictive, and some insurers have stopped writing new policies or withdrawn from particular areas. Property owners are confronting higher deductibles, policy nonrenewals, and fewer affordable alternatives. Public insurance programs have assumed greater importance in some jurisdictions where private coverage has become difficult to obtain.

These are present market developments, not merely projections.

Their significance extends beyond the insurance industry. Insurance is part of the financial infrastructure supporting property ownership, mortgage lending, commercial investment, and infrastructure development. When that infrastructure becomes more expensive or less accessible, the effects propagate into other sectors.

The emerging pattern is therefore not simply:

Climate change → More expensive disasters.

It is:

Climate change → Physical losses → Insurance disruption → Financial stress → Reduced economic resilience → Greater vulnerability to subsequent losses.

The final stages of this chain can feed back into the original problem. Households with fewer financial resources have less capacity to improve their properties. Municipalities under fiscal pressure have less flexibility to invest in protective infrastructure. Businesses facing higher insurance and borrowing costs may defer resilience investments.

The result is a system in which the costs of climate change can make society less capable of absorbing the next climate-related shock.

The insurance market is already exposing this vulnerability.

2. The Industry Is Warning About the Same Systemic Mechanism

The October 14, 2026, memorandum Sounding the Alarm, published by Inside Track x (Re)Insurance, describes concerns reported by senior professionals in the UK and European insurance, reinsurance, and brokerage sectors.

The memo identifies three principal responses to increasing physical risk:

  1. Higher premiums as insurers attempt to price expected losses and uncertainty.
  2. Restricted coverage as insurers narrow the risks they will accept.
  3. Market withdrawal when exposure cannot be made commercially viable.

All three responses are already familiar features of stressed insurance markets.

An insurer can reduce its own exposure by refusing to renew a policy. A reinsurer can protect its capital by increasing prices or reducing capacity. An underwriting department can improve its financial position by avoiding properties it considers too risky.

But none of these decisions removes the physical hazard.

Instead, the financial responsibility moves elsewhere. Homeowners retain more risk. Businesses absorb higher costs. Lenders face greater uncertainty about collateral. Governments confront greater pressure to support disaster recovery and provide insurance alternatives.

This creates a structural conflict between the financial stability of individual institutions and the financial stability of the broader economy.

The memo also warns that commercial incentives, limitations in catastrophe modeling, and fragmented assessments of exposure can prevent the industry from fully recognizing systemic risk.

The central warning reinforces an increasingly important conclusion: conventional risk management can protect individual institutions without adequately protecting the economic system in which they operate.

Restricted Coverage

Insurance is caught in a delayed-disclosure trap. When a homeowner cannot obtain coverage, the problem is immediately apparent. But an equally serious—and less visible—risk is the growing restriction of coverage. Policies may contain exclusions, limitations, and coverage gaps buried in the fine print, leaving homeowners exposed to losses they believe are insured. As insurers respond to rising risks and losses, these restrictions are expanding. The danger often becomes clear only after a disaster, when homeowners discover that their policies do not cover the damage. By then, it is too late to obtain the protection they thought they had.

3. The First Feedback Loop: Physical Losses Drive Insurance Disruption

The initial feedback begins with physical climate risk.

Flooding, wildfire, severe storms, extreme heat, and other hazards can damage buildings, interrupt businesses, destroy infrastructure, and increase claims. The consequences depend on the hazard, location, exposure, and vulnerability of the assets involved.

As insurers experience losses or revise their expectations of future losses, they adjust prices and coverage.

The initial sequence is direct:

Physical risk increases → Expected losses or uncertainty increase → Premiums rise and coverage tightens.

This relationship is already reflected in insurance-market decisions.

The feedback becomes more consequential when higher premiums and restricted coverage affect the financial viability of the properties being insured.

Insurance is not merely another household expense. It is part of the cost of maintaining property, satisfying mortgage requirements, operating a business, and attracting investment.

When insurance costs increase faster than household income or business revenue, the resulting financial pressure can become difficult to absorb. When suitable coverage disappears altogether, the problem changes from affordability to insurability.

The original physical risk has now produced a financial consequence that can persist even after a particular disaster ends.

A homeowner whose property survives a storm may still face a higher renewal premium. A business that escapes direct damage may still experience higher insurance costs. A community that avoids a catastrophic event may nevertheless face market repricing as insurers reassess its exposure.

This is the first critical transition: climate risk is no longer expressed exclusively through damage after a disaster. It is increasingly expressed through the cost and availability of financial protection before the next disaster occurs.

4. The Second Feedback Loop: Insurance Costs Pressure Property Values

Property values depend on more than a building’s physical condition and location. They also depend on the expected costs of ownership, the availability of financing, and the risks associated with future use.

Insurance disruption affects all three.

When premiums rise, the total cost of owning a property increases. When deductibles rise or coverage becomes less comprehensive, owners retain more potential financial loss. When insurers withdraw, buyers may have difficulty obtaining the coverage required by lenders or may have to accept more expensive alternatives.

These conditions can weaken demand for exposed properties.

The resulting feedback is:

Higher insurance costs → Higher ownership costs → Reduced affordability and buyer demand → Downward pressure on property values.

The process is already evident in the way insurance availability has become a growing consideration in real-estate transactions and property-risk assessments. Its magnitude varies by market, and a premium increase alone does not prove that property values have declined. But the economic mechanism is straightforward.

A property can lose economic value without suffering new physical damage. If buyers anticipate years of higher insurance costs, recurring flood losses, or difficulty obtaining a mortgage, they may be willing to pay less for it.

This creates a new form of climate-related financial exposure: the risk that the cost of protecting an asset undermines the value of owning it.

The implications are substantial because residential property represents a major share of household wealth. Commercial property supports business operations, employment, and investment. Property values also contribute to local tax revenues.

As insurance-related affordability problems spread, the consequences can extend beyond individual property owners into household balance sheets, commercial activity, and municipal finance.

5. The Third Feedback Loop: Property Risk Becomes Credit Risk

Mortgage lending depends on borrowers’ ability to repay their loans and on the value of the assets securing those loans.

Insurance supports both sides of that arrangement. It protects against specified losses that could impair collateral, while its premiums form part of the borrower’s ongoing cost of ownership. As insurance becomes more expensive or less available, both protections can weaken.

Higher premiums increase the monthly cost of homeownership. For financially constrained borrowers, that additional expense can reduce the ability to meet mortgage payments and other obligations. At the same time, inadequate coverage can leave a property owner and lender more exposed to the financial consequences of damage. If insurance difficulties reduce property demand or values, the collateral securing outstanding loans may also weaken.

The resulting feedback is:

Insurance disruption → Higher ownership costs and greater retained losses → Mortgage stress and weaker collateral → Increased credit risk.

The systemic concern is concentration. If insurance affordability deteriorates across a large number of properties in the same region, the financial consequences can occur together. Lenders may face correlated risks rather than isolated borrower problems. That possibility is particularly important where local economies, property tax revenues, employment, and household wealth are heavily dependent on real estate.

The risk is already being transmitted into financing decisions where insurance availability affects property transactions and underwriting. The connection between insurance and credit is established. The growing importance of climate-related insurability makes that connection increasingly consequential.

6. The Fourth Feedback Loop: Reinsurance Can Amplify Market Stress

Reinsurance provides financial protection to insurance companies against large or concentrated losses. It helps primary insurers manage their exposures and maintain the capacity to write policies. But reinsurance is itself exposed to catastrophe risk.

When reinsurers reassess expected losses or uncertainty, they may increase prices, change coverage terms, reduce available capacity, or require primary insurers to retain more risk. Primary insurers then face additional financial pressure. They may raise premiums, tighten underwriting, reduce policy limits, or withdraw from markets where acceptable returns cannot be achieved.

The feedback is:

Higher catastrophe losses or uncertainty → Reinsurance pressure → Higher primary-insurance costs or reduced capacity → Less affordable and less available coverage → Greater financial exposure outside the insurance system.

This process can spread the effects of physical risk beyond the location where a disaster occurs. An insurer’s response depends on its portfolio, reinsurance contracts, capital position, and exposure to multiple regions. The important point is that reinsurance does not eliminate catastrophe risk. It redistributes that risk through another layer of the financial system. If multiple insurers and reinsurers simultaneously reassess similar exposures, their decisions can reinforce market-wide tightening.

The October 2026 memo’s concern about interconnected risk is particularly relevant here. A firm may manage its own exposures prudently while the combined decisions of many firms reduce the capacity available to the wider economy.

The memo reinforces the need to monitor the relationship between physical losses, reinsurance costs, primary-market availability, and the financial resources available to absorb future losses.

7. The Fifth Feedback Loop: Public Intervention Transfers Costs to Taxpayers

As private insurance becomes unaffordable or unavailable, governments face growing pressure to intervene.

Public responses can include insurance programs of last resort, disaster assistance, infrastructure repairs, emergency housing, subsidized mitigation, and other forms of financial support.

Such measures can protect households and communities from immediate hardship. They can also preserve economic activity when private insurance capacity is insufficient. But they do not eliminate the physical losses. They redistribute part of the cost to public budgets.

The resulting feedback is:

Insurance withdrawal → Greater uninsured exposure → Increased demand for public support → Higher public expenditure and contingent liabilities → Greater fiscal pressure.

If the same communities repeatedly experience damaging events, governments may face recurring costs rather than a single temporary emergency. Meanwhile, the underlying economic base may weaken. Property values can come under pressure, businesses can suffer interruptions, and residents may relocate or reduce spending. These changes can reduce local revenues just as the need for public spending increases. The resulting fiscal squeeze is a direct consequence of the interaction between physical risk and financial vulnerability.

It is already visible in the expanding importance of public insurance and disaster-recovery arrangements in some exposed markets. The long-term fiscal consequences will depend on the scale of future losses, policy design, tax capacity, and the effectiveness of adaptation.

The danger is that public intervention can become a substitute for reducing underlying risk. If subsidies keep vulnerable properties insured without improving their resilience, governments may accumulate liabilities while leaving the physical exposure largely unchanged.

A sustainable response must therefore combine financial assistance with measures that reduce expected losses.

8. The Sixth Feedback Loop: Financial Stress Can Reduce Resilience

The preceding mechanisms reveal a more troubling feedback: the financial consequences of climate risk can reduce the capacity to manage future climate risk.

Consider a household facing higher premiums, a larger deductible, and rising repair costs. It may have less money available to install flood protection, replace a vulnerable roof, improve drainage, or strengthen the property against future damage.

Consider a municipality facing repeated disaster-recovery expenses and declining property revenues. It may have less capacity to upgrade stormwater infrastructure, maintain protective systems, or invest in long-term resilience.

Consider a business facing higher insurance and borrowing costs. It may delay investments that would otherwise reduce its exposure to future hazards.

The resulting feedback is:

Climate losses → Higher financial costs → Reduced capacity for adaptation → Greater vulnerability to subsequent losses.

This is a critical transition from a sequence of separate financial problems to a self-reinforcing system.

The original hazard creates damage or increases expected losses. Those losses generate financial pressure. Financial pressure constrains adaptation. Reduced adaptation leaves assets more exposed to future hazards. The next event then encounters a system that may be less prepared than before.

This mechanism is not merely theoretical. The financial constraints on households, municipalities, and businesses are real, and the need to pay for insurance and recovery competes with the need to invest in resilience.

9. The Combined Feedback System Is More Dangerous Than Any Individual Effect

The six feedbacks are interconnected.

Higher physical losses can raise insurance and reinsurance costs. Higher insurance costs can weaken property affordability. Reduced affordability can affect demand and financing. Weaker property values can increase credit risk and undermine local tax revenues. Public intervention can shift losses to taxpayers. Financial pressure can then reduce the resources available for adaptation.

These are not independent problems. They form a connected system in which stress in one sector can reinforce stress elsewhere.

The combined mechanism can be represented as follows:

Climate-related physical losses

↓

Higher insurance and reinsurance costs; restricted coverage and withdrawals

↓

Higher property ownership costs and greater uninsured exposure

↓

Weaker affordability, property demand, and financing conditions

↓

Increased mortgage vulnerability and public financial pressure

↓

Reduced resources for adaptation and recovery

↓

Greater vulnerability to future losses

The final step closes the feedback loop.

The significance is that the total economic effect can exceed the direct cost of any individual disaster. Financial interactions can prolong losses, transmit them to unaffected sectors, and weaken the capacity to recover. This is why insurance-market stress deserves attention as a systemic economic warning rather than simply an industry problem.

It also explains why waiting for an insurer or a major bank to fail would be the wrong approach. Financial instability can develop through declining affordability, reduced coverage, weaker investment, and growing public liabilities long before a dramatic institutional failure occurs.

The feedbacks do not need to culminate in a global financial collapse to cause substantial economic damage. They are already imposing persistent costs on households, businesses, and governments.

10. Why the 2008 Financial Crisis Is a Warning

The October 2026 industry memo compares the potential consequences of widespread uninsured property risk with vulnerabilities associated with the 2008 mortgage-market crisis. The comparison is useful because it highlights how problems involving property and credit can spread through interconnected financial relationships.

The 2008 crisis involved mortgage underwriting failures, excessive leverage, complex financial instruments, and weaknesses in financial oversight. Climate-related insurance disruption has a different underlying driver: changing physical risk and the difficulty of financing assets exposed to that risk.

The important similarity is the transmission mechanism. In both cases, problems involving the value, financing, or risk assessment of property can extend into lending and broader financial markets.

Climate-related insurance disruption can undermine property finance if coverage becomes unavailable, ownership costs rise sharply, or collateral values weaken. If these developments occur across many regions simultaneously, they could contribute to a broader financial shock.

The lesson is to recognize interconnected vulnerabilities before they become acute. Regulators and financial institutions should not wait for widespread defaults to begin evaluating how insurance-market disruption could affect lending, collateral, and public finance.

11. What the Evidence Already Shows

Observed developments

Insurance markets in several exposed regions are experiencing higher premiums, coverage restrictions, nonrenewals, and insurer withdrawals. Public insurance and disaster-assistance arrangements are increasingly important in some markets. Insurance availability is also an increasingly significant factor in property transactions and financial risk assessment.

These developments establish that insurance-market stress is already occurring.

Established economic mechanisms

Insurance costs affect property ownership expenses. Coverage requirements influence mortgage financing. Property values affect collateral. Reinsurance influences primary-market capacity. Public disaster spending affects government budgets.

These relationships provide a sound basis for evaluating how insurance disruption can transmit financial pressure across the economy.

Emerging systemic feedbacks

The interaction of insurance costs, property affordability, mortgage exposure, public liabilities, and reduced adaptation capacity creates a credible pathway toward self-reinforcing economic stress.

Uncertain outcomes

The crisis is already observable in its component parts. The systemic danger is that those parts can reinforce one another faster than institutions respond.

12. The Policy Response Must Address the Feedbacks, Not Just the Symptoms

The appropriate response is not simply to subsidize insurance premiums or require insurers to maintain coverage regardless of risk.

Those measures may provide temporary relief, but they cannot eliminate physical hazards. If they suppress risk signals without reducing exposure, they may encourage continued investment in vulnerable locations and transfer increasingly large liabilities to taxpayers.

A more effective response must address the causes and interactions of the feedback system.

Reduce the underlying physical risk

Greenhouse gas emissions influence long-term warming and many associated hazards. Reducing emissions limits additional future climate risk, although it cannot prevent all near-term losses.

Mitigation must be accompanied by adaptation because significant physical risks already exist.

Improve the resilience of exposed assets

Building standards, flood protection, drainage improvements, wildfire mitigation, resilient infrastructure, and risk-informed land use can reduce expected losses.

Investments should be evaluated against transparent estimates of their costs, benefits, maintenance requirements, and remaining exposure.

Where protection is not physically or economically sustainable, policymakers must consider fair and orderly relocation rather than assuming every property can be protected indefinitely.

Monitor the entire financial transmission chain

Regulators should examine insurance affordability and availability alongside mortgage performance, property values, reinsurance capacity, bank exposure, and public liabilities.

Stress tests should include scenarios in which insurance markets tighten across multiple regions at the same time.

The objective should be to identify correlated exposure before it generates substantial financial losses.

Improve catastrophe-model transparency

Insurers and reinsurers should clearly disclose material assumptions and uncertainties in their risk assessments. Independent review should investigate credible concerns about commercial pressure, inadequate data, and the underestimation of changing hazards.

The goal is to ensure that decisions reflect defensible estimates of risk rather than incentives to understate it.

Protect vulnerable households without concealing risk

Public support may be necessary to prevent immediate hardship and preserve access to essential coverage. But support should be linked, where appropriate, to mitigation, stronger building practices, and realistic assessments of long-term exposure.

A policy that preserves coverage without reducing the underlying risk defer costs rather than solve the problem.

13. Conclusion: The Feedback Crisis Has Already Begun

The Protection Gap Is a Critical Link in the Climate Feedback Crisis

The climate-insurance crisis is already unfolding. Rising premiums, restricted coverage, nonrenewals, and insurer withdrawals are changing the financial risks associated with owning property. These are not merely forecasts of what might happen in a warmer future. They are observable developments whose economic consequences are already being felt.

Restricted coverage deserves particular attention because it can conceal financial exposure rather than eliminate it. When a policy excludes an increasingly important hazard, limits the amount payable, or imposes conditions that prevent a full recovery, the homeowner may remain exposed even while paying for insurance. The inadequacy of that protection may not become apparent until a disaster triggers a claim.

This delayed disclosure creates a dangerous mismatch between perceived security and actual financial resilience. Homeowners may believe their properties are protected. Mortgage lenders may assume that required insurance adequately safeguards their collateral. Investors may underestimate the exposure embedded in real estate portfolios. Yet a property with substantial uninsured risk can suffer serious financial damage even when an insurance policy remains active.

The consequences can reinforce one another. Climate-related damage increases insurance losses. Insurers respond through higher premiums, tighter terms, exclusions, and withdrawals. Those changes increase ownership costs and expose homeowners to losses they cannot readily absorb. Property values and mortgage security can weaken, while defaults, repair costs, and public financial obligations may rise. Governments and taxpayers can then inherit a larger share of the burden. If these pressures reduce the resources available for prevention and adaptation, future losses can become even greater.

This is the feedback mechanism at the heart of the crisis: climate risk increases financial vulnerability, and financial vulnerability can make society less capable of managing the next climate-related loss.

The appropriate response must therefore go beyond monitoring premiums and counting policy cancellations. Regulators, insurers, lenders, and policymakers need to examine what policies actually cover, how exclusions are changing, whether coverage limits remain adequate, and how much risk is being transferred to households and the public. Insurance availability alone is not a sufficient measure of financial protection.

The evidence establishes the need to take the observed disruption seriously and to investigate how its interacting effects are evolving. The precise scale and timing of future financial consequences remain uncertain, but the underlying feedback mechanisms are already visible.

The critical question is no longer simply whether homeowners can obtain insurance. It is whether the insurance they can obtain will actually protect them when disaster strikes. As restricted coverage expands, the gap between insured property and adequately protected property may become one of the most consequential—and least visible—channels through which climate change destabilizes the economy.

Insurance can redistribute financial losses, but it cannot eliminate the physical risks that generate them. When those risks undermine the financial systems that support property ownership, lending, and investment, climate change becomes a systemic economic problem.

The feedback crisis has already begun. Whether it remains manageable or develops into much broader financial instability depends on how quickly society recognizes the connections and acts to reduce the underlying risks.


References and Further Reading

Primary industry source

Inside Track x (Re)Insurance. (October 14, 2026). Sounding the Alarm: Insurance and Reinsurance Memo.

https://static1.squarespace.com/static/697b3c8cf1bdde2c6ff1b5d5/t/6acebb5992f73c3954b746e5/1791933273139/Insurance+and+Reinsurance+Memo.pdf

This memo provides the principal industry perspective on physical risk, insurance repricing, coverage restrictions, market withdrawal, catastrophe modeling, and systemic financial vulnerability. Its findings should be interpreted in light of its aggregated and anonymized methodology.

Related research

Brouse, D., and Mukherjee, S. Climate Change and the Insurance Crisis: Rising Costs, Shrinking Availability, and the Limits of Insurability.

https://www.kingarthur.com/global_warming/Insurance-Cost-and-Availability.html

Brouse, D., and Mukherjee, S. Climate Change and Insurance: Costs, Availability, and Sustainability.

https://www.kingarthur.com/global_warming/Insurance-Cost-and-Availability-2025.html

Brouse, D., and Mukherjee, S. The Collapse Point: How Climate Change Is Breaking Insurance—and Capitalism With It.

https://www.kingarthur.com/global_warming/Insurance-Economic-Climate-Collapse.html

Brouse, D., and Mukherjee, S. Climate Risk, Insurance Market Instability, and Systemic Threats to Capital Formation.

https://www.kingarthur.com/global_warming/Insurance-Collapse-intro.html

Brouse, D. Financial Planning for Climate Change.

https://www.kingarthur.com/global_warming/Financial-Planning-for-Climate-Change.html

Brouse, D., and Mukherjee, S. Coupled Climate Feedbacks and Cascading Real Estate Risk.

https://www.kingarthur.com/global_warming/Feedbacks-Cascading-Real-Estate-Risk.html

Methodological note

This paper synthesizes an industry memorandum, related climate-insurance research, and established economic mechanisms. It does not present a new statistical model or independently estimate the probability of a global financial crisis. Claims about observed insurance-market disruption are distinct from claims about the magnitude of interconnected feedbacks or the timing of future systemic outcomes. Those latter questions require continued empirical investigation using insurance, reinsurance, property, credit, and public-finance data.

bookmark_borderThe Covenant of Balance

An Interfaith Synthesis of Ecological Ethics, Earth’s Energy Imbalance, and Integrated Climate Stewardship

By Daniel Brouse

Overview

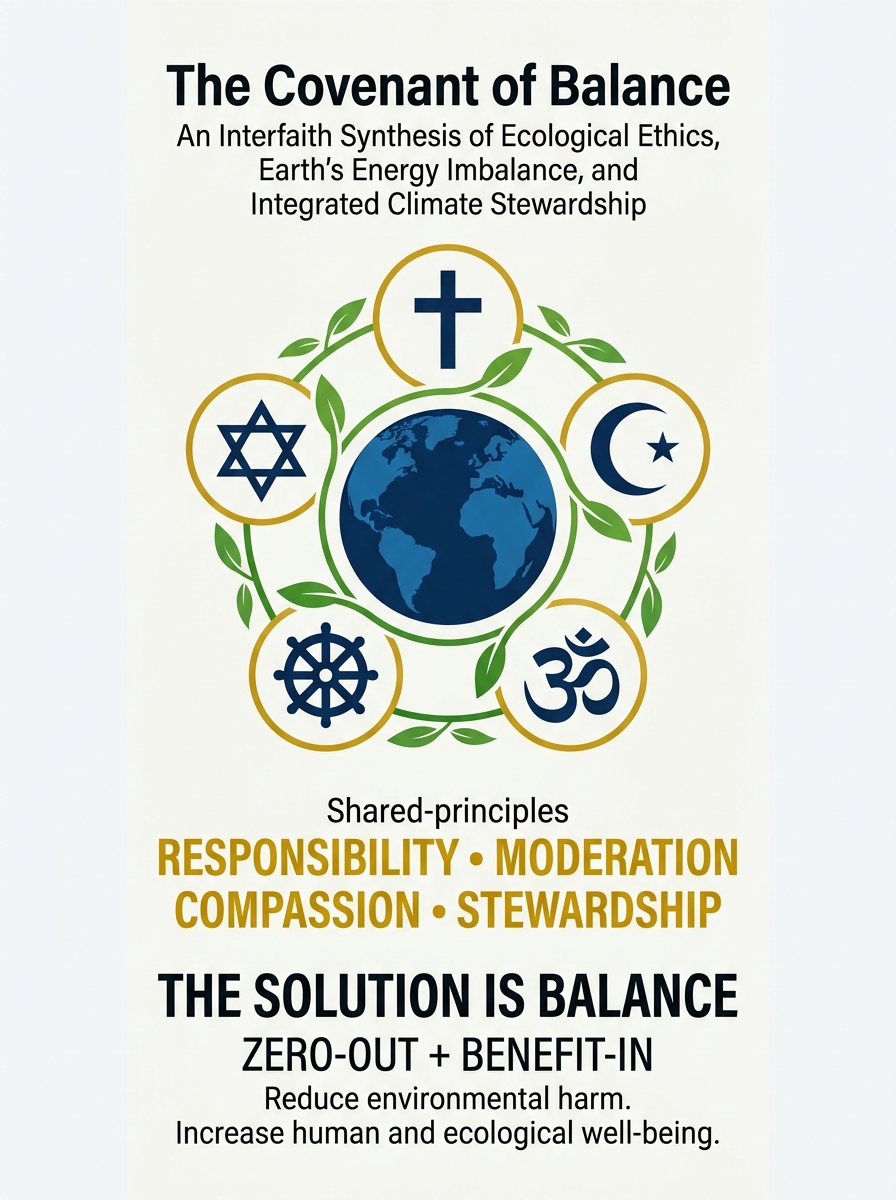
THE COVENANT OF BALANCE
An Interfaith Synthesis of Ecological Ethics, Earth’s Energy Imbalance, and Integrated Climate Stewardship

What do Christianity, Islam, Judaism, Buddhism, and Hinduism have in common when it comes to protecting our planet?

Although these five religious traditions differ in their beliefs and practices, each offers ethical principles that can help guide humanity toward a more responsible relationship with the Earth.

Christianity emphasizes creation care and stewardship.
Islam teaches Mīzān—balance—and responsible trusteeship.
Judaism emphasizes bal tashchit—avoiding needless destruction and waste.
Buddhism highlights interdependence, compassion, and mindful consumption.
Hinduism emphasizes dharma, responsibility, and minimizing harm.

Different traditions. Different teachings. A shared recognition that our actions have consequences.

THE SCIENCE: Earth’s energy imbalance is driving climate change. Greenhouse gases trap additional energy in the Earth system, warming the oceans, atmosphere, and land while contributing to ice loss, rising seas, and ecological disruption. Interacting climate feedbacks can amplify these changes.

THE ETHICS: Our responsibility extends beyond ourselves—to other people, vulnerable communities, future generations, and the living systems that sustain us.

THE SOLUTION: BALANCE.

My paper connects these five religious traditions with two complementary frameworks:

Humanity’s Greatest Threat Is Humanity: Energy Imbalance → Climate Change → The Solution = Balance

Integrated Climate Stewardship: ZERO-OUT + BENEFIT-IN

ZERO-OUT means reducing actual sources of environmental harm. BENEFIT-IN means improving affordability, efficiency, resilience, comfort, and quality of life while protecting the natural systems on which we depend.

This is not a claim that all religions teach the same thing or agree on every environmental issue. It is an invitation to identify common ethical ground and turn shared concerns into practical, measurable action.

We do not need to share one religion to share responsibility for the Earth.

Five traditions. One interconnected planet. A common responsibility.

THE SOLUTION IS BALANCE.

Read the paper:

The Covenant of Balance: An Interfaith Synthesis of Ecological Ethics, Earth’s Energy Imbalance, and Integrated Climate Stewardship

Introduction

Humanity faces a profound ecological challenge: our economic systems, patterns of consumption, and exploitation of natural resources are disrupting the balance of Earth’s interconnected systems. Climate change is a central expression of this disruption, driven primarily by the accumulation of greenhouse gases that trap additional energy within the Earth system. Addressing this crisis requires scientific understanding, economic transformation, practical action, and an ethical framework capable of motivating change across cultures and societies.

This paper synthesizes five major religious traditions—Christianity, Islam, Judaism, Buddhism, and Hinduism—with two complementary frameworks: “Humanity’s Greatest Threat Is Humanity: Energy Imbalance → Climate Change → The Solution = Balance” and “Integrated Climate Stewardship.” Christianity is considered broadly across its Catholic, Orthodox, Protestant, evangelical, and other traditions. Pope Francis’s Laudato si’ and Laudate Deum are examined as influential Catholic contributions within the wider Christian conversation, alongside broader Christian teachings and initiatives concerning creation care.

Despite their theological differences, these traditions offer overlapping principles of responsibility, restraint, compassion, justice, and care for the living world. Their ethical insights can be connected with climate science and translated into practical action through Integrated Climate Stewardship: ZERO-OUT + BENEFIT-IN. This approach emphasizes eliminating or substantially reducing actual sources of environmental harm while bringing tangible benefits into daily life through lower costs, improved resource efficiency, greater resilience, and healthier communities.

The central proposition is that a sustainable future requires balance at multiple levels: physical, ecological, economic, social, and ethical. Religious traditions can help articulate why that balance matters; science can explain the physical processes involved; and practical stewardship can help translate shared values into measurable action.

1. Introduction: A Shared Responsibility for Our Common Home

Humanity is part of an interconnected living system. The atmosphere, oceans, forests, soils, freshwater systems, and countless forms of life interact through physical, chemical, and biological processes. Human societies depend on these systems for food, water, energy, shelter, health, and economic activity.

Yet many prevailing economic practices treat the natural world as an effectively unlimited source of materials and an unlimited destination for waste. The resulting pressures include climate change, biodiversity loss, deforestation, pollution, soil degradation, freshwater stress, and the depletion of natural resources.

Climate change makes the consequences of this imbalance particularly visible. Greenhouse gas emissions alter Earth’s energy balance, while interacting feedbacks and ecological changes can amplify the resulting impacts. The consequences extend beyond temperature: they include changes in precipitation, ice loss, sea-level rise, ecosystem disruption, agricultural stress, and risks to human health and economic stability.

The problem is scientific, but it is also ethical. Science can measure changing conditions and investigate their causes. It cannot, by itself, determine the full moral responsibilities of individuals, institutions, governments, or economic systems.

Religious and philosophical traditions have long explored questions of responsibility, restraint, justice, compassion, and humanity’s relationship with the natural world. Although their beliefs and practices differ, they offer resources for examining the values that shape human behavior.

This paper brings five traditions into conversation:

  • Christianity, including Catholic, Orthodox, Protestant, evangelical, and other Christian perspectives.
  • Islam, particularly the principles of Mīzān and Khilāfah.
  • Judaism, including the principle of bal tashchit.
  • Buddhism, including interdependence, compassion, and mindful consumption.
  • Hinduism, including dharma, ahimsa, and reverence for the Earth.

The purpose is not to suggest that these traditions are identical or that their followers agree on every environmental question. It is to identify meaningful areas of convergence and connect them to a practical framework for ecological responsibility.

2. Christianity: Creation Care, Stewardship, and Love of Neighbor

Christian environmental ethics draws on a broad range of biblical teachings and theological traditions. Across Catholic, Orthodox, Protestant, evangelical, and other Christian communities, creation care has been understood through concepts such as stewardship, responsibility, humility, justice, and love of neighbor. Interpretations differ, and environmental responsibility is not expressed uniformly across all denominations.

Several biblical passages are particularly relevant.

Genesis 2:15 describes humanity’s placement in the garden of Eden to work it and keep it. This passage supports an understanding of human responsibility that includes both productive use and protection of the natural world.

Psalm 24:1 declares that the Earth belongs to the Lord. This can be understood as a challenge to the assumption that human ownership confers unlimited moral permission to destroy or exhaust the resources on which other life depends.

Romans 8:19–23 portrays creation as groaning and awaiting liberation. Christian environmental thinkers have drawn on this passage to reflect on ecological suffering and the relationship between human redemption and the wider creation.

Christian traditions also emphasize love of neighbor. Environmental degradation disproportionately affects people with limited resources, including communities exposed to extreme heat, flooding, drought, pollution, food insecurity, and displacement. Climate responsibility can therefore be understood as an expression of concern for vulnerable people, future generations, and the conditions necessary for human flourishing.

Christian contributions to ecological responsibility

Several major initiatives illustrate the breadth of Christian environmental engagement.

Pope Francis’s Laudato si’: On Care for Our Common Home (2015) presents an influential Catholic account of ecological responsibility, linking environmental degradation with social inequality, consumerism, economic priorities, and the need for an integrated response. Laudate Deum (2023) further emphasizes the urgency of the climate crisis and the inadequacy of responses that fail to match the scale of the problem.

These documents are important contributions to Christian environmental thought, but they do not represent every Christian denomination or establish a single environmental doctrine binding on all Christians.

Other examples include the World Council of Churches’ work on climate justice and ecological sustainability, the Lausanne Movement’s Cape Town Commitment and its wider evangelical discussions of creation care, and environmental initiatives within evangelical Christianity, including the Evangelical Environmental Network.

Together, these efforts demonstrate that ecological responsibility is discussed across multiple Christian traditions, even where theological interpretations, political priorities, and preferred policy responses differ.

The broader Christian contribution to an interfaith framework can be expressed through three connected principles:

  1. Creation care: The natural world is not merely a disposable storehouse of resources.
  2. Responsible stewardship: Human power over nature entails obligations, not unlimited permission to exploit.
  3. Love of neighbor: Environmental decisions should consider their consequences for other people, especially vulnerable communities and future generations.

These principles connect naturally with the concept of balance: humanity’s use of the Earth should sustain the conditions that make life possible rather than progressively undermine them.

3. Islam: Mīzān, Khilāfah, Tawḥīd, and Iqtisād

Islamic environmental ethics provides a particularly direct vocabulary for connecting ecological responsibility with balance.

Mīzān refers to balance, measure, and equilibrium. In the Qur’anic context, it conveys an order that should not be violated through excess or injustice. Applied to environmental responsibility, it encourages human beings to respect the limits, relationships, and conditions that sustain the natural world.

Khilāfah expresses humanity’s role as steward or trustee. Human beings exercise influence over the Earth, but that responsibility can be understood as an obligation to protect and manage creation rather than a license for unlimited exploitation.

Tawḥīd, the oneness of God, provides a theological foundation for understanding creation as an interconnected whole. Although the natural world contains immense diversity, its components exist within relationships that human activity can disrupt.

Iqtisād emphasizes moderation, economy, and avoiding excess. It challenges wasteful consumption and encourages responsible use of resources.

These principles are reflected in Al-Mizan: A Covenant for the Earth, launched in 2024 through an initiative associated with the United Nations Environment Programme’s Faith for Earth work. The document presents an Islamic framework for ecological responsibility, connecting spiritual principles with conservation, sustainability, and collective action.

Its contribution to this synthesis is the explicit connection between balance, trusteeship, moderation, and responsibility for the natural world.

4. Judaism: Bal Tashchit and Responsibility for Creation

Jewish environmental ethics includes the principle of bal tashchit, commonly understood as a prohibition against needless destruction or waste.

The principle is traditionally associated with Deuteronomy 20:19–20, which restricts the destruction of fruit-bearing trees during a siege. Its interpretation has extended into broader discussions of waste, resource conservation, and unnecessary harm.

Jewish teachings also draw on the creation narratives of Genesis, including the responsibilities associated with humanity’s place in the garden. As in Christianity, interpretations of dominion and human authority over nature vary, but Jewish environmental thought offers substantial resources for understanding human power as carrying moral obligations.

The Rabbinical Assembly’s The Green Covenant: A Jewish Pledge Toward Carbon Neutrality illustrates an effort to translate Jewish environmental values into institutional and practical commitments.

The relevance of bal tashchit extends beyond recycling or avoiding the waste of individual objects. It invites a broader question: when human activities needlessly damage ecosystems, squander resources, or impose preventable costs on future generations, what responsibility follows?

In the context of climate change, this principle supports reducing avoidable emissions, conserving energy and materials, preventing pollution, and questioning economic practices that generate unnecessary environmental damage.

5. Buddhism: Interdependence, Compassion, and Mindful Consumption

Buddhist teachings offer an ethical perspective centered on the interconnected nature of existence, the reduction of suffering, compassion, and awareness of the consequences of one’s actions.

Interdependence challenges the idea that human well-being can be separated from the well-being of other living systems. Food, water, climate, health, and economic stability depend on relationships among people, ecosystems, and physical processes.

Compassion extends ethical concern beyond the self. Environmental damage becomes relevant not only because it affects human comfort or prosperity, but also because it can cause suffering among vulnerable people and other living beings.

Mindful consumption encourages reflection on desire, attachment, and the consequences of acquiring and using material goods. It does not necessarily require rejecting technology or material comfort. Rather, it questions patterns of consumption that create harm without corresponding benefits to well-being.

The Time to Act Is Now: A Buddhist Declaration on Climate Change represents a Buddhist contribution to the climate discussion, emphasizing the relationship between climate responsibility, ethical conduct, and the need for action.

From this perspective, stewardship requires more than technical efficiency. It also involves examining the motivations and social arrangements that drive waste, excessive consumption, and disregard for the consequences of human behavior.

6. Hinduism: Dharma, Ahimsa, and Reverence for the Earth

Hindu traditions encompass a wide range of philosophies, practices, and interpretations. Environmental ethics within these traditions can draw on dharma, ahimsa, and reverence for the Earth.

Dharma can refer to duty, right conduct, and the responsibilities that sustain personal and social order. Environmental responsibility can be understood as part of fulfilling obligations to other living beings, communities, and the conditions that support life.

Ahimsa, commonly understood as nonviolence or the avoidance of harm, provides a basis for considering how human actions affect living beings and ecological systems. Its application to environmental issues varies across traditions, but it encourages attention to avoidable injury and destruction.

Hindu traditions also include forms of reverence for rivers, mountains, forests, animals, and the Earth itself. Bhūmi Devi, the Earth goddess, is one expression of the spiritual significance attributed to the Earth in Hindu traditions.

The Hindu Declaration on Climate Change, associated with the 2015 interfaith climate initiatives, articulates a Hindu contribution to the moral case for climate action and ecological responsibility.

These ideas connect environmental stewardship with duty, restraint, and respect for the living world. They encourage a view of human prosperity that does not depend on treating nature as morally irrelevant or endlessly expendable.

7. A Shared Ethical Framework Across Five Traditions

The five traditions differ in theology, scripture, spiritual practice, and their understanding of humanity’s place in creation. They should not be collapsed into a single religious doctrine. Nevertheless, their environmental teachings reveal several important areas of convergence.

TraditionRelevant principlesEnvironmental implication
ChristianityCreation care, stewardship, love of neighborProtect creation and consider the consequences for vulnerable people and future generations
IslamMīzān, Khilāfah, Tawḥīd, IqtisādRespect balance, exercise responsible trusteeship, recognize interconnection, and avoid excess
JudaismBal tashchit, responsibility for creationPrevent needless destruction and waste
BuddhismInterdependence, compassion, mindful consumptionReduce avoidable harm and reconsider excessive consumption
HinduismDharma, ahimsa, reverence for the EarthFulfill responsibilities and minimize harm to living systems

These parallels are meaningful, but they are not exact equivalences. Mīzān, for example, has a specific Qur’anic and Islamic context; bal tashchit has a distinct Jewish history; and Buddhist interdependence does not simply mean the same thing as Christian stewardship or Hindu dharma.

The common ground is more practical than doctrinal: human decisions affect interconnected systems, and ethical responsibility requires attention to the consequences of those decisions.

An interfaith environmental framework can therefore rest on several shared commitments:

  • Reduce avoidable harm.
  • Use resources responsibly.
  • Avoid unnecessary waste and excess.
  • Protect the conditions that sustain life.
  • Consider the needs of vulnerable communities.
  • Recognize obligations to future generations.
  • Translate ethical commitments into measurable action.

This is the foundation for connecting religious ethics with the scientific and practical framework developed in the two papers considered here.

8. The Scientific Foundation: Energy Imbalance and Climate Change

Religious ethics can motivate responsibility, but climate science must establish the physical processes and evidence involved.

Earth receives energy from the Sun and returns energy to space. Over time, the amount entering and leaving the Earth system determines whether the planet gains or loses energy.

Human-caused greenhouse gas emissions have altered this balance by reducing the rate at which Earth loses energy to space. The result is a positive energy imbalance: more energy accumulates within the Earth system than leaves it.

The oceans absorb the great majority of the excess heat accumulating in the climate system. Energy is also taken up by the atmosphere, land, and cryosphere. The consequences include rising temperatures, ocean warming, melting land ice, sea-level rise, and changes in the behavior of ecosystems and atmospheric circulation.

The central distinction is that climate change is not simply a problem of elevated surface temperature. Temperature is one indicator of a wider physical process involving energy storage, redistribution, and changes across interconnected systems.

From imbalance to interacting feedbacks

Climate systems contain feedback processes that can amplify or moderate an initial change. Examples include:

  • Ice and snow loss, which reduces reflectivity and allows more solar energy to be absorbed.
  • Changes in atmospheric water vapor, which affect the greenhouse effect.
  • Changes in clouds, which can alter both incoming solar radiation and outgoing infrared radiation.
  • Changes in ecosystems and vegetation, which can influence carbon storage, surface reflectivity, moisture, and local climate.
  • Ocean circulation changes, which redistribute heat and influence regional climate patterns.

These processes do not all operate in the same direction or with the same strength. Their effects depend on location, timescale, and the interactions among physical and biological systems.

The broader scientific concern is that feedbacks can interact. Multiple changes may reinforce one another, increase stress on ecosystems, and make the consequences of continued warming more severe.

The distinction between an ethical principle and a physical measurement is essential. Religious concepts of balance can help explain why disruption is morally significant, but they are not substitutes for observations, measurements, and scientific models. Conversely, climate science can describe physical changes without independently determining every ethical obligation arising from them.

The synthesis proposed here uses each framework for its appropriate purpose: ethics clarifies responsibility, science investigates the physical problem, and stewardship translates both into action.

9. Humanity’s Greatest Threat Is Humanity: Energy Imbalance → Climate Change → The Solution = Balance

The paper Humanity’s Greatest Threat Is Humanity: Energy Imbalance → Climate Change → The Solution = Balance presents balance as a central organizing principle for understanding the climate crisis and responding to it.

The sequence begins with human activities that alter Earth’s energy balance. These activities include greenhouse gas emissions from fossil fuels, land-use changes, and other human-caused influences on the climate system.

The resulting energy imbalance drives warming and contributes to changes in oceans, ice, weather patterns, ecosystems, and the distribution of heat and moisture.

The effects then interact with human systems. Agricultural disruption can affect food prices and availability. Environmental damage can increase economic losses and displacement. Resource stress can intensify existing inequalities and political pressures.

This sequence does not mean that every climate impact follows one inevitable pathway, or that every feedback leads to collapse. It means that environmental, economic, and social risks are connected and should not be evaluated as isolated problems.

Balance is the proposed solution in the sense of restoring conditions that support long-term stability and human flourishing. Physically, that requires reducing greenhouse gas emissions and ultimately bringing the climate system toward a sustainable energy balance. Ecologically, it requires protecting and restoring the systems that support life. Economically, it requires reconsidering practices that depend on unlimited material throughput and the externalization of environmental costs.

Ethically, balance means recognizing that short-term gains for some can impose lasting costs on others.

The religious traditions examined here provide different reasons for accepting these responsibilities. Their shared contribution is not a claim that the Earth must remain static or that all change is harmful. Rather, they support the principle that human power should be exercised with regard for consequences, limits, and obligations to others.

10. Integrated Climate Stewardship: ZERO-OUT + BENEFIT-IN

Integrated Climate Stewardship translates environmental responsibility into a practical framework for everyday life, businesses, institutions, and public policy.

Its central formula is:

ZERO-OUT + BENEFIT-IN

ZERO-OUT means eliminating or substantially reducing actual sources of environmental harm wherever practical. This includes reducing unnecessary energy use, fossil fuel consumption, waste, pollution, and resource-intensive activities.

BENEFIT-IN means choosing changes that also produce tangible benefits: lower utility bills, reduced operating costs, greater resilience, improved comfort, healthier living conditions, and more efficient use of resources.

The framework is intended to make climate stewardship a practical part of ordinary life rather than an obligation dependent entirely on sacrifice, charitable contributions, or distant technological promises.

Examples include:

  • Improving building efficiency and reducing unnecessary heating and cooling.
  • Using targeted heating and cooling rather than conditioning unused spaces.
  • Reducing electricity and hot-water demand.
  • Repairing, reusing, and maintaining products to extend their useful lives.
  • Reducing food waste and choosing efficient food-storage and preparation practices.
  • Using durable, efficient equipment when the total costs and environmental benefits justify it.
  • Protecting trees, soil, water, and vegetation where they provide measurable ecological benefits.
  • Improving household and community resilience to heat, storms, flooding, and power interruptions.

Not every action will be appropriate for every household or region. Costs, safety, building conditions, local climate, access to technology, and the environmental impacts of equipment all matter. The goal is to identify measures that produce real net benefits rather than simply shifting environmental costs from one place to another.

Why benefits matter

Climate communication often emphasizes costs, restrictions, and sacrifices. These are sometimes unavoidable, particularly when major structural changes are necessary. But stewardship can also produce immediate personal and social benefits.

Lower energy demand can reduce bills. Durable products can reduce replacement costs. Improved building performance can increase comfort. Better preparedness can limit losses during disruptions. Reducing waste can save money while reducing pressure on natural resources.

These benefits can make climate action more accessible to people who might otherwise see it as financially burdensome or disconnected from their daily lives.

The approach also helps distinguish genuine emissions reductions from accounting exercises. Offsets do not automatically eliminate the underlying source of pollution, and their quality varies. ZERO-OUT prioritizes direct reductions; BENEFIT-IN encourages additional improvements that support ecological and human well-being.

The framework does not imply that individual household measures alone can solve climate change. Electricity generation, industrial production, transportation, agriculture, infrastructure, and public policy remain essential. Individual action is most effective when supported by changes in the larger systems that shape available choices.

11. Economic Balance: Prosperity Without Ecological Destruction

Economic systems are human institutions, not independent forces beyond human responsibility. Their incentives, rules, and measures of success influence how resources are extracted, distributed, consumed, and discarded.

Traditional measures of economic activity can rise while natural capital declines. Gross domestic product, for example, does not by itself distinguish between productive investment, resource depletion, environmental restoration, and expenditures required to repair damage.

An economy can therefore report growth while imposing costs on ecosystems, public health, future generations, or communities that lack the power to avoid those costs.

A more integrated understanding of prosperity considers not only the production of goods and services but also the durability of the ecological systems on which economic activity depends.

This does not require rejecting markets, innovation, or economic growth in every form. It requires evaluating economic activity according to its full consequences rather than treating environmental costs as someone else’s problem.

A practical stewardship framework asks:

  • Does this activity meet a genuine need or produce a meaningful benefit?
  • Can the same benefit be achieved with less energy or fewer materials?
  • Are environmental costs being imposed on other people or future generations?
  • Does the activity strengthen or undermine long-term resilience?
  • Can waste be prevented at the source rather than managed after it occurs?
  • Do the financial incentives reward conservation and efficiency, or excessive extraction and disposal?

These questions connect the religious principle of moderation with economic accountability. They also connect scientific knowledge about finite ecological capacities with the practical task of designing better incentives and institutions.

The aim is not balance for its own sake as an abstract slogan. It is an economic system that can support human well-being without progressively undermining the natural systems that make prosperity possible.

12. Justice, Vulnerability, and Future Generations

Environmental damage is not distributed evenly. Communities differ in their exposure to hazards, their access to resources, their capacity to recover, and their historical contribution to environmental pressures.

Low-income households may have fewer options for improving inefficient housing or recovering from extreme weather. Coastal communities may face growing flood and erosion risks. Agricultural communities may be exposed to changing rainfall patterns, heat, and crop stress. People with limited access to healthcare, reliable infrastructure, or financial reserves may suffer disproportionately from environmental disruption.

These inequalities make climate stewardship a question of justice as well as physical science.

Christian teachings on love of neighbor, Islamic concepts of trusteeship and justice, Jewish obligations against needless destruction, Buddhist compassion, and Hindu principles of duty and minimizing harm can all contribute to discussions of how environmental costs and responsibilities should be shared.

The traditions do not necessarily prescribe identical policies. Nevertheless, their ethical resources support asking who benefits from environmentally damaging activities, who bears the costs, and whose needs are excluded from decision-making.

Future generations are particularly important because they cannot participate directly in current decisions, even though they may inherit the consequences. Stewardship therefore requires a time horizon longer than an election cycle, quarterly earnings report, or individual consumer decision.

A balanced approach must consider the rights and needs of people who have little influence over the choices that shape their future.

13. Indigenous Knowledge and Local Stewardship

Indigenous peoples and local communities hold diverse traditions of environmental knowledge, place-based observation, and resource management. These traditions are not uniform, and they should not be romanticized as though every community has identical practices or perspectives.

In many places, however, Indigenous knowledge contributes valuable understanding of ecosystems, seasonal changes, species relationships, fire management, water, soils, and long-term landscape stewardship.

Such knowledge can complement scientific research when collaboration respects community authority, cultural context, and rights over traditional knowledge. It should not be appropriated without consent or treated as a substitute for the participation of the people who hold it.

The interfaith framework developed here reinforces the importance of humility: no single institution, discipline, or tradition possesses every insight required to address complex environmental problems.

Effective stewardship draws on scientific evidence, local experience, ethical reflection, and the participation of communities directly affected by environmental decisions.

14. From Shared Values to Measurable Action

An interfaith agreement on environmental responsibility becomes meaningful when it leads to action. Broad ethical commitments can be translated into a practical program for households, congregations, schools, businesses, communities, and governments.

Individuals and households

  • Measure energy and resource use before choosing improvements.
  • Reduce avoidable consumption and waste.
  • Prioritize practical efficiency measures with favorable costs and benefits.
  • Protect and restore local ecosystems where feasible.
  • Prepare for climate-related hazards.
  • Evaluate actions according to actual outcomes rather than appearances.

Faith communities

  • Incorporate creation care and environmental responsibility into education and community service.
  • Improve the efficiency of buildings and facilities.
  • Reduce food, water, energy, and material waste.
  • Support vulnerable households facing environmental hazards.
  • Encourage cooperation among religious traditions without erasing their differences.
  • Publish measurable goals and report progress honestly.

Businesses and institutions

  • Identify environmental costs throughout operations and supply chains.
  • Reduce emissions and waste at their sources.
  • Evaluate investments using long-term costs and risks.
  • Improve product durability, repairability, and resource efficiency.
  • Avoid presenting symbolic commitments as substitutes for measurable reductions.

Governments and public institutions

  • Align infrastructure and energy decisions with credible climate science.
  • Support efficiency improvements and practical emissions reductions.
  • Protect public health and communities exposed to environmental hazards.
  • Incorporate environmental costs into economic decision-making.
  • Encourage innovation while evaluating its full environmental consequences.
  • Provide transparent data so progress can be independently assessed.

A common standard of accountability

Regardless of the religious, philosophical, or secular motivation behind an action, its environmental performance should be evaluated using evidence.

Relevant measures include energy consumption, greenhouse gas emissions, waste generation, water use, ecosystem condition, financial cost, resilience, and health outcomes.

Ethical intention matters, but good intentions alone do not establish that a practice is environmentally effective. Similarly, a measurable improvement does not eliminate the need to consider justice, consent, or other ethical questions.

The combination of moral purpose and measurable results provides a stronger basis for lasting stewardship.

15. An Interfaith Covenant of Balance

The traditions examined in this paper can contribute to a common commitment without requiring agreement on every theological question.

Such a covenant might be expressed through the following principles:

Respect the conditions that sustain life. Recognize that human prosperity depends on interconnected physical, ecological, and social systems.

Exercise power responsibly. Treat technological, economic, and political influence as carrying obligations to other people and the natural world.

Reduce needless harm. Avoid waste, pollution, and destructive practices when effective alternatives are available.

Practice moderation without rejecting well-being. Distinguish genuine human needs and benefits from unnecessary consumption that imposes disproportionate costs.

Protect the vulnerable. Consider the people and communities most exposed to environmental harm and least able to recover.

Preserve opportunities for future generations. Avoid decisions that create preventable, long-lasting damage for people who cannot participate in current choices.

Turn values into action. Establish practical goals, measure results, and revise ineffective approaches.

Cooperate across differences. Work with people of different religions, philosophies, and scientific disciplines while respecting their distinct beliefs and perspectives.

This covenant is a proposed synthesis, not an official declaration adopted by the five religious traditions. Its purpose is to identify a shared practical direction that can support cooperation without pretending that important differences do not exist.

16. Conclusion: The Solution Is Balance

Climate change is a physical consequence of a disrupted Earth energy balance, but the decisions that contribute to it are made within human economic, political, cultural, and ethical systems.

The scientific challenge is to understand the changes occurring across the Earth system, reduce the human causes of warming, and protect the ecological systems that sustain life. The ethical challenge is to recognize responsibility for the consequences of human choices. The practical challenge is to translate that responsibility into effective, affordable, and measurable action.

Christianity, Islam, Judaism, Buddhism, and Hinduism approach these questions through distinct teachings and traditions. Their concepts should not be treated as interchangeable, and their followers do not hold a single universal position on every environmental issue. Yet each tradition offers resources for considering responsibility, restraint, compassion, justice, or humanity’s relationship with the living world.

Christian creation care, Islamic Mīzān, Jewish bal tashchit, Buddhist interdependence, and Hindu dharma provide different ethical paths toward examining the consequences of human behavior. These paths can converge in practical commitments to reduce harm, conserve resources, protect vulnerable communities, and preserve the conditions necessary for future life.

The two complementary frameworks considered here connect these commitments with scientific understanding and everyday practice.

“Humanity’s Greatest Threat Is Humanity: Energy Imbalance → Climate Change → The Solution = Balance” identifies the disruption of Earth’s energy balance as a central physical dimension of the climate crisis and presents balance as a guiding principle for the response.

“Integrated Climate Stewardship” translates that principle into the practical formula ZERO-OUT + BENEFIT-IN: reduce actual sources of environmental harm while creating tangible benefits through efficiency, affordability, resilience, and improved quality of life.

Balance does not mean keeping every natural system unchanged, returning humanity to a preindustrial past, or requiring every community to follow the same path. It means recognizing physical limits, respecting ecological relationships, accounting for the consequences of economic activity, and exercising human power responsibly.

Religious ethics can help explain why stewardship matters. Climate science can establish what is happening and evaluate possible responses. Economic analysis can help identify costs, incentives, and opportunities. Practical action can turn these insights into measurable improvements.

The ultimate goal is not simply to slow environmental damage. It is to build a way of living and organizing society that supports human well-being while preserving the natural systems on which that well-being depends.

Humanity does not need to share one religion to share responsibility for the Earth. Nor must every person agree on the same philosophical foundation before cooperating on practical solutions.

We can begin with a common recognition: our choices matter because we are part of the system we are changing.

The solution is balance—understood scientifically, pursued ethically, and practiced every day.

References and Further Reading

  1. Francis. Laudato si’: On Care for Our Common Home. Encyclical, June 18, 2015. Vatican.
  2. Francis. Laudate Deum: Apostolic Exhortation to All People of Good Will on the Climate Crisis. October 4, 2023. Vatican.
  3. United Nations Environment Programme, Faith for Earth. Al-Mizan: A Covenant for the Earth. Launched in 2024.
  4. The Rabbinical Assembly. The Green Covenant: A Jewish Pledge Toward Carbon Neutrality. 2011.
  5. The Time to Act Is Now: A Buddhist Declaration on Climate Change. Buddhist declaration and related climate-action materials.
  6. Hindu Declaration on Climate Change. 2015.
  7. World Council of Churches. Climate justice and ecological sustainability initiatives and resources.
  8. Lausanne Movement. The Cape Town Commitment. 2010.
  9. Evangelical Environmental Network. Resources on Christian environmental stewardship.
  10. United Nations. Interfaith and faith-based initiatives addressing climate change and environmental responsibility, including the 2016 interfaith statement presented at the United Nations General Assembly.
  11. Brouse, Daniel. Humanity’s Greatest Threat Is Humanity: Energy Imbalance → Climate Change → The Solution = Balance. https://www.kingarthur.com/global_warming/Climate-Solution-Is-Balance.html
  12. Brouse, Daniel. Integrated Climate Stewardship. https://www.kingarthur.com/global_warming/Climate-Change-What-Can-I-Do.html

bookmark_borderScience Is Science: Confronting Denialism and Ecofascism

About Denialism and Ecofascism: Science Is Science

The Observation
Glad to know you’re watching out! At the same time, this divisiveness—when we desperately need everyone to pull together because it’s a CRISIS, right?—makes me somehow deeply sad.

That’s a big job right there… How do we reach those who seem furthest away from any kind of understanding? We need both a Winston Churchill and a Mahatma Gandhi in this endeavor…

The Response
Agreed. Both denialism and ecofascism are ideologies that ultimately defy logic. In very different ways, they can become a kind of combination of self-destruction and destruction of others.

I’ve spent years battling misinformation, propaganda, and rhetoric. To the best of my knowledge, neither Sidd nor I have successfully converted—or even educated—a single committed denier. Climate science has somehow been transformed into a “belief” system. But science has nothing to do with belief. 1 + 1 = 2. If someone refuses to “believe” that, what exactly can you do?

From the beginning, our work has been based on observations, data, mathematics, and the laws of physics. So yes, I think this is at the heart of the crisis. When we started this work, we genuinely believed humanity would eventually take action. We thought we had thousands, if not tens of thousands, of years to adapt. That was the one thing we got wrong.

A couple of years ago, after explaining my continuing attempts to reach climate deniers, I asked Sidd what we could possibly do. His response was essentially, “Dude, just tell them to look out their window.” It sounds simplistic, but there is profound truth in it. The consequences are becoming increasingly difficult to deny.

Since then, we’ve had to rebuild much of our modeling. A +4°C world within thousands of years is no longer the worst-case scenario we worry about. The possibility of 4–7°C of warming within a century has become a much more serious concern in our work.

And then there is the political dimension. The rise of white-nationalist and authoritarian governments in the U.S. and elsewhere has made an already difficult problem considerably harder. Paradoxically, though, history offers one small reason for hope: fascism ultimately fails. It is inherently self-destructive.

The “drill, baby, drill” mentality is economically and environmentally self-defeating. A severe economic contraction could, ironically, buy humanity some time for adaptation while drastically reducing emissions. That is hardly the future anyone should want, but history has repeatedly demonstrated that systems built on extremism and authoritarianism eventually consume themselves.

So yes—we desperately need both the Churchill and Gandhi dimensions: the willingness to confront reality without flinching, and the willingness to keep reaching for people rather than giving up on them. I’m just not sure humanity has ever faced a crisis where we needed both quite this badly.

bookmark_borderGlobal Real Estate Climate Risk: A Multiplicative Vulnerability Ranking

by Daniel Brouse and Sidd Mukherjee

The Multiplicative Climate Risk Formula

The Multiplicative Climate Risk Formula is a real-estate climate-risk model designed to capture how multiple hazards and vulnerabilities can interact and compound rather than occur independently. The framework incorporates interconnected risks including sea-level rise, storm surge, extreme precipitation, flooding, hydroclimatic whiplash, wildfires, drought, extreme heat, hurricanes, landslides, avalanches, and other cascading hazards.

Rather than treating each hazard as an isolated threat, the model evaluates how hazard exposure, hazard coupling, structural vulnerability, insurance stress, and recovery deficits can multiply overall real-estate risk.

The central premise is simple:

Climate risk is not merely additive. When multiple vulnerabilities interact, their combined impact can be substantially greater than the sum of their individual effects.

Applying the Multiplicative Climate Risk Formula on a global scale reveals that the greatest real-estate vulnerabilities are concentrated in major metropolitan and economic hubs where intense physical hazards intersect with structural fragility, insurance stress, and limited recovery capacity.

Unlike conventional hazard rankings, this framework recognizes that climate risk is not additive. A region can have relatively resilient buildings yet remain highly exposed because of insurance stress, infrastructure dependence, or coupled hazards. Conversely, a region with extreme physical exposure can rank lower when strong building standards, financial capacity, and rapid recovery systems substantially reduce vulnerability.

The global ranking applies the framework using a 1–5 scale, where 1 = Low and 5 = Extreme:

Hazard Exposure × Hazard Coupling × Vulnerability × Insurance Stress × Recovery Deficit = Multiplicative Real Estate Climate Risk

The resulting score is a comparative risk factor rather than a probability of loss or a forecast of future property values.


1. Manila & Central Luzon, Philippines

Hazard Exposure (5): Exceptional exposure to multiple severe Pacific typhoons, coastal storm surge, extreme rainfall, river flooding, and sea-level rise.

Hazard Coupling (5): Storm surge can coincide with torrential rainfall and river flooding, trapping inland water and producing prolonged flooding across low-lying urban districts.

Vulnerability (4): High population density, uneven construction quality, aging structures, and extensive informal development increase exposure to severe wind and flood damage.

Insurance Stress (3): Commercial insurance is more accessible for premium assets than for much of the broader property market, leaving substantial portions of residential and lower-value real estate underinsured.

Recovery Deficit (5): Severe recovery constraints can arise from infrastructure damage, disrupted electrical systems, engineering shortages, and delays in mobilizing reconstruction resources.

Total Multiplicative Risk: 5 × 5 × 4 × 3 × 5 = 1,500


2. Dhaka, Bangladesh

Hazard Exposure (4): Extreme exposure to tropical cyclones, riverine flooding, intense rainfall, extreme heat, and broader regional water stress.

Hazard Coupling (5): Extreme heat, heavy precipitation, drainage limitations, river flooding, and rapidly expanding urbanization can interact to amplify infrastructure and property losses.

Vulnerability (5): Large concentrations of densely developed, lower-quality and non-engineered structures create substantial exposure to flooding, subsidence, and extreme weather.

Insurance Stress (3): Formal property insurance penetration remains limited, leaving many losses concentrated on property owners and investors rather than broadly distributed through insurance markets.

Recovery Deficit (5): Limited fiscal capacity, infrastructure constraints, and dependence on external recovery financing can substantially extend post-disaster reconstruction.

Total Multiplicative Risk: 4 × 5 × 5 × 3 × 5 = 1,500


3. Greater Jakarta Area (Jabodetabek), Indonesia

Hazard Exposure (4): Severe exposure to chronic land subsidence, monsoonal flooding, extreme rainfall, coastal inundation, and sea-level rise.

Hazard Coupling (5): Land subsidence increases the effective impact of rising seas and high tides, while intense rainfall can overwhelm drainage systems and compound coastal flooding.

Vulnerability (4): Dense development, vulnerable transportation and utility infrastructure, and extensive below-grade systems increase exposure to flood-related disruption.

Insurance Stress (4): High climate-related losses and growing flood exposure can increase underwriting pressure, exclusions, deductibles, and affordability challenges.

Recovery Deficit (4): Major infrastructure investments are underway, but the scale of the metropolitan region and continuing subsidence create substantial long-term recovery and adaptation requirements.

Total Multiplicative Risk: 4 × 5 × 4 × 4 × 4 = 1,280


4. Mumbai Metropolitan Region, India

Hazard Exposure (4): High exposure to intense monsoon rainfall, coastal flooding, tropical cyclones, sea-level rise, and extreme heat.

Hazard Coupling (5): Extreme rainfall interacting with dense urbanization, inadequate drainage, coastal flooding, and heat stress can produce cascading infrastructure and real-estate disruption.

Vulnerability (4): Rapid development, extensive reclaimed land, aging buildings, and high-density urbanization increase exposure to flooding, structural deterioration, and infrastructure failure.

Insurance Stress (3): Climate-risk insurance penetration remains uneven, while rising exposure to flood and heat losses places increasing pressure on commercial and residential property coverage.

Recovery Deficit (4): Aging drainage systems, infrastructure deficits, population density, and high emergency-service demands can prolong recovery following major events.

Total Multiplicative Risk: 4 × 5 × 4 × 3 × 4 = 960


5. Miami & Southeast Florida, United States

Hazard Exposure (5): Exceptional exposure to major Atlantic hurricanes, storm surge, sea-level rise, tidal flooding, and recurrent coastal inundation.

Hazard Coupling (4): Storm surge, rainfall, rising seas, groundwater interactions, and porous limestone geology can combine to produce flooding beyond areas directly affected by rainfall.

Vulnerability (3): Modern buildings benefit from increasingly stringent wind standards, but extensive older and mid-tier residential and commercial properties remain vulnerable to wind, flood, and water intrusion.

Insurance Stress (5): Extreme insurance stress is driven by carrier withdrawals, rising premiums, higher deductibles, reinsurance costs, and growing exposure to catastrophic losses.

Recovery Deficit (3): High private wealth, federal disaster resources, and substantial construction capacity support recovery, although repeated disasters can strain public infrastructure and municipal finances.

Total Multiplicative Risk: 5 × 4 × 3 × 5 × 3 = 900


6. Ho Chi Minh City & Mekong Delta, Vietnam

Hazard Exposure (4): High exposure to chronic flooding, tropical storms, sea-level rise, extreme rainfall, and land subsidence.

Hazard Coupling (4): Tidal intrusion, river flooding, subsidence, upstream water management, and intense rainfall can combine to produce prolonged inundation.

Vulnerability (4): Large concentrations of low-rise residential, industrial, and manufacturing properties remain exposed to flooding and often lack comprehensive floodproofing or elevated mechanical systems.

Insurance Stress (3): Industrial assets may have access to international insurance capacity, but climate-risk pricing and coverage remain uneven across the broader real-estate market.

Recovery Deficit (4): Infrastructure investment continues to expand, but rapid urban and industrial growth can outpace drainage, flood-control, and adaptation capacity.

Total Multiplicative Risk: 4 × 4 × 4 × 3 × 4 = 768


7. Houston & Southeast Texas Gulf, United States

Hazard Exposure (4): High exposure to extreme rainfall, hurricanes, storm surge, coastal flooding, and occasional severe winter weather.

Hazard Coupling (4): Intense rainfall interacting with extensive impervious urban surfaces, bayous, drainage limitations, and coastal water levels can generate widespread property inundation.

Vulnerability (3): Large concentrations of slab-on-grade development and extensive construction across flood-prone areas increase exposure to flooding and infrastructure disruption.

Insurance Stress (4): Rising catastrophe losses, increasing deductibles, and elevated wind, hail, and flood costs place substantial financial risk on property owners.

Recovery Deficit (3): Strong corporate and regional financial capacity supports recovery, but large-scale flood-control, grid, and infrastructure projects can require years to complete.

Total Multiplicative Risk: 4 × 4 × 3 × 4 × 3 = 576


8. Tokyo-Yokohama Metropolitan Area, Japan

Hazard Exposure (5): Exceptional exposure to typhoons, storm surge, extreme rainfall, coastal flooding, and major seismic hazards.

Hazard Coupling (5): Typhoon rainfall can saturate soils and simultaneously trigger landslides, flooding, drainage failures, and infrastructure disruptions.

Vulnerability (2): Strong seismic engineering, rigorous building standards, sophisticated infrastructure, and extensive disaster-preparedness systems substantially reduce structural vulnerability.

Insurance Stress (5): Despite strong domestic resilience, the concentration of enormous asset values and catastrophe exposure creates substantial insurance and reinsurance accumulation risk.

Recovery Deficit (2): Strong national institutions, advanced emergency logistics, substantial financial capacity, and sophisticated construction and engineering systems support comparatively rapid recovery.

Total Multiplicative Risk: 5 × 5 × 2 × 5 × 2 = 500


9. Pearl River Delta — Hong Kong, Shenzhen & Guangzhou, China

Hazard Exposure (5): Exceptional exposure to typhoons, extreme precipitation, coastal flooding, sea-level rise, and heat.

Hazard Coupling (4): Extreme rainfall, storm surge, drainage constraints, underground infrastructure, and disruptions to industrial power and supply chains can interact to create cascading losses.

Vulnerability (2): Modern high-rise construction, extensive engineered infrastructure, and substantial flood and coastal defenses reduce the probability of widespread structural failure.

Insurance Stress (4): The extraordinary concentration of commercial and industrial assets creates significant aggregate-loss exposure for insurers and reinsurers during major catastrophes.

Recovery Deficit (2): Strong governmental capacity, extensive infrastructure, rapid mobilization, and substantial financial resources support comparatively rapid physical recovery.

Total Multiplicative Risk: 5 × 4 × 2 × 4 × 2 = 320


10. London & Thames Estuary, United Kingdom

Hazard Exposure (3): Moderate exposure to storm surge, coastal and river flooding, winter storms, extreme rainfall, and increasing heat stress.

Hazard Coupling (4): Sea-level rise increases pressure on tidal defenses, while a major surge combined with heavy rainfall could disrupt transportation, underground infrastructure, and commercial districts simultaneously.

Vulnerability (3): Extensive historic building stock, aging infrastructure, subsidence-sensitive soils, and limited cooling capacity increase exposure to certain climate hazards.

Insurance Stress (3): Insurance remains broadly accessible, but increasing exposure to flooding, heat, subsidence, and other climate-related losses may increase premiums and underwriting constraints.

Recovery Deficit (2): Strong institutions, substantial fiscal capacity, sophisticated infrastructure, and extensive engineering resources provide significant recovery advantages.

Total Multiplicative Risk: 3 × 4 × 3 × 3 × 2 = 216


Global Climate Risk Index Matrix

Because the framework is multiplicative rather than additive, high structural vulnerability and limited recovery capacity can propel a region above a wealthier, more technologically advanced city even when the latter faces greater absolute exposure to extreme weather.

RankGlobal RegionHazard ExposureHazard CouplingVulnerabilityInsurance StressRecovery DeficitMultiplicative Risk
1Manila & Central Luzon, Philippines554351,500
2Dhaka, Bangladesh455351,500
3Greater Jakarta, Indonesia454441,280
4Mumbai, India45434960
5Miami & Southeast Florida, USA54353900
6Ho Chi Minh City & Mekong Delta, Vietnam44434768
7Houston & Southeast Texas Gulf, USA44343576
8Tokyo-Yokohama, Japan55252500
9Pearl River Delta, China54242320
10London & Thames Estuary, UK34332216

What the Multiplicative Model Reveals

The ranking produces an important result: the most dangerous real-estate markets are not necessarily those with the most extreme individual hazards.

The multiplicative structure rewards resilience and penalizes systemic weakness. A highly exposed city with strong building standards, deep financial reserves, robust infrastructure, and rapid recovery capacity can therefore rank below a less technologically advanced city where multiple vulnerabilities interact.

This is the central insight of the model:

Climate risk is not simply where hazards are strongest. It is where hazards, vulnerability, insurance stress, and recovery deficits compound.

The greatest real-estate risks emerge when physical climate exposure becomes financially and institutionally amplified—turning a weather event into a prolonged property, insurance, infrastructure, and investment crisis.

bookmark_borderAmerica’s New Tariff Landscape: Who Gets Taxed—and Who Really Pays?

Introduction

The latest U.S. tariff framework is now in place, and while tariffs are collected at the border, it’s American families who ultimately pay most of the bill.

📊 Highlights:
• Average household: +$2,000–$2,700 per year
• Buying a new home and a new car? The added cost from tariffs on steel, aluminum, lumber, vehicles, appliances, and other goods could exceed $30,000–$50,000.
• New tariffs now cover nearly 99.4% of U.S. imports from 60 trading partners, while additional 50% tariffs on many Canadian products are scheduled to begin in August.

The article explains what changed, which goods are affected, who legally pays the tariff, and who ultimately bears the economic burden.

Read the full analysis and decide for yourself: Are tariffs protecting American industry, or are they becoming one of the largest hidden taxes on American consumers?

1. Newly Enacted Tariffs: Section 301 Forced Labor Framework

Effective July 24, 2026, the United States implemented a new tariff regime targeting imports from approximately 60 trading partners, representing 99.4% of all U.S. imports. The tariffs are based on supply-chain forced labor investigations.

Tariff Rates

  • 10% Base Rate
    • Canada
    • Mexico
    • United Kingdom
    • India
    • Argentina
  • 10%–12.5% Blended Rate
    • European Union
    • Japan
    • South Korea
    • Taiwan
  • 12.5% Flat Rate
    • China
    • Vietnam
    • Australia
    • Singapore
    • 34 additional economies under investigation

Exemptions

Several strategically important commodities remain exempt, including:

  • Crude oil
  • Natural gas
  • Fertilizer
  • Selected primary food products

These tariffs also do not stack with existing Section 232 national security duties.


2. Upcoming Canadian Tariffs: Section 338

Beginning August 19, 2026, the United States is scheduled to impose 50% retaliatory tariffs on approximately $20 billion of Canadian imports under Section 338 of the Tariff Act of 1930.

Products Subject to the 50% Tariff

  • Dairy products
  • Wine and other alcoholic beverages
  • Automobiles
  • Auto parts
  • Cement
  • Hockey equipment
  • Plywood
  • Particleboard
  • Paper products
  • Clothing
  • Furniture

These tariffs bypass normal CUSMA (USMCA) preferential treatment.

Exemptions

The following Canadian exports are excluded:

  • Energy products
  • Potash
  • Fish
  • Critical minerals

3. Existing Tariffs That Remain in Effect

Several major tariff programs adopted during 2025 and 2026 continue unchanged.

Section 232 National Security Tariffs

These duties continue to apply to steel and aluminum imports, including tariffs reaching 50% on certain Canadian steel and aluminum products.

Existing Canadian Import Tariffs

Additional tariffs remain in place on:

  • 25% on non-CUSMA-compliant auto parts
  • 25% on upholstered furniture and kitchen cabinets
  • 10% tariff on Canadian softwood lumber, with combined anti-dumping and countervailing duties pushing the effective rate to approximately 45%

Section 301 China Tariffs

Long-standing tariffs on Chinese imports also remain active, with rates reaching 25% on numerous products, including:

  • Industrial machinery
  • Technology equipment
  • Electronic components
  • Strategic manufacturing inputs

Current U.S. Tariff Framework

Tariff ProgramPrimary TargetRateStatus
Section 301 – Forced Labor60 trading partners10%–12.5%Active (July 24, 2026)
Section 338 – CanadaAutos, dairy, wine, cement, consumer goods50%Begins August 19, 2026
Section 232 – National SecuritySteel & aluminum25%–50%Active
Section 301 – ChinaIndustrial & technology productsUp to 25%Active

Who Really Pays Tariffs?

Legally, tariffs are paid by the U.S. importer when goods enter the country through Customs and Border Protection.

Economically, however, that is only the beginning of the story.

Importers generally recover those additional costs by increasing the prices they charge wholesalers, retailers, manufacturers, and ultimately consumers. Numerous economic studies of recent U.S. tariffs have found that most of the cost is passed through to American businesses and households rather than absorbed by foreign exporters.

In some industries, foreign suppliers may reduce prices to remain competitive, meaning they share part of the burden. But the overall trade data and pricing evidence show that the majority of tariff costs are ultimately borne within the United States through higher prices, reduced business margins, or both.

In other words, while tariffs are collected at the border from importers, they function much like a domestic consumption tax. The final bill is usually paid by American businesses and consumers—not by foreign governments.

Conclusion

For the average American household, the new tariff regime is expected to increase costs by approximately $2,000–$2,700 per year. For families purchasing a newly built home and a new vehicle, the cumulative tariff burden can easily exceed $30,000–$50,000 through higher prices on construction materials, automobiles, appliances, and other imported goods. While tariffs are collected at the border from importers, they are ultimately borne by American businesses and consumers in the form of higher prices—a tax paid not to foreign governments, but by U.S. households.

bookmark_borderAccounting for Climate Responsibility

by Daniel Brouse

Comparing Two Approaches to Measuring Humanity’s Climate Footprint

Climate responsibility depends on how emissions are assigned. Traditional territorial accounting attributes emissions to the country where they occur, but globalization has made that approach increasingly incomplete. Modern supply chains, international trade, and service-based economies often separate where emissions are produced from who ultimately benefits from them.

To explore this problem from two different perspectives, I developed two complementary accounting frameworks.

The first paper, The True Climate Footprint: Measuring Per Capita Total Contribution Beyond Territorial Emissions, introduces the Per Capita Total Contribution (PCTC) framework. PCTC seeks to estimate an individual’s or nation’s complete climate responsibility by incorporating not only consumption, but also several major sources of emissions that are frequently omitted from conventional carbon accounting.

The True Climate Footprint: Measuring Per Capita Total Contribution

The PCTC framework includes:

  • Consumption-based emissions
  • Land-use change and deforestation
  • Upstream fossil fuel extraction (methane leakage, flaring, and coal mine emissions)
  • International aviation and maritime shipping
  • All major greenhouse gases (CO₂, CH₄, N₂O, and others expressed as CO₂-equivalent)
  • Responsibility associated with fossil fuel production where appropriate

The second paper, The Carbon We Own: Why Consumption Matters More, examines climate responsibility from a different perspective. Rather than estimating total climate contribution, it focuses specifically on the carbon footprint required to support modern lifestyles using a consumption-based accounting approach.

The Carbon We Own: Why Consumption Matters More

This framework emphasizes:

  • Multi-Regional Input-Output (MRIO) accounting
  • Direct household energy use
  • Embedded emissions in imported goods
  • Public and private services
  • Lifestyle and purchasing choices

Unlike PCTC, this framework intentionally places less emphasis on fossil fuel extraction and producer responsibility in order to better isolate the climate impacts associated with everyday consumption.

After completing the first paper, I wanted to examine the climate footprint from the perspective of the consumer rather than the entire climate system. The PCTC framework provides a comprehensive measure of total responsibility, but it does not distinguish as clearly between emissions driven by individual lifestyle choices and those associated with resource extraction or national production.

A consumption-based framework highlights decisions that individuals and societies can influence more directly. Choices such as lowering a home’s thermostat, improving insulation, selecting public transportation or electric vehicles instead of internal combustion vehicles, reducing air travel, or purchasing fewer carbon-intensive goods become more visible within the accounting. It also better captures the increasingly important role of service-based economies. While services may appear less energy-intensive than manufacturing, sectors such as healthcare, finance, telecommunications, cloud computing, and artificial intelligence rely on extensive digital infrastructure—including energy-hungry data centers—that can be substantially underrepresented in traditional emissions inventories.

Finally, I wanted a more detailed comparison among developed economies, particularly within Europe. Countries such as Norway and France illustrate why accounting methodology matters. Norway has one of the world’s cleanest domestic electricity systems, powered primarily by hydropower, yet it is also a major exporter of oil and natural gas. France, by contrast, derives much of its electricity from nuclear power, resulting in comparatively low-carbon domestic energy while maintaining a high standard of living. Comparing these countries under both frameworks reveals how different accounting methods assign responsibility and helps illustrate the strengths and limitations of each approach.

Taken together, these two papers do not compete—they answer different questions. Per Capita Total Contribution (PCTC) asks, What is humanity’s full climate responsibility? Consumption-based accounting asks, What emissions are required to sustain the lifestyle of the average resident? Used together, they provide a more complete understanding of climate responsibility than either framework alone.

Conclusion

Although The True Climate Footprint and The Carbon We Own both seek to improve upon traditional territorial emissions accounting, they answer different questions because they are built on different accounting frameworks.

The True Climate Footprint uses the Per Capita Total Contribution (PCTC) framework to estimate an individual’s or nation’s complete contribution to climate change. It extends beyond consumption to include land-use change, upstream fossil fuel extraction, international shipping and aviation, and the full spectrum of greenhouse gases. In some cases, it also attributes responsibility associated with fossil-fuel production, providing a broad measure of humanity’s total climate impact.

By contrast, The Carbon We Own focuses specifically on consumption-based climate responsibility. Using Multi-Regional Input-Output (MRIO) accounting, it assigns emissions to the final consumer by emphasizing direct household energy use, embedded emissions in imported goods, services, and lifestyle choices. It intentionally deemphasizes extraction and producer responsibility in order to better represent the carbon footprint required to sustain modern patterns of consumption.

Because these frameworks measure different aspects of climate responsibility, their rankings are not expected to be identical.

Mexico provides a useful illustration. Under the PCTC framework, Mexico’s estimated footprint includes domestic industry, fossil fuel production, growing consumption, and upstream emissions, resulting in an estimated contribution of approximately 4–6 tonnes of CO₂-equivalent per person per year. In the consumption-based analysis, however, Mexico does not appear among the highest-ranking countries because the focus is limited to end-user consumption, and the published rankings emphasize the world’s largest per-capita consumption footprints.

Similar differences appear elsewhere. Norway’s position changes substantially because one framework incorporates the climate responsibility associated with fossil fuel production, while the other emphasizes domestic consumption. France benefits in the consumption-based analysis because its low-carbon nuclear electricity reduces household emissions despite maintaining a high standard of living. Saudi Arabia ranks differently depending on whether responsibility is assigned to oil production or to energy consumption. Singapore rises dramatically under consumption accounting because imported goods, international aviation, finance, logistics, and digital infrastructure contribute heavily to its consumption footprint despite relatively limited domestic manufacturing.

These examples demonstrate that accounting methodology influences how climate responsibility is distributed. Production-based, consumption-based, and total-contribution frameworks each illuminate different dimensions of the global climate system.

Rather than viewing these approaches as competing methodologies, they should be regarded as complementary analytical tools. The Per Capita Total Contribution (PCTC) framework asks, What is a nation’s or individual’s total contribution to climate change? The consumption-based framework asks, What emissions are required to sustain the average resident’s lifestyle? Together, they provide a more complete understanding of climate responsibility than either approach can achieve alone, revealing both the systemic impacts of resource production and the powerful role of consumer demand in shaping the global climate.

bookmark_borderThe Carbon We Own: Why Consumption Matters More

by Daniel Brouse

For decades, climate responsibility has often been measured by where fossil fuels are extracted or where products are manufactured. While useful for tracking national emissions, this production-based approach can misrepresent who ultimately drives demand.

A consumption-based accounting approach shifts the focus to the end user. Instead of assigning emissions to the country where a product is made, it attributes emissions to the people and businesses that ultimately consume the energy, goods, and services.

Under this framework, every kilowatt-hour of electricity, every heating bill, every medical service, and every consumer product is assigned to its final destination.

For example, if a smartphone is manufactured in Asia using electricity generated from coal and then shipped across the Pacific to a consumer in Los Angeles, the emissions associated with mining, manufacturing, transportation, and delivery are attributed to the American consumer—not the manufacturing country.

This approach provides a more accurate picture of the carbon footprint associated with modern lifestyles.


How Consumption-Based Carbon Accounting Works

Most consumption analyses rely on Multi-Regional Input-Output (MRIO) economic models, which trace emissions through global supply chains before assigning them to final consumers.

Individual carbon footprints are generally divided into three major categories:

1. Direct Household Energy

Emissions from energy used directly by households, including:

  • Home heating and cooling
  • Residential electricity
  • Personal vehicle fuel
  • Digital activities such as internet usage and streaming services

2. Embedded Goods

Emissions generated while producing and transporting purchased products, including:

  • Electronics
  • Vehicles
  • Furniture
  • Clothing
  • Building materials
  • Household appliances

These emissions often occur in countries far from the final consumer.

3. Services

Many of the largest emissions in developed economies come not from physical products but from services, including:

  • Healthcare
  • Commercial aviation
  • Banking and finance
  • Cloud computing
  • Water and wastewater treatment
  • Telecommunications

In the United States alone, healthcare contributes roughly 1.6 tonnes of CO₂-equivalent emissions per person each year, illustrating how service-based economies can generate substantial carbon footprints even as heavy industry declines.


Major Findings from Global Consumption Accounting

The Rise of Service Economies

In wealthy economies such as Singapore, Luxembourg, and several Western European countries, manufacturing represents only a small portion of domestic emissions.

Instead, much of their climate impact comes from:

  • Commercial aviation
  • Financial systems
  • Cloud computing
  • Global logistics
  • Luxury consumption
  • High levels of imported goods

As economies become increasingly service-oriented, carbon emissions become embedded in complex international supply chains rather than local smokestacks.


Geography Still Matters

Climate strongly influences direct household energy use.

Countries with long, cold winters or extremely hot summers require substantially more energy for climate control.

For example:

  • Canada and the United States consume large amounts of energy for winter heating and summer air conditioning, particularly because of larger average home sizes.
  • Australia records comparatively higher emissions from agriculture, mining, and infrastructure development than from residential heating.

Local climate remains an important contributor even after imported goods are included.


China’s Manufacturing Versus Consumption

China illustrates one of the largest differences between production-based and consumption-based accounting.

Because China manufactures enormous quantities of products for export, its territorial emissions are among the highest in the world.

However, when emissions are allocated to the people who ultimately purchase those products, China’s domestic per-capita consumption footprint is estimated at roughly 6.8 tonnes of CO₂-equivalent per year.

This highlights the distinction between:

  • Production emissions (where goods are made)
  • Consumption emissions (who ultimately benefits from those goods)

Many products manufactured in China are consumed in North America and Europe, meaning a significant share of manufacturing emissions is driven by foreign demand.


Consumption Footprints Across Europe

Norway: Clean Electricity, High Consumption

Estimated consumption footprint: 14.8 tonnes CO₂e per person

Norway’s electricity is more than 85% hydropower, giving it one of the cleanest electrical grids in the world.

Yet Norwegians have high purchasing power and consume large quantities of imported goods, including:

  • Electric vehicles
  • Consumer electronics
  • Luxury goods
  • Imported foods

Norway also has one of the world’s highest rates of air travel per capita, increasing its service-sector emissions.

The result is a consumption footprint considerably larger than its territorial emissions suggest.


United Kingdom: Outsourcing Manufacturing

Estimated consumption footprint: 11.2 tonnes CO₂e per person

The United Kingdom has significantly reduced domestic production emissions by retiring coal-fired power plants and expanding renewable electricity.

However, much of the country’s manufacturing has shifted overseas.

The UK imports large quantities of:

  • Electronics
  • Machinery
  • Clothing
  • Construction materials

Consequently, much of its carbon footprint exists outside its borders, while domestic emissions increasingly come from finance, digital infrastructure, commercial services, and transportation.


France: The Nuclear Advantage

Estimated consumption footprint: 9.2 tonnes CO₂e per person

France demonstrates how a low-carbon electricity system can substantially reduce consumption emissions.

French households enjoy living standards comparable to neighboring Western European countries, yet much of their residential electricity, rail transportation, and heating is supplied by nuclear energy.

As a result, France’s direct household energy emissions are estimated to be roughly 30% lower than those of many neighboring countries with similar consumption patterns.


China Compared with Western Europe

When emissions are assigned to consumers rather than producers, an average citizen in countries such as Germany or the United Kingdom is responsible for nearly twice the carbon footprint of the average Chinese citizen.

Although China’s middle class continues to grow and domestic consumption is increasing, much of the country’s industrial output still serves international markets.

This comparison illustrates a key insight of consumption-based accounting:

A nation’s production does not necessarily reflect the climate impact of its residents’ lifestyles.


A Different Way to Think About Climate Responsibility

Consumption-based accounting reframes climate responsibility by asking a simple question:

Who ultimately benefits from the energy and resources consumed?

Rather than focusing solely on where emissions occur, this approach follows products and services through global supply chains to their final users.

For affluent economies that import large volumes of manufactured goods while exporting much of their industrial production, consumption-based accounting often reveals substantially higher per-capita climate footprints than traditional territorial inventories.

Viewed through this lens, lifestyle choices, purchasing power, housing, transportation, travel, healthcare, digital services, and overall consumption patterns become the primary drivers of individual climate responsibility.

Ultimately, the atmosphere responds to total emissions, regardless of where they occur. Consumption-based accounting provides a complementary perspective to traditional production-based inventories by connecting those emissions to the people and economies whose demand created them.

Global Consumption Footprint Rankings

Traditional emissions inventories assign carbon pollution to the country where fossil fuels are extracted or products are manufactured. A consumption-based accounting approach instead assigns those emissions to the people and economies that ultimately consume the goods and services.

The rankings below are based on an End-User Consumption Model, which allocates the full upstream supply-chain emissions—including raw material extraction, manufacturing, international transportation, agricultural land-use change, and other embedded emissions—to the final purchaser.

Rather than measuring where emissions occur, this framework estimates the carbon footprint required to sustain the average lifestyle of a country’s residents. It reflects direct household energy use, consumption of imported goods, transportation, public infrastructure, and carbon-intensive services.

Estimated Global Consumption Footprint Ranking

RankCountry / RegionEstimated Full-Supply-Chain Consumption Footprint (tCO₂e/person/year)Primary Drivers
1🇸🇬 Singapore35.0–40.0+Heavy reliance on imported energy and food, international aviation, finance, and data infrastructure
2🇱🇺 Luxembourg30.0–36.0High disposable income, luxury consumption, financial services, cross-border transportation
3🇶🇦 Qatar28.0–34.0Air conditioning, desalination, imported consumer goods, infrastructure spending
4🇦🇪 United Arab Emirates25.0–32.0Extreme cooling demand, aviation, luxury imports
5🇺🇸 United States21.0–23.5Large homes, heating and cooling, automobile dependence, imported consumer goods
6🇨🇦 Canada19.5–22.0Cold climate, long transportation distances, high material consumption
7🇦🇺 Australia18.5–21.0Vehicle dependence, imported goods, fossil-fuel-intensive electricity
8🇳🇴 Norway14.0–16.0High purchasing power, imported manufactured goods, frequent air travel
9🇳🇱 Netherlands12.5–14.5Global logistics, natural gas use, high consumption
10🇩🇪 Germany12.0–13.5Industrial lifestyle, residential heating, imported products
11🇯🇵 Japan11.0–12.5Imported fuels, technology consumption, manufactured goods
12🇬🇧 United Kingdom10.5–12.0Outsourced manufacturing, service economy, imported consumer goods
13🇰🇷 South Korea10.0–11.5Electronics, vehicles, imported raw materials
14🇫🇷 France8.5–9.5Lower-carbon electricity from nuclear power offsets high consumption
15🇮🇹 Italy7.5–8.5Moderate consumption and relatively mild climate
16🇪🇸 Spain7.0–8.0Lower household consumption and reduced heating demand
17🇨🇳 China6.5–7.2Growing middle-class consumption balanced by lower rural consumption
18🇧🇷 Brazil4.5–5.5Agriculture, land-use change, domestic consumption
19🇮🇩 Indonesia3.0–4.5Expanding electricity use and infrastructure development
20🇮🇳 India2.0–2.5Low average household consumption and limited discretionary spending
21Sub-Saharan Africa (Average)<1.2Limited access to electricity, transportation, and manufactured goods

Key Patterns

Small, Wealthy Nations Have the Largest Per-Capita Footprints

Singapore and Luxembourg rank highest despite having relatively little domestic heavy industry. Their residents consume large quantities of imported goods and services, while extensive international transportation, finance, aviation, and digital infrastructure contribute substantial embedded emissions.

High-Income, Car-Oriented Economies Form the Next Tier

The United States, Canada, and Australia consistently rank among the world’s largest per-capita consumers. Large homes, automobile-dependent communities, extensive heating or cooling needs, and high levels of discretionary consumption combine to produce substantial lifestyle-related emissions.

Low-Carbon Electricity Helps—but Doesn’t Eliminate Consumption Emissions

Countries such as France and Norway demonstrate that cleaner electricity significantly lowers household energy emissions. However, imported goods, international travel, and service-sector activities remain important contributors to their overall consumption footprints.

Manufacturing Countries Are Not Necessarily the Largest Consumers

China’s production-based emissions are among the highest globally because it manufactures goods for international markets. Under a consumption-based framework, however, the average Chinese citizen’s lifestyle footprint remains considerably lower than that of residents in many affluent Western countries.

Consumption Capacity Is the Strongest Predictor

Perhaps the clearest finding is the enormous gap between affluent economies and developing regions. Average per-capita consumption in Sub-Saharan Africa remains a small fraction of that in the world’s wealthiest nations, reflecting differences in income, energy access, transportation, housing, and consumer purchasing power.

This comparison underscores a central conclusion of consumption-based accounting: the carbon footprint of an individual is driven primarily by the scale and complexity of the lifestyle they support, rather than the geographic location where the associated emissions physically occur.

bookmark_borderThe True Climate Footprint: Measuring Per Capita Total Contribution

by Daniel Brouse

Why Traditional Carbon Accounting Underestimates Responsibility

Climate responsibility is often measured using territorial emissions: the greenhouse gases released within a country’s borders. While useful, this approach does not capture the full climate footprint of modern economies because it ignores global supply chains, outsourced manufacturing, land-use change, and upstream fossil fuel emissions.

A more complete measure requires calculating Per Capita Total Contribution—a footprint-based accounting system that assigns responsibility based on the full lifecycle of consumption and environmental impact.

This approach combines:

  • Consumption-based emissions accounting — tracking emissions embedded in imported goods and services.
  • Land Use Change (LUC) — including deforestation, agricultural expansion, and ecosystem conversion.
  • Upstream fossil fuel emissions — including methane leaks, flaring, and coal mine emissions.
  • International transportation — including aviation and shipping.
  • All greenhouse gases — not just carbon dioxide, but methane, nitrous oxide, and other climate pollutants.

Using this broader framework, humanity’s total annual climate footprint rises to approximately 53.5 billion tonnes of CO₂-equivalent (CO₂e), or about 6.6 tonnes of CO₂e per person globally.

However, once these factors are included, the global map of climate responsibility changes dramatically.


1. The Hidden Carbon Footprint of Global Trade

Outsourced Emissions: When Consumption Drives Pollution Elsewhere

Traditional accounting assigns emissions to the country where goods are produced. This creates a major distortion in a globalized economy.

Consumption-based accounting reverses this by:

  • Subtracting emissions from exports.
  • Adding emissions embedded in imports.
  • Assigning responsibility to the final consumer.

This reveals a significant shift:

Western Consumption Footprints Expand

Many wealthy nations have reduced domestic industrial emissions partly by moving manufacturing overseas. Electronics, clothing, machinery, and other consumer products may be manufactured in China or Southeast Asia, but much of the demand originates in North America and Europe.

The emissions occur in the producing country, but the consumption benefit occurs elsewhere.

Carbon Exporters vs. Carbon Importers

Under territorial accounting:

  • Manufacturing nations appear more responsible.
  • Consumer nations appear cleaner.

Under footprint accounting:

  • Major consumer economies become large net importers of carbon emissions.
  • Manufacturing hubs become net exporters of embedded carbon.

2. The Missing Climate Cost of Land Use Change

Deforestation and land conversion contribute roughly 10% of global greenhouse gas emissions.

However, these emissions are rarely assigned to the ultimate consumers driving demand.

A complete accounting system tracks:

  • Beef production linked to Amazon clearing.
  • Soy expansion replacing forests.
  • Palm oil plantations.
  • Timber extraction.
  • Agricultural conversion.

Consumer-Driven Deforestation Footprints

Some nations experience a substantial increase in their climate footprint when imported commodities are included.

Examples:

  • Wealthy food-importing nations may carry a larger footprint because their consumption drives land clearing elsewhere.
  • Countries such as Brazil and Indonesia receive major additions from domestic land-use change before those emissions are redistributed through trade.

3. Fossil Fuel Extraction: Counting the Full Climate Cost

Burning fossil fuels is only part of their climate impact.

A complete footprint must include emissions from extraction:

  • Methane leakage from oil and gas production.
  • Coal mine methane releases.
  • Flaring.
  • Venting during production and transport.

Methane is especially important because it is approximately 30 times more powerful than carbon dioxide over a 100-year period.

Territorial accounting can distort responsibility:

  • Fossil fuel exporters may appear responsible for extraction emissions occurring within their borders.
  • Consumer nations benefit from the energy but avoid the associated extraction footprint.

A true accounting system assigns these emissions across the entire fossil fuel supply chain, including the countries ultimately consuming the energy.


The Recalculated Climate Responsibility Landscape

Country / RegionStandard Territorial CO₂ (Fossil Fuels Only)Estimated Total Contribution (All GHGs + Trade + Land Use + Transport)Primary Driver of Change
United States~14.9 tonnes/person~19.5–21.0 tonnes/personHigh consumption, imported manufacturing, carbon-intensive lifestyles
Western Europe~4.5–7.0 tonnes/person~8.5–11.5 tonnes/personOutsourced manufacturing and imported goods
China~8.0 tonnes/person~7.5–8.5 tonnes/personLarge manufacturing exporter offsets domestic emissions
Brazil~2.3 tonnes/person~6.0–7.5 tonnes/personDeforestation and agricultural land conversion
India~2.0 tonnes/person~2.2 tonnes/personLower consumption footprint
Sub-Saharan Africa<1.0 tonnes/person<1.2 tonnes/personLow consumption and limited industrial emissions

Global Climate Responsibility Ranking: Estimated Per Capita Total Contribution

RankCountry / RegionEstimated Total Contribution (Tonnes CO₂e/person/year)Major Drivers
1Qatar40–50+LNG exports, oil/gas production, extreme energy intensity, small population
2United Arab Emirates30–45Oil production, aviation, high consumption, energy-intensive economy
3Kuwait30–40Oil production, domestic energy use, high consumption
4Luxembourg25–35High consumption footprint, financial sector, imported goods, transport
5Australia23–27Coal/LNG extraction, fossil fuel exports, mining, livestock methane, high consumption
6Canada20–25Oil sands, natural gas, transportation, high consumption
7United States19.5–21Consumption footprint, imported manufacturing, transportation, energy use
8Saudi Arabia18–25Oil production, domestic energy consumption, industrial emissions
9Singapore18–23Industrial activity, shipping, refining, imported goods
10Western Europe (UK/Germany/Netherlands average)8.5–11.5Imported manufacturing, consumption emissions, transport
11New Zealand10–14Agricultural methane, dairy exports, livestock emissions
12South Korea10–13Industrial exports, manufacturing, imported energy
13Japan9–12Energy imports, manufacturing, consumption footprint
14Russia9–12Fossil fuel extraction, methane leaks, industrial emissions
15China7.5–8.5Manufacturing emissions offset by carbon exports through trade
16Brazil6–7.5Deforestation, agriculture, land-use change
17Mexico4–6Industry, fossil fuels, consumption growth
18Indonesia3.5–5.5Deforestation, coal, palm oil expansion
19India2–2.5Lower consumption, lower industrial footprint
20Sub-Saharan Africa (average)<1.2Low consumption, limited industrial emissions

The Real Climate Equation: Consumption × Population × Technology

The climate challenge is often framed as a population problem. However, the dominant driver of emissions is not simply the number of people on Earth—it is the per capita intensity of resource consumption and pollution.

A more accurate equation is:Total Climate Impact=Population×Per Capita Consumption×Carbon Intensity\textbf{Total Climate Impact} = \textbf{Population} \times \textbf{Per Capita Consumption} \times \textbf{Carbon Intensity}Total Climate Impact=Population×Per Capita Consumption×Carbon Intensity

Population matters, but consumption patterns and technology determine the magnitude of environmental impact.

A world with billions more people using efficient, low-carbon systems could have a smaller footprint than a smaller population consuming resources at current high-intensity levels.


Toward a Fairer Climate Accounting System

Territorial emissions remain useful for tracking national inventories, but they do not fully capture responsibility in a globalized economy.

A true Per Capita Total Contribution framework recognizes that climate change is driven by:

  • Who consumes resources.
  • Who benefits from production.
  • Who drives land conversion.
  • Who extracts and burns fossil fuels.
  • Who has the technological and economic capacity to reduce emissions.

The future of climate accountability depends on moving beyond borders and measuring the complete human footprint on Earth.


Conclusion

The climate conversation has focused on the wrong number.

The problem isn’t simply how many people live on Earth.

It’s how each of us lives.

The average person on the planet is responsible for about 6.6 tonnes of CO₂e per year, but the differences between countries are staggering. Some affluent societies generate 20–50+ tonnes per person, while much of the developing world contributes less than 2 tonnes.

That’s why climate responsibility is better measured by per capita total contribution—including consumption, outsourced manufacturing, deforestation, fossil fuel extraction, agriculture, and transportation—not just emissions produced within national borders.

A child born into a high-consumption lifestyle can have a climate footprint many times larger than several people living in low-consumption economies.

The challenge is not humanity itself.

The challenge is how we consume, how we produce, and how much we extract from the planet.

Changing lifestyles, improving efficiency, and transitioning to cleaner energy can reduce our impact without reducing our humanity.

The future depends less on the number of people—and more on the choices each of us makes.