bookmark_borderHow Is Climate Energy Hitting You? Sea Level vs. Private Property Rights

by Daniel Brouse

Simplified Introduction

How Is the Climate Energy Hitting You?
SoCal Coastal Armoring
Sea Level vs. Private Property Rights = Managed Retreat

🌊 Climate energy is hitting the coast.

When waves encounter a hard structure instead of dissipating their energy across a gradually sloping beach, some of that energy can be reflected back toward the ocean.

That can increase scour at the base of the structure and accelerate the loss of sand immediately in front of—and adjacent to—the armored shoreline.

A difficult feedback loop can develop:

Loss of sand → greater wave energy → erosion → emergency armoring → altered wave & sediment dynamics → further beach loss

The result is a fundamental conflict:

Protect individual properties — or preserve the beach as a public resource.

🌊 Climate Change Changes the Equation

This isn’t simply a dispute over seawalls.

It’s a preview of a much larger problem.

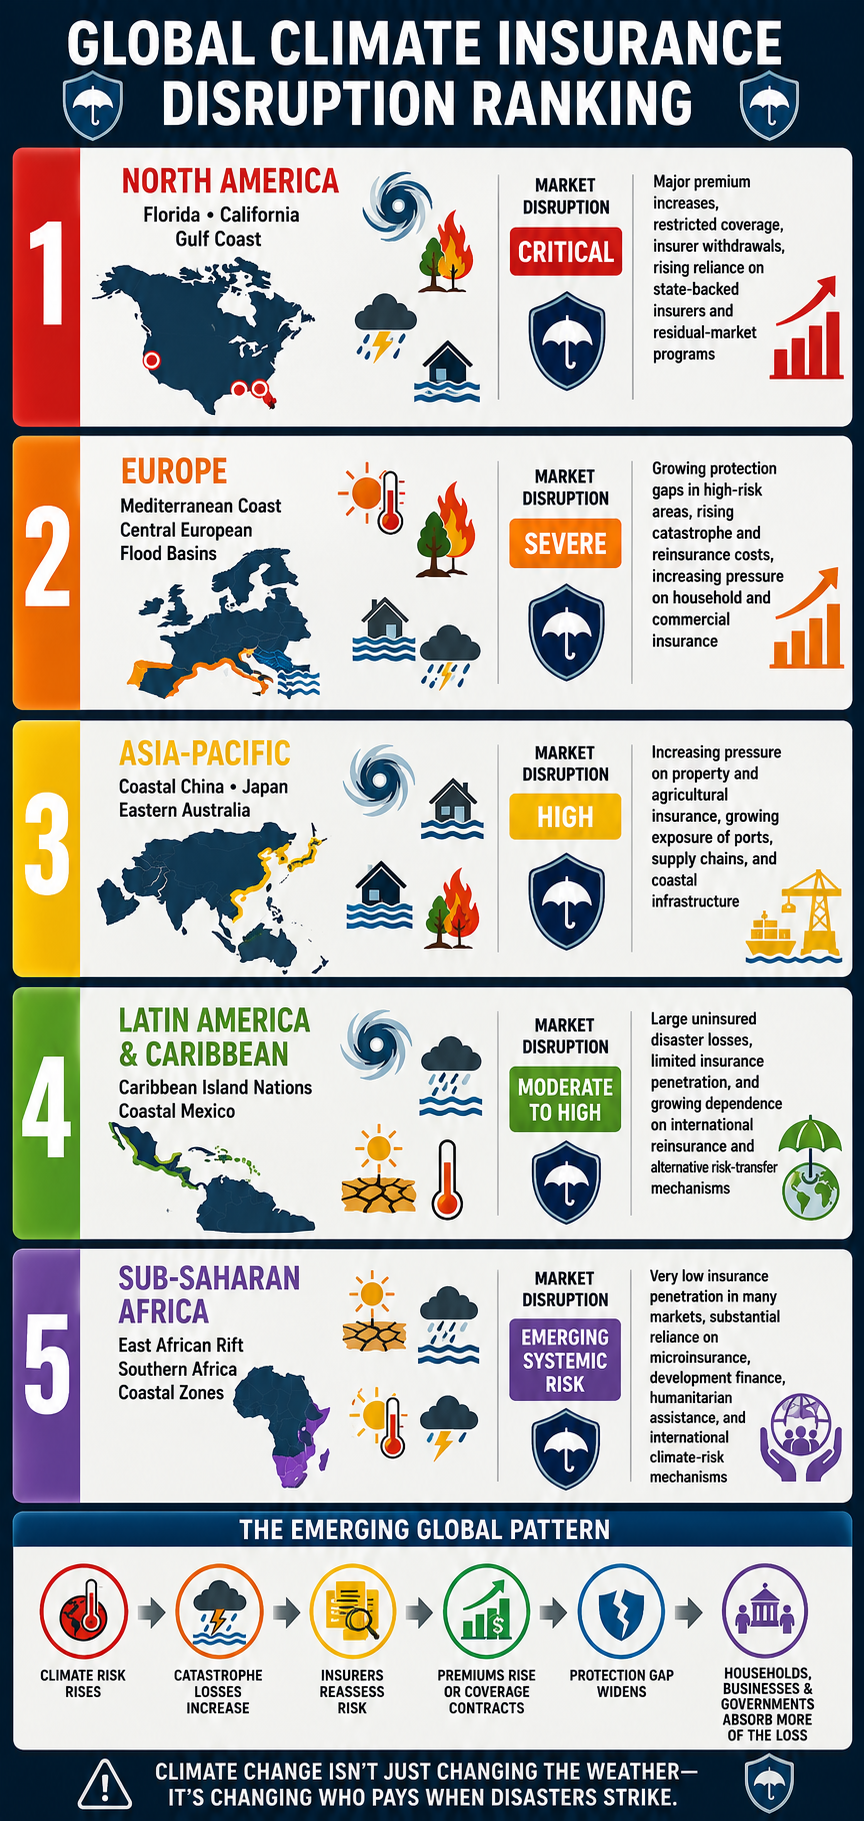
As sea levels rise, coastal storms and extreme-wave events interact with a progressively higher baseline ocean. More energy can reach vulnerable shorelines, while the loss of beaches and dunes removes natural buffers that once absorbed part of that energy.

The physical equation is changing.

🏖️ Managed Retreat

Managed retreat may ultimately become the long-term strategy for some coastal properties.

The fundamental physical reality is simple:

You can build a wall against the ocean.
You cannot build a wall against a changing climate.

The Beach Road conflict is therefore about much more than a temporary rock wall.

It is about what happens when accelerating climate change collides with private property rights, public resources, and the physical limits of coastal engineering.

The ocean doesn’t recognize property lines.

🌎 How Is the Climate Energy Hitting You?

Read the full report:

Sea Level vs. Private Property Rights

The Battle Over Coastal Armoring

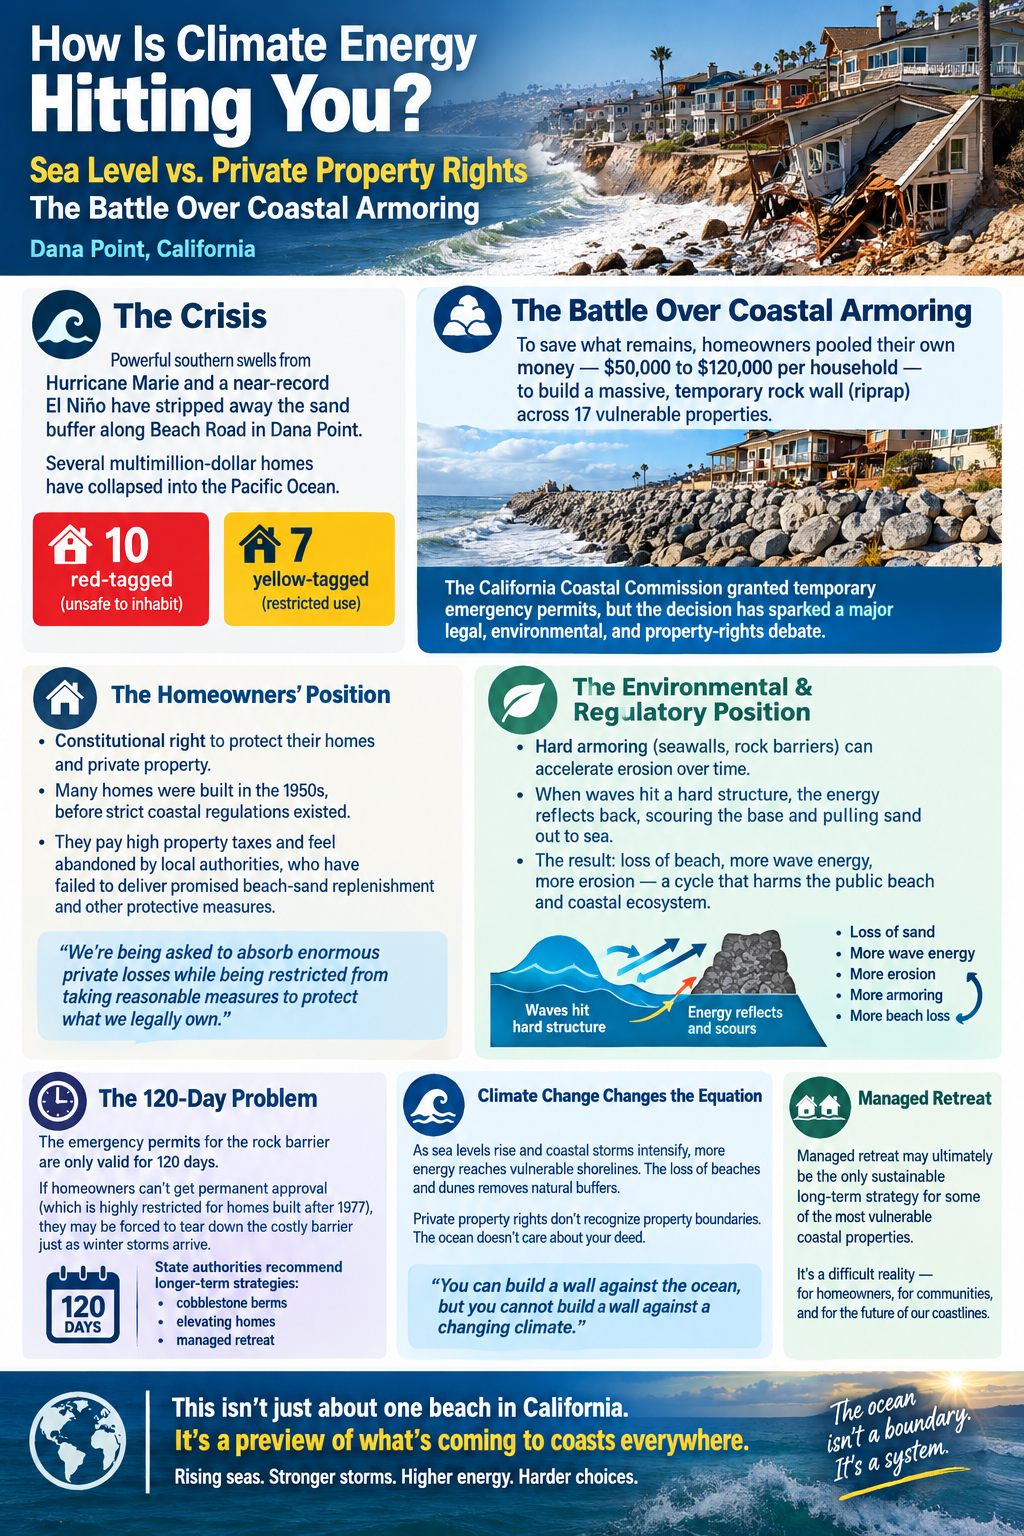
The situation along Beach Road in Dana Point, California, illustrates an increasingly difficult collision between rising sea levels, intensifying coastal hazards, private property rights, and the public’s right to California’s beaches.

Powerful southern swells associated with Hurricane Marie, combined with an anticipated record El Niño season, have stripped away much of the protective sand buffer along the shoreline. Several multimillion-dollar beachfront homes have been severely damaged, with some collapsing directly into the Pacific Ocean.

At least 10 beachfront homes have been red-tagged, meaning they have been declared unsafe to inhabit, while another seven have been yellow-tagged, restricting their use. Facing the loss of their homes and investments, residents have taken matters into their own hands.

The Battle Over Coastal Armoring

To protect what remains of their properties, a group of homeowners pooled their own money, contributing between $50,000 and $120,000 per household, to construct a massive temporary rock barrier, or riprap wall, extending across 17 vulnerable properties.

The California Coastal Commission granted temporary emergency permits for the barrier. But the decision has opened a much larger legal, environmental, and property-rights debate.

The Homeowners’ Position

The homeowners argue that they have a constitutional right to protect their homes and private property from destruction.

Many of the affected properties were built in the 1950s, long before today’s coastal development regulations were established. Residents point out that they pay substantial property taxes and argue that government agencies have failed to provide promised or expected beach-sand replenishment and other protective measures.

From their perspective, they are being asked to absorb enormous private losses while being restricted from taking reasonable measures to protect property they legally own.

The Environmental and Regulatory Position

The Coastal Commission and coastal scientists emphasize that hard coastal armoring—including seawalls, rock revetments, and similar structures—can alter natural coastal processes and contribute to beach erosion.

When waves encounter a hard structure rather than dissipating their energy across a gradually sloping beach, wave energy can be reflected back toward the ocean. This can increase scour at the base of the structure and accelerate the loss of sand immediately in front of and adjacent to the armored shoreline.

The result can become a difficult feedback loop:

Loss of sand → greater wave energy at the shoreline → erosion → emergency armoring → altered wave and sediment dynamics → further beach loss.

That creates a fundamental conflict between protecting individual properties and preserving the beach as a public resource.

The 120-Day Problem

The emergency permits for the rock barrier are temporary, lasting only 120 days.

If the homeowners cannot obtain permanent authorization—which is highly restricted for certain coastal properties, particularly homes constructed after 1977—they could ultimately be required to remove the expensive barrier.

That creates an extraordinary dilemma: homeowners may spend hundreds of thousands of dollars attempting to save their properties, only to face the possibility that the protective structure must be dismantled just as the most damaging winter storms arrive.

State authorities are instead encouraging communities to consider longer-term adaptation strategies, including cobblestone berms, elevating structures, and, where necessary, managed retreat.

Climate Change Changes the Equation

This conflict is not simply a dispute over seawalls.

It is a preview of a much larger problem.

As sea levels rise and coastal storms and extreme-wave events interact with a progressively higher baseline ocean, the amount of energy reaching vulnerable shorelines can increase. The loss of beaches and dunes removes natural buffers that once absorbed part of that energy.

That means yesterday’s shoreline protections may not be adequate for tomorrow’s climate.

The fundamental problem is that private property rights operate within a physical system that does not recognize property boundaries. The ocean does not distinguish between private property, public beaches, or political jurisdictions.

As climate change accelerates, coastal communities will increasingly have to confront the difficult question of where—and how—private property can realistically be protected.

Managed Retreat

Managed retreat may ultimately become the only sustainable long-term strategy for coastal properties.

A fundamental physical reality:

You can build a wall against the ocean, but you cannot build a wall against a changing climate.

The Beach Road conflict is therefore about much more than a temporary rock wall.

It is about what happens when accelerating climate change collides with private property rights, public resources, and the physical limits of coastal engineering.

bookmark_borderHow Is Climate Energy Hitting You? Nicolas Cage: Whole Sinkhole

by Daniel Brouse

Coastal Erosion, Property Loss & the Uninsurable Coast

Nicolas Cage: Whole Sinkhole

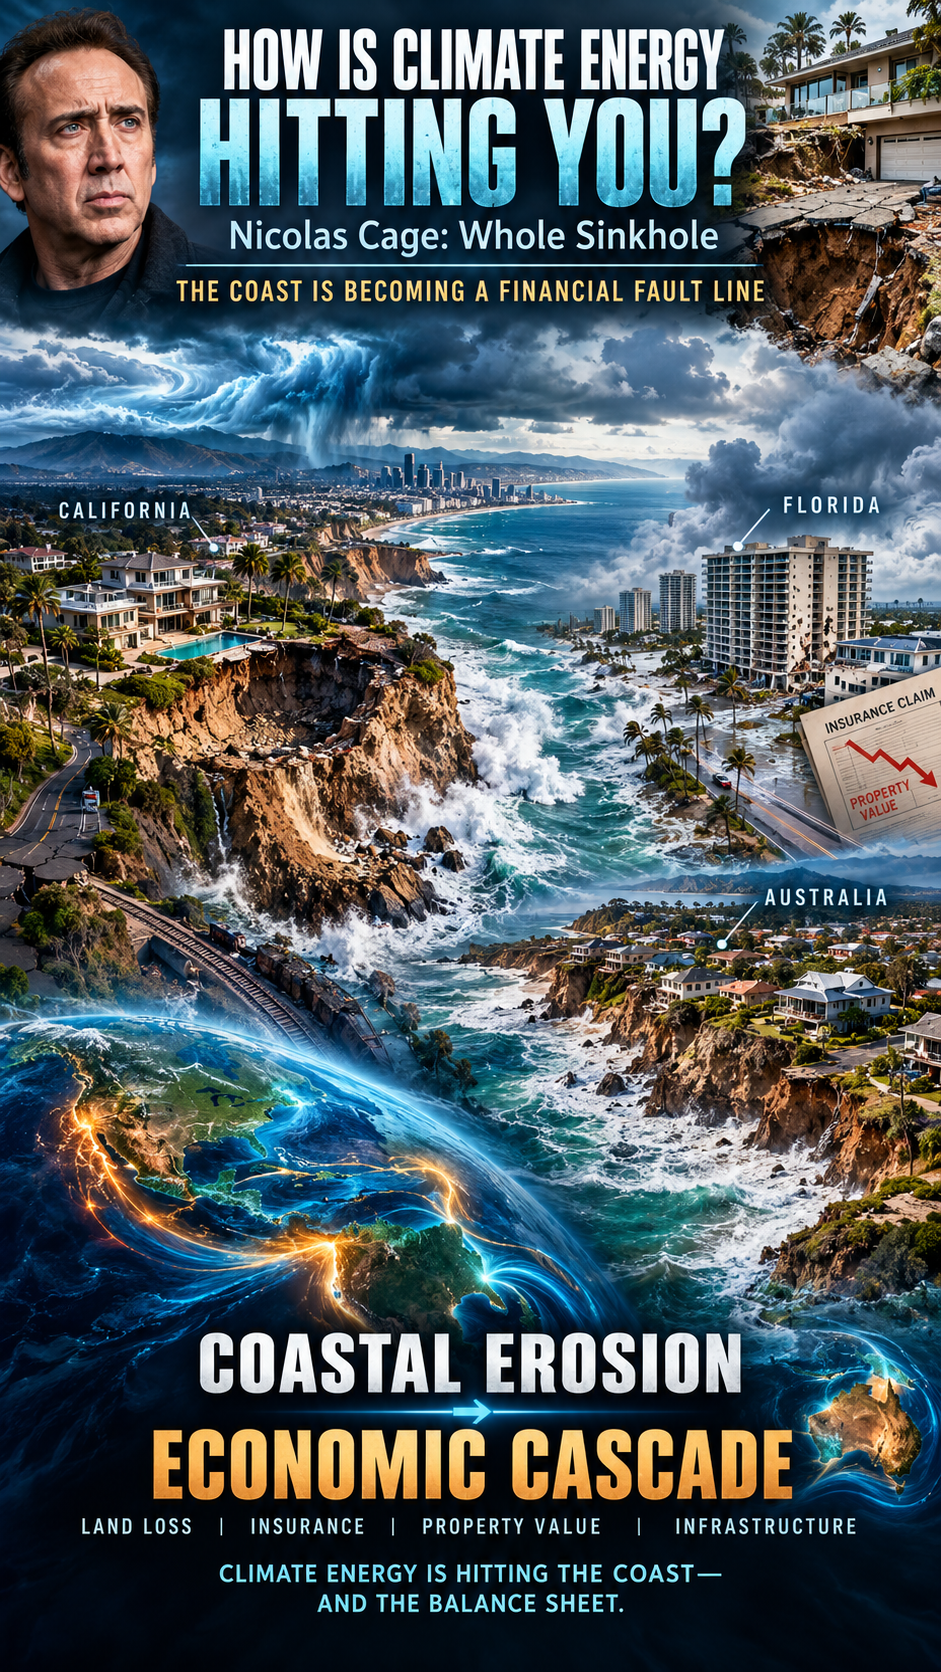
On September 8, 2026, severe coastal erosion and high surf triggered by the aftermath of Hurricane Marie caused the driveway of Nicolas Cage’s $10.5 million beachfront mansion to completely collapse.

The resulting crater expanded to roughly 30 by 60 feet and plunged about 25 feet deep, swallowing the driveway, a construction-site portable restroom, and heavy concrete debris.

Powerful south swells, extreme high tides, and pounding waves from Tropical Storm/Hurricane Marie ate away at the coastline directly beneath the property.

The collapse ruptured a gas main, forcing utility crews to shut off natural gas along the street. Because the ground remained highly unstable, city officials declared a local state of emergency and red-tagged or ordered evacuations for roughly 30 surrounding homes. Fortunately, the home was unoccupied at the time, and no injuries were reported.

California’s Coastal Erosion

Climate change and coastal erosion are fundamentally reshaping California’s 1,100-mile coastline. What was once considered a slow-moving, long-term environmental shift has accelerated into a series of highly disruptive events, resulting in collapsing bluffs, shrinking beaches, and massive infrastructure vulnerabilities.

The severe impacts California is facing are driven by a combination of rising sea levels and intensifying ocean patterns.

1. Vanishing Beaches and the “Coastal Squeeze”

California’s famous sandy beaches are facing an existential crisis. The U.S. Geological Survey (USGS) estimates that 24% to 75% of California’s beaches could completely erode by the year 2100.

The Squeeze: Normally, a beach would naturally migrate inland as sea levels rise. However, much of California’s coast is experiencing a “coastal squeeze”: beaches are trapped between the rising ocean and human-made infrastructure such as seawalls, highways, and residential developments, leaving the sand nowhere to go.

Artificial Interventions: According to recent USGS satellite data, some Southern California beaches have artificially expanded, but this is entirely due to expensive human interventions, such as dredging and “beach nourishment” projects, rather than natural coastal resilience.

2. Sea Cliff Failures and Deadly Landslides

Roughly 70% of California’s coast is comprised of oceanfront bluffs and cliffs.

Increased Wave Attack: As baseline sea levels rise, waves strike the base of these cliffs more frequently and with greater force. This severely degrades their structural stability, triggering sudden and unpredictable cliff collapses and landslides.

Human and Property Risk: Bluff failures have turned deadly for beachgoers in areas such as Encinitas and San Francisco. They also pose an immediate threat to multi-million-dollar cliffside homes and vital transportation routes.

3. The “Triple Threat” of El Niño and Severe Storms

While climate change is steadily raising the global baseline sea level, seasonal weather anomalies can trigger immediate emergencies. Geomorphologists at the Scripps Institution of Oceanography warn that El Niño conditions create a devastating “triple threat”:

Elevated Ocean Height: El Niño patterns can temporarily push local sea levels up by an additional 6 to 13 inches. Combined with pre-industrial sea-level rise, this radically amplifies the baseline ocean height.

Powerful Swells: Stronger storms and intense wave energy eat away at protective sand berms at an accelerated rate.

Heavy Rain: Atmospheric rivers saturate coastal land, triggering landslides from the top down while waves batter the cliffs from the bottom up.

The compound effect of these forces was highly visible during recent extreme-weather events, which caused widespread flooding in Long Beach and massive coastal sinkholes in Malibu. Every 2 to 4 inches of sea-level rise effectively doubles coastal flood risks.

4. Compounding Economic and Ecological Damages

Infrastructure at Risk: The state’s Legislative Analyst’s Office estimates that $8 billion to $10 billion worth of existing property could be entirely underwater within the next few decades, with billions more at risk during high tides. Critical lifelines—including the Pacific Coast Highway and coastal rail links such as the Amtrak lines connecting San Diego to Los Angeles—frequently face service suspensions because of ground instability.

Ecological Degradation: California has already lost more than 60% of its historical coastal sand dune systems to development and erosion. This destroys critical habitats for native birds and mammals while removing the coastline’s natural buffer against storm surges.

Water Supply Risks: Rising tides put freshwater aquifers at risk of saltwater intrusion. Increased saltwater contamination in the Sacramento-San Joaquin Delta threatens the drinking-water supply for millions of Californians as well as adjacent agricultural land.

California’s Adaptive Strategy

In response, California passed legislation such as Senate Bill 272, requiring all local governments within the coastal zone to establish comprehensive sea-level-rise plans by January 1, 2034. Communities are forced to choose between “hard armoring”—building massive rock revetments and groins to hold back the sea—and “managed retreat,” the highly controversial process of moving structures and infrastructure entirely inland.

Florida Coastal Erosion

Florida is facing a systemic coastal real-estate crisis in which climate-driven physical erosion has collided with aggressive new legal and financial mandates.

The state is experiencing severe physical land loss, but the downstream financial impact—specifically skyrocketing condo fees, massive special assessments, and a plunging condo market—is reshaping the state’s housing economy.

Part 1: How Coastal Erosion Is Impacting Florida

Florida features a low-lying, highly vulnerable topography. Rising sea levels and climate-fueled hurricanes are causing severe coastline degradation.

Critical Erosion: The Florida Department of Environmental Protection has designated a majority of Florida’s coastline as facing “critical erosion risk.” Beaches and barrier islands are shrinking, eliminating natural buffers that protect buildings from storm surges.

Foundation Undermining: Storm surges and intense wave action systematically wash away sand beneath seawalls and structural slabs. Saltwater intrusion aggressively corrodes the steel rebar inside concrete foundations and parking garages, severely compromising structural integrity over time.

Boundary Shrinkage: Coastal erosion is shrinking the physical legal boundaries of private properties. By 2050, over 140,000 Florida properties are expected to be significantly altered by land loss.

Part 2: The Condo Crisis — Fees & Special Assessments

Historically, beachfront condo associations kept their Homeowners Association (HOA) fees artificially low by voting to “waive” reserve funding for long-term maintenance. The tragic 2021 collapse of Champlain Towers South in Surfside permanently ended this practice.

Following the disaster, Florida passed strict safety laws, including SB 4-D and subsequent updates such as HB 913, creating a financial perfect storm:

Mandatory Milestone Inspections: All buildings three stories or taller that reached 30 years of age—or 25 years if within three miles of the coast—were required to complete rigorous structural inspections. These inspections uncovered decades of hidden saltwater corrosion, concrete spalling, and foundation rot.

Structural Integrity Reserve Studies (SIRS): Associations must perform a SIRS to calculate the remaining lifespan of critical components such as roofs, foundations, and load-bearing walls.

The Ban on Waiving Reserves: Associations are strictly prohibited from waiving or underfunding reserves for structural items. They must collect the required cash.

The Financial Fallout

Six-Figure Special Assessments: Because buildings deferred maintenance for decades, unit owners are being hit with mandatory, one-time special assessments ranging from $50,000 to more than $400,000 per unit to pay for multi-million-dollar structural repairs.

Skyrocketing Monthly Fees: Regular monthly HOA fees have surged—sometimes by 20% to 50% in a single year—to cover ongoing reserve requirements and exploding commercial-property insurance premiums.

Surging Insurance Costs: Driven by storm damage and climate risk, many major private insurers have pulled out of Florida entirely. Condo buildings are forced onto high-cost, bare-minimum state-backed policies, adding thousands of dollars annually to an individual unit owner’s bottom line.

Part 3: Devastation of Real Estate Values

The financial strain of these assessments and fees has broken the economics of Florida condo ownership, resulting in a dramatic price correction along the coast.

The Mass Sell-Off: Fixed-income retirees and middle-class owners cannot afford a sudden $100,000 assessment or a doubling of their monthly dues. This has caused a massive influx of inventory as desperate owners try to unload their units before deadlines hit.

Evaporating Buyer Demand: Disclosures showing thousands of non-compliant buildings, paired with high risk, have terrified buyers. Buyers refuse to inherit pending six-figure structural repair bills, causing sales velocity to freeze.

Deep Price Disruption: According to market trackers, this massive supply glut and lack of demand has led to steep price drops for coastal condos. In stark contrast to single-family homes, aging coastal condos are seeing values plummet by 20% to 40%.

Coastal Gentrification: The ultimate trajectory is severe economic displacement. As middle-class owners are forced out, developers and wealthy buyers are buying up entire distressed buildings at steep discounts, either to demolish them or completely rebuild luxury projects out of pocket.

Australia Coastal Erosion

Over 250,000 Australian homes are at risk of coastal erosion, according to the “Rising Seas, Rising Bills” report published by the Climate Council on September 10, 2026.

Drawing on groundbreaking climate modeling from the University of Melbourne and the Australian National University, the report highlights the severe threat that rising sea levels and storm surges pose to Australia’s massive coastal population.

1. The Real Estate and Financial Risk

Properties Threatened: The report explicitly warns that more than 267,000 coastal properties—roughly a quarter of a million homes—are at risk of severe inundation and erosion damage by 2100.

The $855 Billion Economic Bill: Total economic losses are projected to hit at least $855 billion AUD by the end of the century. This includes $274.3 billion AUD in direct property damage, alongside $580.7 billion AUD in damage to farmland, nature reserves, and critical public infrastructure.

The Timeline: While 2100 is the benchmark for the worst damages, researchers stress that the economic shock waves will start crippling coastal real estate as early as 2040.

2. State-by-State Breakdown: Where Is Most Exposed?

The damage is not distributed evenly, with specific regions carrying extreme structural and financial burdens:

Queensland — 93,157 properties at risk: The worst-affected state by property count. The Gold Coast alone is officially named Australia’s most exposed urban area, facing a staggering $84.4 billion AUD in projected economic losses on its own.

New South Wales — 71,210 properties at risk: Communities in Northern NSW and the Central Coast are projected to experience far higher property losses than Greater Sydney.

Western Australia — 51,366 properties at risk: While it has fewer homes at risk than Queensland or New South Wales, Western Australia faces the highest overall financial loss, at $230.5 billion AUD, due to vast tracts of highly valuable coastal agricultural land that will be permanently lost to sea-level rise.

Victoria: Property losses are heavily concentrated in low-lying, densely populated urban areas around Melbourne’s Port Phillip Bay and the Yarra River.

3. The Uninsurable “Actions of the Sea”

Much like the condo crisis unfolding in Florida, Australia is facing a severe insurance reckoning.

The Exclusion Clause: Most standard private insurers in Australia explicitly exclude coverage for “actions of the sea.” This means regular ocean tidal flooding, steady coastal erosion, and sea-level rise are completely uncovered.

The Cost Burden: When a storm surge destroys a foundation or a cliff collapses, property owners will largely be forced to bear the multi-million-dollar stabilization or relocation costs entirely on their own. Experts warn that this will trigger massive drops in property values and result in “uninsurable” coastal ghost zones.

The Coast Is Becoming a Financial Fault Line

From California to Florida to Australia, coastal erosion is no longer simply a problem of disappearing sand or retreating shorelines. It is becoming a cascading climate-energy problem that reaches directly into property values, insurance markets, infrastructure, ecosystems, and household finances.

The Nicolas Cage sinkhole provides a dramatic example of how quickly coastal instability can turn an expensive piece of real estate into a dangerous hole in the ground. California demonstrates the growing physical vulnerability of beaches, cliffs, transportation corridors, and freshwater resources. Florida shows how physical climate risks can cascade into insurance crises, special assessments, and collapsing real-estate economics. Australia demonstrates how the same process can scale into a national financial exposure measured in hundreds of billions of dollars.

The underlying lesson is straightforward: coastal climate risk does not stop at the water’s edge.

As sea levels rise and extreme coastal events intensify, the physical loss of land can propagate through the economic system. Erosion undermines structures. Structural damage increases repair costs. Repair costs increase insurance premiums and assessments. Insurance becomes unavailable or unaffordable. Properties lose value. Buyers disappear. Communities face declining tax bases and increasingly expensive infrastructure protection.

What begins as coastal erosion can therefore become a cascading economic feedback.

Climate energy is hitting the coast—and increasingly, it is hitting the balance sheet.

bookmark_borderScience Is Science: Confronting Denialism and Ecofascism

About Denialism and Ecofascism: Science Is Science

The Observation
Glad to know you’re watching out! At the same time, this divisiveness—when we desperately need everyone to pull together because it’s a CRISIS, right?—makes me somehow deeply sad.

That’s a big job right there… How do we reach those who seem furthest away from any kind of understanding? We need both a Winston Churchill and a Mahatma Gandhi in this endeavor…

The Response
Agreed. Both denialism and ecofascism are ideologies that ultimately defy logic. In very different ways, they can become a kind of combination of self-destruction and destruction of others.

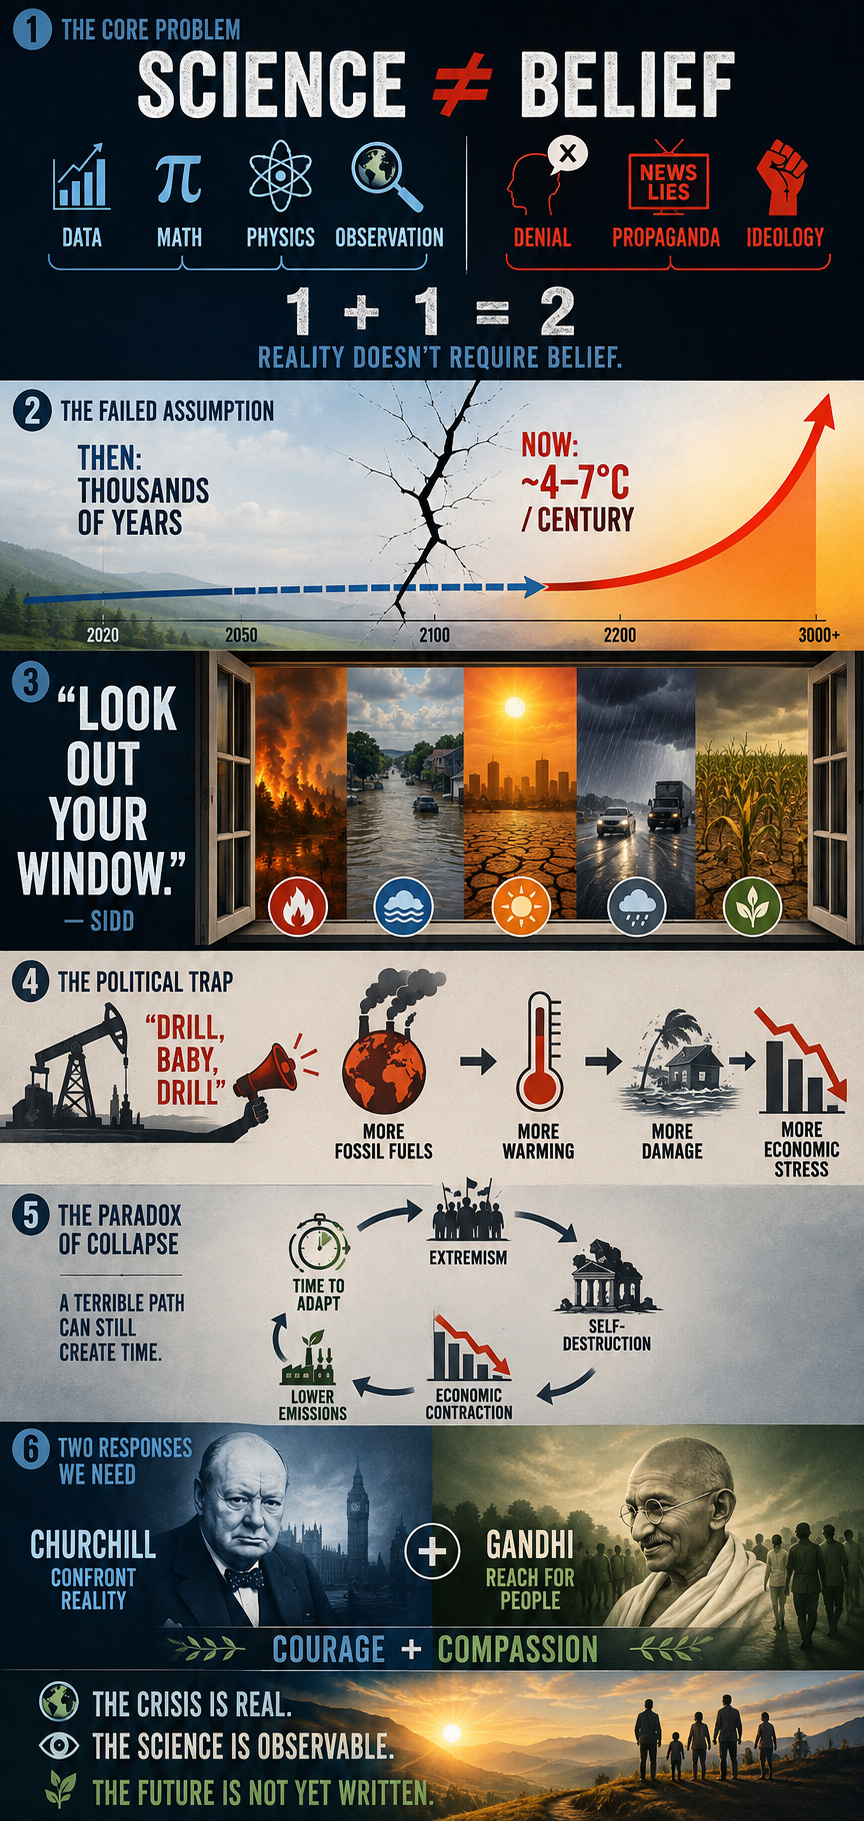
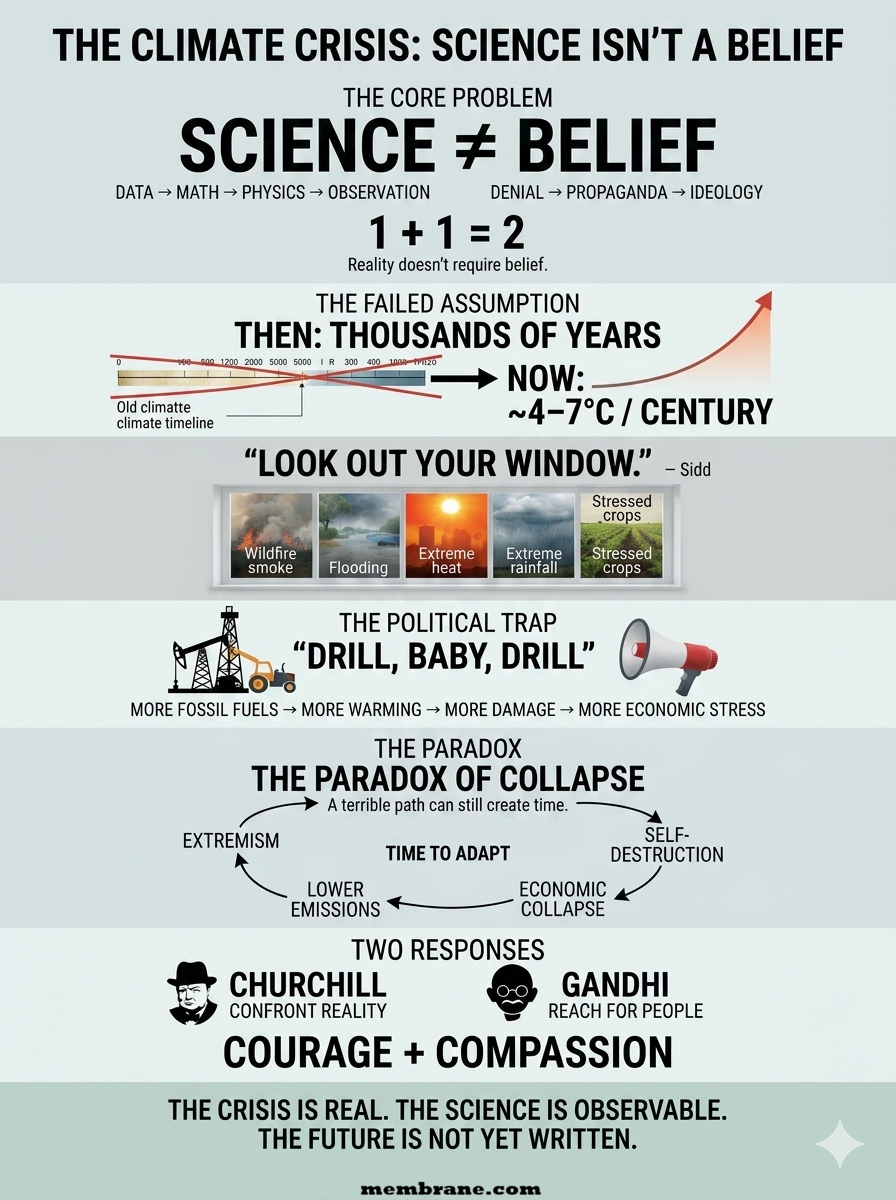
I’ve spent years battling misinformation, propaganda, and rhetoric. To the best of my knowledge, neither Sidd nor I have successfully converted—or even educated—a single committed denier. Climate science has somehow been transformed into a “belief” system. But science has nothing to do with belief. 1 + 1 = 2. If someone refuses to “believe” that, what exactly can you do?

From the beginning, our work has been based on observations, data, mathematics, and the laws of physics. So yes, I think this is at the heart of the crisis. When we started this work, we genuinely believed humanity would eventually take action. We thought we had thousands, if not tens of thousands, of years to adapt. That was the one thing we got wrong.

A couple of years ago, after explaining my continuing attempts to reach climate deniers, I asked Sidd what we could possibly do. His response was essentially, “Dude, just tell them to look out their window.” It sounds simplistic, but there is profound truth in it. The consequences are becoming increasingly difficult to deny.

Since then, we’ve had to rebuild much of our modeling. A +4°C world within thousands of years is no longer the worst-case scenario we worry about. The possibility of 4–7°C of warming within a century has become a much more serious concern in our work.

And then there is the political dimension. The rise of white-nationalist and authoritarian governments in the U.S. and elsewhere has made an already difficult problem considerably harder. Paradoxically, though, history offers one small reason for hope: fascism ultimately fails. It is inherently self-destructive.

The “drill, baby, drill” mentality is economically and environmentally self-defeating. A severe economic contraction could, ironically, buy humanity some time for adaptation while drastically reducing emissions. That is hardly the future anyone should want, but history has repeatedly demonstrated that systems built on extremism and authoritarianism eventually consume themselves.

So yes—we desperately need both the Churchill and Gandhi dimensions: the willingness to confront reality without flinching, and the willingness to keep reaching for people rather than giving up on them. I’m just not sure humanity has ever faced a crisis where we needed both quite this badly.

bookmark_borderReal Estate Climate Risk Models

by Daniel Brouse and Sidd Mukherjee

Background

Sidd said: “frightening article by Jeff Masters. We saw some of this coming, the flood risk aint just
along the coast, it extends 100 miles inland…
the water cant get out …”

https://yaleclimateconnections.org/2026/08/the-floods-of-the-future-wont-come-one-at-a-time/

In the 1990s, Sidd and I began developing real-estate-based climate risk models. From the beginning, one of the underlying high-risk factors was flooding—and, closely linked to it, the availability and affordability of flood insurance. In the early 2000s, we met with FEMA, Fannie Mae (FNMA), and Freddie Mac (FHLMC) to better understand their flood-risk modeling and emerging plans for managed retreat.

In October 2023, Sidd observed: “Now I am thinking the violent rain will be a bigger problem before we die.”

That concern has become increasingly relevant. As the Earth warms, warmer air can physically hold more water vapor than cooler air. For every 1°C (1.8°F) increase in temperature, the atmosphere can hold approximately 7% more moisture, increasing the potential for extreme precipitation. Over a 10°C increase, atmospheric moisture-holding capacity would nearly double, creating the potential for substantially more intense rainfall.

The problem, however, is not simply the amount of water falling from the sky. It is also what happens when that water moves across the landscape—and whether infrastructure and government response systems are capable of managing, containing, and recovering from the resulting flows.

Flow forces scale with the square of velocity (v²). As flow speeds increase—whether from heavier rainfall, steeper runoff, or more intense hydrological events—the destructive force of moving water rises rapidly. Density further magnifies this effect. Water is roughly 800 times denser than air, meaning that a comparable flow velocity can produce dramatically greater force.

Together, we developed a series of models incorporating the Clausius–Clapeyron relationship, the extreme energy transfer within the water cycle through latent heat, and fluid-flow dynamics. These models increasingly pointed toward a risk structure in which flooding could no longer be treated as an isolated coastal problem. Instead, precipitation intensity, runoff, topography, infrastructure vulnerability, insurance stress, and limited recovery capacity can interact and compound one another across much larger regions.

By 2026, the framework had evolved from a theoretical real-estate climate-risk model into a broader multiplicative risk framework that could be evaluated against observed real-world conditions.

The latest evolution of this work is presented in the following three papers:

bookmark_borderGlobal Real Estate Climate Risk: A Multiplicative Vulnerability Ranking

by Daniel Brouse and Sidd Mukherjee

The Multiplicative Climate Risk Formula

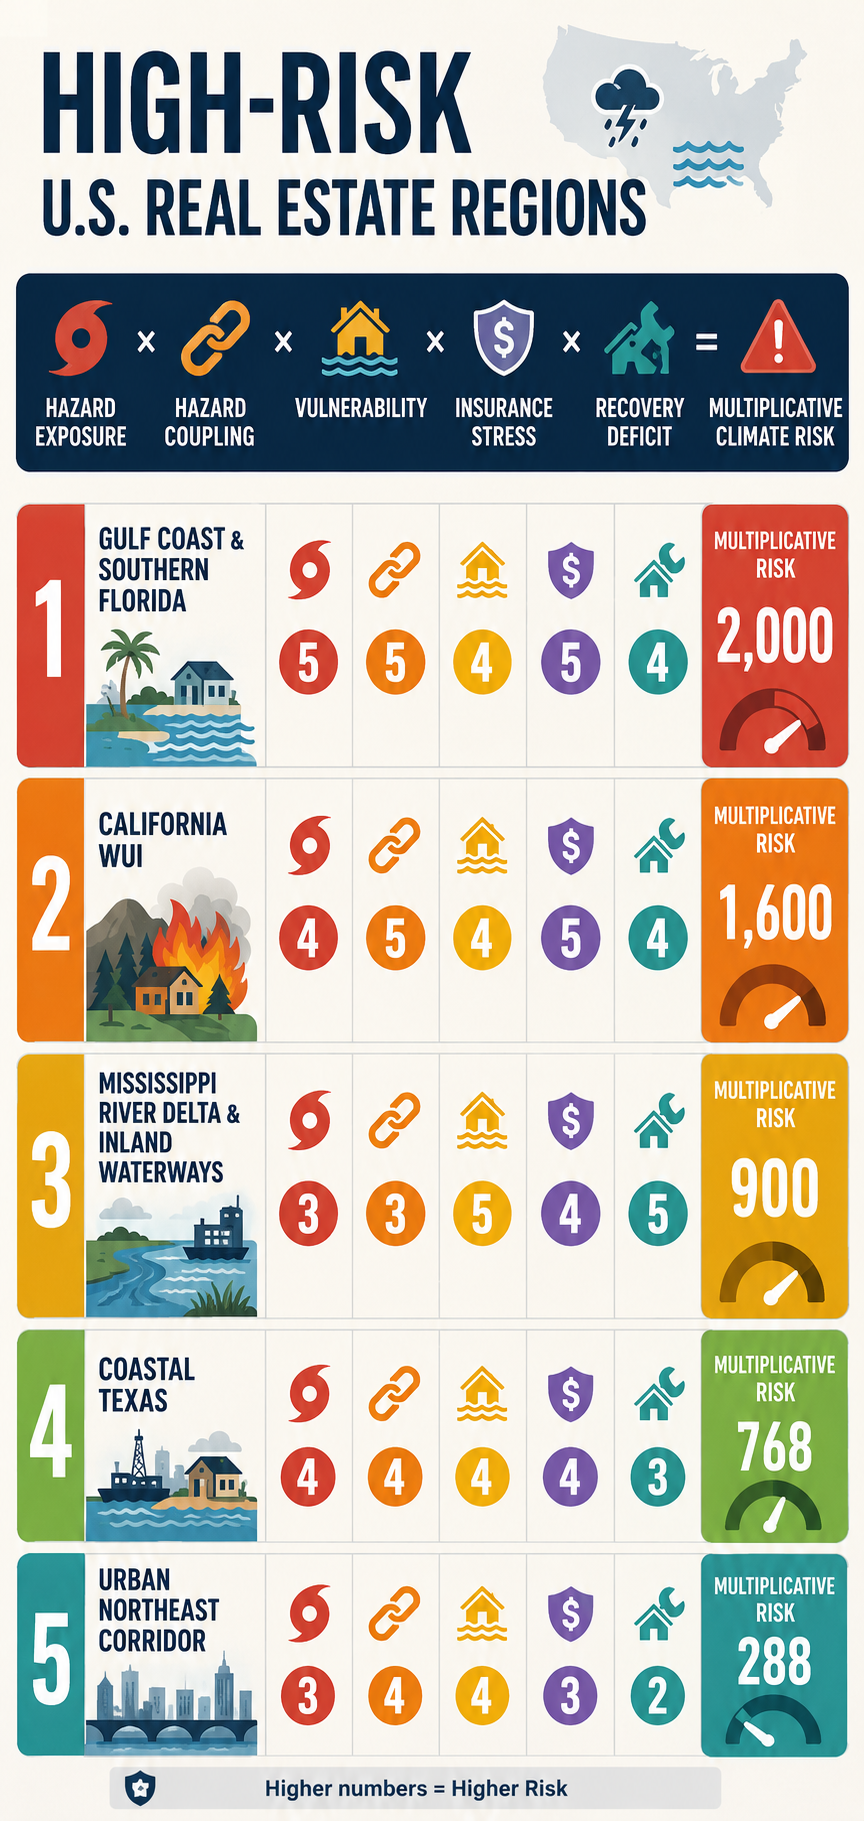
The Multiplicative Climate Risk Formula is a real-estate climate-risk model designed to capture how multiple hazards and vulnerabilities can interact and compound rather than occur independently. The framework incorporates interconnected risks including sea-level rise, storm surge, extreme precipitation, flooding, hydroclimatic whiplash, wildfires, drought, extreme heat, hurricanes, landslides, avalanches, and other cascading hazards.

Rather than treating each hazard as an isolated threat, the model evaluates how hazard exposure, hazard coupling, structural vulnerability, insurance stress, and recovery deficits can multiply overall real-estate risk.

The central premise is simple:

Climate risk is not merely additive. When multiple vulnerabilities interact, their combined impact can be substantially greater than the sum of their individual effects.

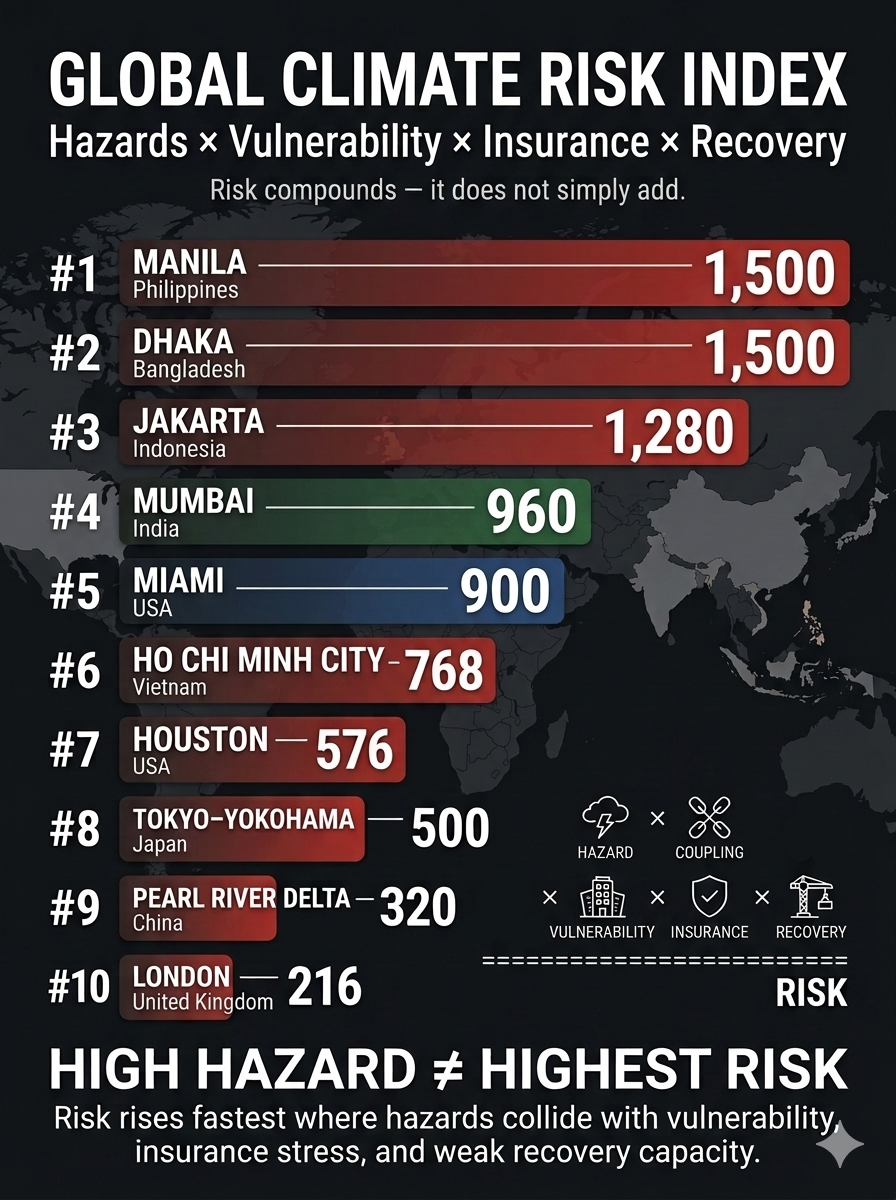
Applying the Multiplicative Climate Risk Formula on a global scale reveals that the greatest real-estate vulnerabilities are concentrated in major metropolitan and economic hubs where intense physical hazards intersect with structural fragility, insurance stress, and limited recovery capacity.

Unlike conventional hazard rankings, this framework recognizes that climate risk is not additive. A region can have relatively resilient buildings yet remain highly exposed because of insurance stress, infrastructure dependence, or coupled hazards. Conversely, a region with extreme physical exposure can rank lower when strong building standards, financial capacity, and rapid recovery systems substantially reduce vulnerability.

The global ranking applies the framework using a 1–5 scale, where 1 = Low and 5 = Extreme:

Hazard Exposure × Hazard Coupling × Vulnerability × Insurance Stress × Recovery Deficit = Multiplicative Real Estate Climate Risk

The resulting score is a comparative risk factor rather than a probability of loss or a forecast of future property values.


1. Manila & Central Luzon, Philippines

Hazard Exposure (5): Exceptional exposure to multiple severe Pacific typhoons, coastal storm surge, extreme rainfall, river flooding, and sea-level rise.

Hazard Coupling (5): Storm surge can coincide with torrential rainfall and river flooding, trapping inland water and producing prolonged flooding across low-lying urban districts.

Vulnerability (4): High population density, uneven construction quality, aging structures, and extensive informal development increase exposure to severe wind and flood damage.

Insurance Stress (3): Commercial insurance is more accessible for premium assets than for much of the broader property market, leaving substantial portions of residential and lower-value real estate underinsured.

Recovery Deficit (5): Severe recovery constraints can arise from infrastructure damage, disrupted electrical systems, engineering shortages, and delays in mobilizing reconstruction resources.

Total Multiplicative Risk: 5 × 5 × 4 × 3 × 5 = 1,500


2. Dhaka, Bangladesh

Hazard Exposure (4): Extreme exposure to tropical cyclones, riverine flooding, intense rainfall, extreme heat, and broader regional water stress.

Hazard Coupling (5): Extreme heat, heavy precipitation, drainage limitations, river flooding, and rapidly expanding urbanization can interact to amplify infrastructure and property losses.

Vulnerability (5): Large concentrations of densely developed, lower-quality and non-engineered structures create substantial exposure to flooding, subsidence, and extreme weather.

Insurance Stress (3): Formal property insurance penetration remains limited, leaving many losses concentrated on property owners and investors rather than broadly distributed through insurance markets.

Recovery Deficit (5): Limited fiscal capacity, infrastructure constraints, and dependence on external recovery financing can substantially extend post-disaster reconstruction.

Total Multiplicative Risk: 4 × 5 × 5 × 3 × 5 = 1,500


3. Greater Jakarta Area (Jabodetabek), Indonesia

Hazard Exposure (4): Severe exposure to chronic land subsidence, monsoonal flooding, extreme rainfall, coastal inundation, and sea-level rise.

Hazard Coupling (5): Land subsidence increases the effective impact of rising seas and high tides, while intense rainfall can overwhelm drainage systems and compound coastal flooding.

Vulnerability (4): Dense development, vulnerable transportation and utility infrastructure, and extensive below-grade systems increase exposure to flood-related disruption.

Insurance Stress (4): High climate-related losses and growing flood exposure can increase underwriting pressure, exclusions, deductibles, and affordability challenges.

Recovery Deficit (4): Major infrastructure investments are underway, but the scale of the metropolitan region and continuing subsidence create substantial long-term recovery and adaptation requirements.

Total Multiplicative Risk: 4 × 5 × 4 × 4 × 4 = 1,280


4. Mumbai Metropolitan Region, India

Hazard Exposure (4): High exposure to intense monsoon rainfall, coastal flooding, tropical cyclones, sea-level rise, and extreme heat.

Hazard Coupling (5): Extreme rainfall interacting with dense urbanization, inadequate drainage, coastal flooding, and heat stress can produce cascading infrastructure and real-estate disruption.

Vulnerability (4): Rapid development, extensive reclaimed land, aging buildings, and high-density urbanization increase exposure to flooding, structural deterioration, and infrastructure failure.

Insurance Stress (3): Climate-risk insurance penetration remains uneven, while rising exposure to flood and heat losses places increasing pressure on commercial and residential property coverage.

Recovery Deficit (4): Aging drainage systems, infrastructure deficits, population density, and high emergency-service demands can prolong recovery following major events.

Total Multiplicative Risk: 4 × 5 × 4 × 3 × 4 = 960


5. Miami & Southeast Florida, United States

Hazard Exposure (5): Exceptional exposure to major Atlantic hurricanes, storm surge, sea-level rise, tidal flooding, and recurrent coastal inundation.

Hazard Coupling (4): Storm surge, rainfall, rising seas, groundwater interactions, and porous limestone geology can combine to produce flooding beyond areas directly affected by rainfall.

Vulnerability (3): Modern buildings benefit from increasingly stringent wind standards, but extensive older and mid-tier residential and commercial properties remain vulnerable to wind, flood, and water intrusion.

Insurance Stress (5): Extreme insurance stress is driven by carrier withdrawals, rising premiums, higher deductibles, reinsurance costs, and growing exposure to catastrophic losses.

Recovery Deficit (3): High private wealth, federal disaster resources, and substantial construction capacity support recovery, although repeated disasters can strain public infrastructure and municipal finances.

Total Multiplicative Risk: 5 × 4 × 3 × 5 × 3 = 900


6. Ho Chi Minh City & Mekong Delta, Vietnam

Hazard Exposure (4): High exposure to chronic flooding, tropical storms, sea-level rise, extreme rainfall, and land subsidence.

Hazard Coupling (4): Tidal intrusion, river flooding, subsidence, upstream water management, and intense rainfall can combine to produce prolonged inundation.

Vulnerability (4): Large concentrations of low-rise residential, industrial, and manufacturing properties remain exposed to flooding and often lack comprehensive floodproofing or elevated mechanical systems.

Insurance Stress (3): Industrial assets may have access to international insurance capacity, but climate-risk pricing and coverage remain uneven across the broader real-estate market.

Recovery Deficit (4): Infrastructure investment continues to expand, but rapid urban and industrial growth can outpace drainage, flood-control, and adaptation capacity.

Total Multiplicative Risk: 4 × 4 × 4 × 3 × 4 = 768


7. Houston & Southeast Texas Gulf, United States

Hazard Exposure (4): High exposure to extreme rainfall, hurricanes, storm surge, coastal flooding, and occasional severe winter weather.

Hazard Coupling (4): Intense rainfall interacting with extensive impervious urban surfaces, bayous, drainage limitations, and coastal water levels can generate widespread property inundation.

Vulnerability (3): Large concentrations of slab-on-grade development and extensive construction across flood-prone areas increase exposure to flooding and infrastructure disruption.

Insurance Stress (4): Rising catastrophe losses, increasing deductibles, and elevated wind, hail, and flood costs place substantial financial risk on property owners.

Recovery Deficit (3): Strong corporate and regional financial capacity supports recovery, but large-scale flood-control, grid, and infrastructure projects can require years to complete.

Total Multiplicative Risk: 4 × 4 × 3 × 4 × 3 = 576


8. Tokyo-Yokohama Metropolitan Area, Japan

Hazard Exposure (5): Exceptional exposure to typhoons, storm surge, extreme rainfall, coastal flooding, and major seismic hazards.

Hazard Coupling (5): Typhoon rainfall can saturate soils and simultaneously trigger landslides, flooding, drainage failures, and infrastructure disruptions.

Vulnerability (2): Strong seismic engineering, rigorous building standards, sophisticated infrastructure, and extensive disaster-preparedness systems substantially reduce structural vulnerability.

Insurance Stress (5): Despite strong domestic resilience, the concentration of enormous asset values and catastrophe exposure creates substantial insurance and reinsurance accumulation risk.

Recovery Deficit (2): Strong national institutions, advanced emergency logistics, substantial financial capacity, and sophisticated construction and engineering systems support comparatively rapid recovery.

Total Multiplicative Risk: 5 × 5 × 2 × 5 × 2 = 500


9. Pearl River Delta — Hong Kong, Shenzhen & Guangzhou, China

Hazard Exposure (5): Exceptional exposure to typhoons, extreme precipitation, coastal flooding, sea-level rise, and heat.

Hazard Coupling (4): Extreme rainfall, storm surge, drainage constraints, underground infrastructure, and disruptions to industrial power and supply chains can interact to create cascading losses.

Vulnerability (2): Modern high-rise construction, extensive engineered infrastructure, and substantial flood and coastal defenses reduce the probability of widespread structural failure.

Insurance Stress (4): The extraordinary concentration of commercial and industrial assets creates significant aggregate-loss exposure for insurers and reinsurers during major catastrophes.

Recovery Deficit (2): Strong governmental capacity, extensive infrastructure, rapid mobilization, and substantial financial resources support comparatively rapid physical recovery.

Total Multiplicative Risk: 5 × 4 × 2 × 4 × 2 = 320


10. London & Thames Estuary, United Kingdom

Hazard Exposure (3): Moderate exposure to storm surge, coastal and river flooding, winter storms, extreme rainfall, and increasing heat stress.

Hazard Coupling (4): Sea-level rise increases pressure on tidal defenses, while a major surge combined with heavy rainfall could disrupt transportation, underground infrastructure, and commercial districts simultaneously.

Vulnerability (3): Extensive historic building stock, aging infrastructure, subsidence-sensitive soils, and limited cooling capacity increase exposure to certain climate hazards.

Insurance Stress (3): Insurance remains broadly accessible, but increasing exposure to flooding, heat, subsidence, and other climate-related losses may increase premiums and underwriting constraints.

Recovery Deficit (2): Strong institutions, substantial fiscal capacity, sophisticated infrastructure, and extensive engineering resources provide significant recovery advantages.

Total Multiplicative Risk: 3 × 4 × 3 × 3 × 2 = 216


Global Climate Risk Index Matrix

Because the framework is multiplicative rather than additive, high structural vulnerability and limited recovery capacity can propel a region above a wealthier, more technologically advanced city even when the latter faces greater absolute exposure to extreme weather.

RankGlobal RegionHazard ExposureHazard CouplingVulnerabilityInsurance StressRecovery DeficitMultiplicative Risk
1Manila & Central Luzon, Philippines554351,500
2Dhaka, Bangladesh455351,500
3Greater Jakarta, Indonesia454441,280
4Mumbai, India45434960
5Miami & Southeast Florida, USA54353900
6Ho Chi Minh City & Mekong Delta, Vietnam44434768
7Houston & Southeast Texas Gulf, USA44343576
8Tokyo-Yokohama, Japan55252500
9Pearl River Delta, China54242320
10London & Thames Estuary, UK34332216

What the Multiplicative Model Reveals

The ranking produces an important result: the most dangerous real-estate markets are not necessarily those with the most extreme individual hazards.

The multiplicative structure rewards resilience and penalizes systemic weakness. A highly exposed city with strong building standards, deep financial reserves, robust infrastructure, and rapid recovery capacity can therefore rank below a less technologically advanced city where multiple vulnerabilities interact.

This is the central insight of the model:

Climate risk is not simply where hazards are strongest. It is where hazards, vulnerability, insurance stress, and recovery deficits compound.

The greatest real-estate risks emerge when physical climate exposure becomes financially and institutionally amplified—turning a weather event into a prolonged property, insurance, infrastructure, and investment crisis.

bookmark_borderCoupled Climate Feedbacks and Cascading Real Estate Risk

by Daniel Brouse and Sidd Mukherjee

How Compound Flooding Is Reshaping Property Values, Insurance Availability, and Coastal Habitability

Climate change is creating a new class of real-estate risk in which the physical hazards of flooding increasingly interact with financial, insurance, infrastructure, and housing systems. Sea-level rise, heavier precipitation, and more intense or slower-moving hurricanes are not independent threats. They can interact to produce compound flooding, while the increasing frequency of damaging events can compress the time available for communities, property owners, insurers, and governments to recover.

The consequences extend far beyond the immediate cost of flood damage. As flood frequency increases, historical assumptions about property risk, insurance pricing, mortgage security, infrastructure design, and long-term property values become progressively less reliable. A property that was once considered a low-probability flood risk can become repeatedly exposed to flooding without the physical structure itself changing. As risk is repriced, insurance can become more expensive, less available, or unavailable altogether. Declining insurability can then reduce property values, constrain mortgage lending, discourage investment, weaken local tax bases, and reduce the resources available for infrastructure maintenance and adaptation.

This creates a coupled socioeconomic feedback loop:

Climate Warming → Hazard Intensification → Hazard Coupling → Compound Flooding → Damage and Losses → Insurance Stress → Property-Value Pressure → Reduced Investment → Infrastructure and Resilience Erosion → Greater Vulnerability → Greater Future Losses

A second feedback develops as recovery intervals contract:

Flood Frequency ↑ → Recovery Time Available ↓ → Unresolved Damage ↑ → Vulnerability ↑ → Subsequent Losses ↑

The resulting process is not simply an increase in flood risk. It is a potential transformation of real estate from a relatively stable store of household and institutional wealth into an increasingly climate-sensitive asset whose value, insurability, and financing depend upon the interaction of physical hazards and socioeconomic resilience.

The central argument of this paper is that real estate and insurance may become among the earliest and most visible indicators of cascading climate risk. When insurance becomes unaffordable or unavailable, property values weaken, lenders reassess collateral, investment retreats, and municipalities lose portions of their tax base, the effects of climate change have moved from the physical environment into the financial structure of communities.


1. Introduction: Climate Risk Is Becoming Real-Estate Risk

Climate change is often described in terms of rising temperatures, heavier rainfall, stronger storms, sea-level rise, and increasingly frequent flooding. Yet for households and communities, the most consequential effects may be transmitted through a different system:

Real Estate → Insurance → Mortgage Finance → Investment → Municipal Revenue → Infrastructure → Property Risk

A flood does not have to destroy a property to damage its economic value.

A property can lose value because:

  • flooding becomes more frequent;
  • flood insurance becomes more expensive;
  • insurance coverage becomes difficult to obtain;
  • insurers withdraw from the market;
  • lenders become more cautious;
  • infrastructure becomes less reliable;
  • buyers perceive increasing future risk;
  • investors demand higher returns for greater exposure;
  • municipal finances deteriorate;
  • repeated flooding reduces confidence in long-term habitability.

This changes the nature of climate risk.

The relevant question is no longer simply:

How much physical damage will the next flood cause?

It becomes:

What happens to the economic value and insurability of property when floods repeatedly occur before the community has fully recovered from previous events?

That is a fundamentally different risk problem.


2. Hurricane Harvey: The Beginning of the Feedback Chain

Hurricane Harvey provides a useful illustration of the physical mechanism underlying this emerging financial risk.

In August 2017, Harvey stalled over Texas and produced more than 40 inches of rainfall across a large area. At Nederland, Texas, 60.58 inches of rain was recorded, the largest single rainfall total associated with a tropical cyclone or its remnants in the United States. Damage was estimated at approximately $164 billion in 2026 dollars, with flooding responsible for most of the losses.

Harvey was also a compound-flood event.

Runoff from extreme rainfall moved toward the Gulf while storm surge pushed seawater inland. The elevated coastal water interfered with drainage, producing flooding through the interaction of rainfall runoff and storm surge.

The physical mechanism can therefore be expressed as:

Extreme Rainfall + Runoff + Storm Surge → Drainage Impairment → Compound Flooding

Climate change adds additional forcing:

Climate Warming → Heavier Rainfall + Higher Sea Level + More Intense/Slower Storms → Greater Compound Flood Risk

But the economic cascade begins after the water arrives:

Compound Flooding → Property Damage → Insurance Claims → Insurance Losses → Higher Insurance Costs and Reduced Availability

This is where physical climate risk begins to transform into financial risk.


3. The Three-Way Climate Pressure on Property

Three major mechanisms increasing compound flood risk along the U.S. Atlantic and Gulf coasts:

  1. More intense and slower-moving hurricanes
  2. Increased heavy precipitation as warmer air holds more water vapor
  3. Sea-level rise.

These mechanisms vary geographically.

Across the Gulf of Mexico and Florida, increased rainfall is projected to be the dominant driver in many locations. Across portions of the Southeast and Mid-Atlantic, changes in intense or slow-moving hurricanes become more important. Along the upper Mid-Atlantic and New England coasts, sea-level rise becomes increasingly dominant.

From a real-estate perspective, however, the distinction between the individual drivers may matter less than their combined effect.

The property does not experience three separate balance sheets.

It experiences one risk environment.

The resulting relationship is:

Sea-Level Rise + Extreme Rainfall + Storm Intensification → Compound Flood Risk → Property Risk

The financial system then responds:

Property Risk ↑ → Insurance Risk ↑ → Financing Risk ↑ → Property Value Pressure ↑

This is the beginning of the real-estate cascade.


4. Compound Flooding Creates Nonlinear Property Risk

The Harvey evidence demonstrates why conventional property-risk calculations can become inadequate.

A 2023 study found that approximately 19% of the flood area around Port Arthur, Texas, during Harvey resulted from compound flooding.

Under a scenario involving 0.57 meters of additional sea-level rise and 18% more rainfall, described as plausible around 2050, the compound-flooding area increased to 33%.

Under a scenario involving 1.6 meters of sea-level rise and 50% additional rainfall, described as plausible by 2100, compound flooding increased to 46%, while the number of structures affected was estimated to increase by approximately 23 times compared with 2017.

This is important for property markets because exposure can increase much faster than any single climate variable.

The relevant relationship is:

Climate Forcing ↑ → Hazard Interaction ↑ → Flood Exposure ↑↑ → Property Risk ↑↑

A property market that prices risk based primarily on historical flood frequency may therefore systematically underestimate future exposure.


5. The Return-Period Problem Becomes a Property-Valuation Problem

Real estate depends heavily on expectations about future risk.

A home buyer, mortgage lender, insurer, developer, or investor is effectively making a long-term assessment:

What is the probability that this property will suffer damaging losses during the period in which I own or finance it?

Historically rare floods can become much more frequent as the physical baseline changes.

Research found that human-driven sea-level rise has quadrupled the frequency of coastal sea-level extremes since 1900. At several locations, relative sea-level rise transformed a coastal flood that was a 100-year event in 1900 into an event occurring every five years or less frequently by 2005.

Recent examples illustrate the magnitude of this transformation.

A flood that historically occurred approximately once every ten years occurred:

Charleston → 17 times in 2025

Galveston → 9 times in 2024

Atlantic City → 10 times in 2024

Miami → 14 consecutive days in October 2025

Key West → 26 of 27 days in October 2025

For real estate, this represents a fundamental repricing problem.

A property does not need to be destroyed for its value proposition to change.

If the frequency of disruptive flooding changes from:

Rare → Occasional → Frequent → Persistent

then the economic characteristics of the property can change correspondingly.


6. The Insurance Market Is the First Financial Transmission Mechanism

Insurance is designed to transfer risk.

But insurance markets depend upon the ability to estimate and diversify that risk.

When climate change causes historical loss probabilities to change rapidly, insurers face a fundamental problem:

Historical Risk Models → Changing Climate Baseline → Increasing Loss Uncertainty

The response can take several forms:

Risk ↑ → Premiums ↑

Risk ↑ → Deductibles ↑

Risk ↑ → Coverage Restrictions ↑

Risk ↑ → Capacity ↓

Risk ↑ → Insurer Withdrawal ↑

For individual homeowners, the immediate consequence is affordability.

For the real-estate market, the deeper consequence is insurability.

Insurance availability is not simply another household expense.

It is part of the financial infrastructure supporting property ownership.


7. Insurance Availability Can Become a Property-Value Constraint

A property with affordable insurance can be financed, sold, and occupied relatively normally.

A property with extremely expensive insurance is economically less attractive.

A property that cannot obtain insurance may become difficult to finance.

The chain becomes:

Flood Risk ↑ → Insurance Cost ↑ → Ownership Cost ↑ → Buyer Demand ↓ → Property Value Pressure ↑

But the cascade can become stronger:

Flood Risk ↑ → Insurance Availability ↓ → Mortgage Financing Constraints ↑ → Buyer Pool ↓ → Property Liquidity ↓ → Property Values ↓

This produces a potentially powerful feedback.

As property values decline:

Property Values ↓ → Tax Base ↓ → Municipal Revenue ↓ → Infrastructure Investment Capacity ↓

If infrastructure resilience subsequently deteriorates:

Infrastructure Resilience ↓ → Flood Vulnerability ↑ → Property Risk ↑

The cycle closes:

Property Values ↓ → Tax Base ↓ → Infrastructure Capacity ↓ → Flood Risk ↑ → Insurance Stress ↑ → Property Values ↓

This is a coupled socioeconomic feedback loop.


8. The Insurance–Mortgage–Real Estate Feedback

Insurance and mortgage finance are closely connected.

A mortgage is a long-duration financial claim secured by an asset expected to retain sufficient value to protect the lender.

As flood risk increases, the financial system therefore confronts several interconnected questions:

Can the property be insured?

At what cost?

Will the property retain its value?

Will future buyers be able to obtain financing?

Will the property remain inhabitable?

The resulting feedback can be represented as:

Flood Risk ↑ → Insurance Risk ↑ → Insurance Cost/Availability Deteriorates → Mortgage Risk ↑ → Lending Constraints ↑ → Buyer Demand ↓ → Property Values ↓

The consequences can extend beyond individual homeowners.

Banks and mortgage investors may increasingly need to evaluate climate exposure at the portfolio level.

A geographic concentration of properties exposed to the same flood hazard creates correlated risk.

Unlike independent household losses, a major regional flood can affect thousands or millions of properties simultaneously.

That makes diversification more difficult.


9. Compound Flooding Creates Correlated Insurance Losses

This is one of the most important implications of compound hazards.

Insurance works most effectively when losses are sufficiently diversified.

But compound climate events can create geographically concentrated losses:

Extreme Rainfall + Storm Surge + High Sea Level → Regional Flooding → Thousands of Simultaneous Claims

A major hurricane can therefore produce simultaneous losses across:

  • homes
  • commercial properties
  • vehicles
  • infrastructure
  • businesses
  • utilities
  • municipal facilities

As compound events become more frequent, the financial system can face increasingly correlated losses.

That creates a feedback:

Compound Events ↑ → Correlated Claims ↑ → Insurer Losses ↑ → Pricing Pressure ↑ → Capacity Constraints ↑

This is fundamentally different from a world in which extreme floods are rare and geographically isolated.


10. Return-Period Compression Changes the Insurance Equation

Research examined extreme compound flooding defined as a one-in-100-year storm surge occurring simultaneously with a one-in-100-year rainfall event.

Historically, the combined event had a return period of approximately 200–500 years along the Gulf and southeastern Atlantic coasts and up to 1,000 years or more in parts of New England. Under an extreme warming scenario for 2100, the frequency increased by approximately 7–36 times in the South and 30–195 times farther north.

For insurance markets, the key issue is not the terminology “100-year event.”

The key issue is the frequency of claims-producing events.

If an event once expected to occur once in several centuries begins occurring multiple times within an insurance portfolio’s planning horizon, historical loss assumptions become increasingly unreliable.

Thus:

Return Interval ↓ → Claims Frequency ↑ → Expected Losses ↑ → Premium Pressure ↑ → Insurance Availability ↓


11. Stronger and Slower Hurricanes Increase Insurance Exposure

Our modeling projects the strongest hurricanes could become approximately 15–30% more intense while moving 20–30% more slowly along much of the U.S. coast. The combination increases the probability of simultaneous extreme rainfall and storm tide.

For property markets, this produces multiple simultaneous threats:

Intensity ↑ → Wind Damage ↑

Intensity ↑ → Storm Surge ↑

Intensity ↑ → Rainfall Potential ↑

Translation Speed ↓ → Rainfall Duration ↑

The combined result is:

Stronger + Slower Storms → Wind + Surge + Rainfall → Compound Property Losses

The insurance consequences can therefore be substantially larger than those associated with a simple increase in storm frequency.


12. Inland Property Markets Are Increasingly Exposed

Flood risk is not confined to oceanfront real estate.

Research finds substantial compound-flooding risks farther inland, including along Gulf Coast rivers where high streamflow can interact with storm surge. Increasing evidence suggests compound flooding can be greatest inland near the limit of tidal influence rather than directly at the coast.

A 2026 preprint found substantial increases in the probability of compound wind and precipitation extremes both within 100 kilometers of the coast and 100–500 kilometers inland under an extreme warming projection.

The significance for real estate is considerable.

Flood risk can migrate geographically.

Coastal Risk → Inland Watershed Risk → Inland Property Exposure

Communities that historically considered themselves outside the principal flood-risk zone can increasingly encounter climate-driven flooding.

That creates a major valuation problem because local markets may have little historical experience with these events.


13. Urban Flooding Creates a New Real-Estate Risk

Urban flooding introduces another dimension.

Extreme precipitation can overwhelm drainage systems even where properties are far from coastlines and major rivers.

The risk can become particularly acute in below-grade housing.

Extreme Rainfall → Stormwater System Overload → Rapid Urban Flooding → Basement/Below-Grade Exposure → Life-Safety Risk

This matters to real estate because conventional flood-risk perceptions often emphasize proximity to rivers, coastlines, or mapped floodplains.

But intense rainfall can create dangerous flooding through overwhelmed urban drainage systems.

As a result:

Flood Risk ≠ Coastal Risk Alone

Increasingly:

Flood Risk = Coastal + Riverine + Pluvial + Urban + Compound Risk

This expansion complicates property valuation, insurance underwriting, and municipal planning.


14. Recovery Deficit Is the Hidden Variable

The most important variable in cascading real-estate risk may not be flood magnitude.

It may be recovery time.

Consider:

Flood A → Damage → Partial Recovery → Flood B → Additional Damage → Partial Recovery → Flood C

If each event arrives before full recovery, unresolved losses accumulate.

A conceptual relationship is:

Resilience(t+1) = Resilience(t) + Recovery(t) − Damage(t)

When:

Recovery > Damage → Resilience Restored

But when:

Damage > Recovery → Resilience Declines

This creates a critical threshold:

Damage Rate > Recovery Rate

Once that condition persists, the system enters a recovery deficit.

For real estate, the consequences include:

Unrepaired Properties → Deferred Maintenance → Lower Property Quality → Lower Values → Reduced Investment → Greater Vulnerability

The property market therefore becomes a mechanism through which physical climate shocks can accumulate.


15. Repeated Flooding Can Produce a Negative Wealth Feedback

Homeownership represents a substantial component of household wealth.

Repeated climate-related losses can therefore create a feedback involving household balance sheets.

Flooding ↑ → Repair Costs ↑ → Insurance Costs ↑ → Property Values ↓ → Household Equity ↓ → Financial Resilience ↓

Lower household financial resilience can make recovery more difficult:

Financial Resilience ↓ → Delayed Repairs → Property Condition ↓ → Property Value ↓

The resulting loop becomes:

Flood Risk ↑ → Property Damage ↑ → Household Wealth ↓ → Recovery Capacity ↓ → Property Vulnerability ↑ → Future Losses ↑

This is particularly significant in communities where property represents a large share of household net worth.

Climate risk can therefore become wealth risk.


16. The Municipal Feedback Loop

The consequences do not stop at individual properties.

Municipal governments depend heavily on property values and economic activity.

A potential cascade is:

Flood Frequency ↑ → Property Damage ↑ → Property Values ↓ → Tax Base ↓ → Municipal Revenue ↓

The municipality then has fewer resources available for:

  • drainage improvements
  • flood defenses
  • road repair
  • stormwater systems
  • emergency response
  • public infrastructure maintenance
  • adaptation

This can produce:

Municipal Revenue ↓ → Infrastructure Investment ↓ → Resilience ↓ → Flood Damage ↑

The feedback closes:

Flood Risk ↑ → Property Values ↓ → Tax Base ↓ → Infrastructure Capacity ↓ → Flood Vulnerability ↑ → Property Risk ↑

At this point, the climate hazard has become embedded in the fiscal condition of the community.


17. The Insurance–Property–Infrastructure Feedback

The major feedback loops can be integrated into a single system:

Climate Warming → Hazard Intensification → Hazard Coupling → Compound Flooding → Physical Damage → Insurance Losses → Premiums/Availability Pressure → Property Value Decline → Investment Decline → Tax Base Erosion → Infrastructure Investment Decline → Resilience Erosion → Greater Flood Vulnerability → Greater Future Losses

This is the core cascading-risk mechanism.

The system is not linear.

Each component can alter the conditions affecting the next component.

The physical climate hazard creates the initial disturbance.

The socioeconomic system can then amplify the disturbance.


18. Insurance May Become an Early-Warning System for Climate Risk

Insurance markets have an unusual role in this transition.

They continuously translate physical risk into financial pricing.

Consequently, insurance-market changes may provide an early indicator of emerging real-estate instability.

The sequence may be:

Physical Risk ↑ → Actuarial Risk ↑ → Premiums ↑ → Deductibles ↑ → Coverage Restrictions ↑ → Insurer Withdrawal ↑

These signals can appear before large-scale property abandonment.

A community may therefore be approaching a real-estate resilience threshold even when most houses remain physically intact.

The early warning may instead appear as:

Insurance Availability ↓

Insurance Affordability ↓

Mortgage Availability ↓

Property Transactions ↓

Investment ↓

Property Values ↓

This suggests that insurance markets should be viewed not merely as financial institutions absorbing climate losses, but as risk sensors embedded within the real-estate system.


19. The Property-Value Feedback Can Accelerate

Once buyers begin incorporating future flood risk into property decisions, market expectations can change.

The feedback can become:

Flood Frequency ↑ → Risk Perception ↑ → Buyer Demand ↓ → Property Values ↓

Lower values can then produce additional effects:

Property Values ↓ → Equity ↓ → Investment ↓ → Maintenance ↓ → Vulnerability ↑

And:

Property Values ↓ → Tax Base ↓ → Public Infrastructure Investment ↓ → Vulnerability ↑

And:

Flood Risk ↑ → Insurance Costs ↑ → Total Cost of Ownership ↑ → Buyer Demand ↓ → Property Values ↓

The system therefore contains multiple reinforcing loops operating simultaneously.

This is what distinguishes a coupled-feedback system from a simple hazard-impact model.


20. The Sandy Example: An Accelerating Financial Risk Clock

Research found that a Sandy-like event in New York City, estimated at approximately once every 150 years in the current climate, could become approximately a once-in-65-year event by 2050 and once-in-30-year event by 2100 under the emissions scenario studied.

From a real-estate perspective, the significance is not simply that the probability of flooding increases.

The economic life of a mortgage, insurance policy, or property investment may span decades.

A hazard that occurs once every 150 years has a very different economic significance from one occurring once every 30 years.

Thus:

Return Interval ↓ → Probability of Loss During Ownership ↑ → Insurance Risk ↑ → Mortgage Risk ↑ → Property Risk ↑

The longer the investment horizon, the more consequential the changing hazard frequency becomes.


21. Sea-Level Rise Creates a Persistent Baseline Shift

Sea-level rise differs from many episodic hazards because it permanently alters the starting point from which future storms occur.

A higher ocean means:

Higher Baseline Water Level → Greater Storm-Surge Reach → Greater Flood Exposure

And:

Sea-Level Rise → Less Drainage Capacity → Greater Interaction Between Runoff and Surge

This means that even if a future storm were identical to a historical storm, its consequences could be different because it would occur against a changed physical baseline.

For property markets:

Sea-Level Rise → Persistent Risk Increase → Long-Term Property Exposure ↑

This is particularly important for real estate because buildings and infrastructure have long lifetimes.


22. The Coastal Property Paradox

Coastal property can remain economically attractive even while its physical risk is increasing.

That creates a potential divergence:

Amenity Value ↑

while:

Climate Risk ↑

For a period, rising demand may conceal increasing physical risk.

But eventually the financial system may begin incorporating the changing risk more aggressively.

The transition can be:

Physical Risk ↑ → Insurance Cost ↑ → Ownership Cost ↑ → Market Awareness ↑ → Buyer Demand ↓ → Property Values ↓

The result may be a delayed repricing.

Real estate markets do not necessarily respond immediately to slowly accumulating physical risk.

Insurance markets, however, may respond sooner because they must continually price expected losses.

This creates the possibility that:

Insurance repricing precedes real-estate repricing.


23. When Insurance Becomes Unaffordable, the Market Changes

Insurance affordability is particularly important because homeowners do not experience insurance as an abstract actuarial variable.

They experience it as part of the cost of owning a property.

The relevant relationship is:

Mortgage + Property Tax + Insurance + Maintenance + Expected Climate Losses = Cost of Ownership

If insurance premiums rise dramatically:

Insurance Cost ↑ → Total Cost of Ownership ↑

The property must either:

Price ↓

or:

Buyer Demand ↓

or both.

If insurance becomes unavailable:

Insurance Availability ↓ → Financing Constraints ↑ → Buyer Pool ↓ → Market Liquidity ↓

The property may remain physically valuable, but its economic utility as a financed asset declines.


24. From Insurability to Habitability

Insurance is not the only threshold.

Eventually, repeated flooding can affect whether a community remains economically and physically viable.

At the most susceptible U.S. sites, the odds of a one-in-50-year coastal flood could approximately double every five years under continuing sea-level rise. It also notes that many U.S. coastal engineering systems were designed around return periods of roughly 50–100 years.

As historically rare floods become increasingly frequent, the question changes.

It is no longer:

Can we recover from a flood?

It becomes:

Can we maintain a functioning community between floods?

That is the transition from flood risk to habitability risk.


25. The Real-Estate Resilience Threshold

A useful conceptual threshold is:

Insurance Cost + Expected Flood Losses + Infrastructure Costs > Property’s Economic Value Proposition

When this condition becomes persistent, the property may remain physically habitable while becoming economically unattractive.

A second threshold occurs when:

Damage Rate > Recovery Rate

At that point, the property or community cannot fully restore itself between successive events.

A third threshold may emerge when:

Protection Cost > Property Value / Tax Base / Available Capital

At that point, continued protection may become economically difficult.

These thresholds can interact:

Flood Risk ↑ → Insurance Cost ↑ → Property Value ↓ → Tax Base ↓ → Protection Capacity ↓ → Flood Risk ↑

This is a cascading threshold system.


26. From Property Decline to Retreat

The ultimate consequence need not be sudden abandonment.

A more realistic process may occur gradually:

Flood Frequency ↑ → Insurance Stress ↑ → Property Values Stagnate → Investment Declines → Maintenance Declines → Infrastructure Deteriorates → Insurance Availability Declines Further → Property Values Fall → Population Outmigration ↑

Eventually:

Population Decline → Tax Base Decline → Infrastructure Capacity Decline → Resilience Decline

At some point, adaptation may become economically preferable to continued protection.

This can lead to:

Protection → Adaptation → Managed Retreat → Abandonment

The timing and geographic extent of such transitions will vary considerably by location.

The key point is that the transition can be driven not by a single catastrophic flood but by cumulative climate risk interacting with economic feedbacks.


27. The Complete Coupled-Feedback / Cascading Real-Estate Framework

The emerging system can be represented as:

Warming → Hazard Intensification → Hazard Coupling → Compound Flooding → Damage → Insurance Losses → Insurance Cost/Availability Pressure → Property-Value Pressure → Reduced Investment → Tax-Base Erosion → Infrastructure Resilience Decline → Greater Vulnerability → Greater Future Losses

A second loop operates through recovery:

Flood Frequency ↑ → Recovery Window ↓ → Unresolved Damage ↑ → Resilience ↓ → Vulnerability ↑ → Subsequent Damage ↑ → Recovery Window ↓

A third loop operates through insurance:

Flood Risk ↑ → Expected Losses ↑ → Premiums ↑ / Coverage ↓ → Cost of Ownership ↑ → Buyer Demand ↓ → Property Values ↓ → Insurer/Lender Risk ↑ → Insurance and Financing Constraints ↑

A fourth operates through municipal finance:

Property Values ↓ → Tax Base ↓ → Municipal Revenue ↓ → Infrastructure Investment ↓ → Resilience ↓ → Flood Risk ↑ → Property Values ↓

These feedbacks are interconnected.

Together they create:

Climate Forcing → Physical Hazard Coupling → Financial Amplification → Resilience Erosion → Cascading Real-Estate Risk


28. A New Definition of Climate-Exposed Property Risk

Traditional real-estate risk often focuses on:

Location + Structure + Historical Flood Zone

A future-oriented model must incorporate additional variables:

Flood Frequency

Compound-Hazard Probability

Sea-Level Rise

Extreme Precipitation

Storm Intensity and Translation Speed

Insurance Availability

Insurance Affordability

Mortgage Availability

Infrastructure Resilience

Recovery Capacity

Property-Value Trajectory

Municipal Fiscal Capacity

The risk of a property is therefore not simply its probability of flooding.

A more comprehensive conceptual formulation is:

Real-Estate Climate Risk ∝ Hazard Exposure × Hazard Coupling × Vulnerability × Insurance Stress × Recovery Deficit

Again, this is a conceptual framework rather than a validated predictive equation.

Its purpose is to recognize that physical exposure and financial vulnerability can amplify one another.


29. Why Historical Property Valuation Models May Become Increasingly Unreliable

A property valuation based heavily on historical comparable sales assumes that the past provides meaningful information about future risk.

But if the climate baseline is changing:

Historical Flood Frequency ≠ Future Flood Frequency

And therefore:

Historical Property Risk ≠ Future Property Risk

This creates the potential for a valuation lag.

A property may continue selling at prices based on historical assumptions even as:

Flood Frequency ↑

Insurance Cost ↑

Infrastructure Stress ↑

Future Risk ↑

The market can therefore experience a delayed repricing once these factors become visible to buyers, lenders, and insurers.

The longer the delay, the greater the possibility of a discontinuous adjustment.


30. The Central Role of Insurance in Price Discovery

Insurance markets can force climate risk into property economics because they must continually reassess expected losses.

This creates a potentially important sequence:

Physical Climate Change → Insurance Repricing → Mortgage Reassessment → Buyer Reassessment → Property Repricing

In this framework, insurance functions as an intermediary between the climate system and the real-estate market.

This makes insurance availability and affordability among the most important indicators to monitor.

A deteriorating insurance market can signal that the physical risk has become financially material even before large-scale property abandonment occurs.


31. The Emerging Climate-Real-Estate Feedback

The broader system can therefore be summarized as:

Physical System

Warming → Sea-Level Rise + Heavier Rainfall + Stronger/Slower Storms → Compound Flooding

Insurance System

Compound Flooding → Claims → Losses → Premium Increases + Coverage Restrictions + Reduced Capacity

Real-Estate System

Insurance Stress → Cost of Ownership ↑ → Buyer Demand ↓ → Property Values ↓

Financial System

Property Values ↓ → Mortgage Risk ↑ → Lending Constraints ↑ → Investment ↓

Municipal System

Property Values ↓ → Tax Base ↓ → Infrastructure Investment ↓

Resilience System

Infrastructure Investment ↓ → Flood Vulnerability ↑

The loop closes:

Flood Vulnerability ↑ → Compound Flood Risk ↑

This is a coupled climate-financial feedback loop.


32. The Difference Between a Disaster and a Cascading Risk

A conventional disaster model begins and ends with the event:

Storm → Flood → Damage → Recovery

The cascading-risk model is different:

Storm → Compound Flood → Damage → Insurance Loss → Financial Stress → Property-Value Decline → Tax-Base Erosion → Infrastructure Stress → Reduced Resilience → Greater Vulnerability → Next Flood → Greater Damage

The disaster is therefore no longer an isolated event.

It becomes a state-changing event.

Each major flood can alter the economic and physical conditions under which the next flood occurs.

This makes the system path dependent.


33. The Most Important Variable May Be the Time Between Disasters

“The Floods of the Future Won’t Come One at a Time”—captures the central problem.

The issue is not simply that flood events become more severe.

It is that the interval between them can become shorter.

The resulting relationship is:

Flood Frequency ↑ + Recovery Time Constant → Recovery Window ↓

Then:

Recovery Window ↓ + Damage Per Event ↑ → Recovery Deficit ↑

Then:

Recovery Deficit ↑ → Property Condition ↓ + Infrastructure Condition ↓ + Financial Resilience ↓

Then:

Resilience ↓ → Consequences of the Next Flood ↑

This is the mechanism through which frequency becomes amplification.


34. From Compound Flooding to Cascading Real-Estate Instability

The complete process can now be expressed in one horizontal chain:

Warming → Hazard Intensification → Hazard Coupling → Compound Flooding → More Frequent Losses → Insurance Stress → Higher Cost of Ownership → Reduced Buyer Demand → Property-Value Decline → Mortgage and Investment Stress → Tax-Base Erosion → Infrastructure Resilience Decline → Recovery Deficit → Greater Future Flood Vulnerability → Cascading Real-Estate Instability

This is the central thesis of the paper.

The most important climate consequence for real estate may not be the destruction of individual properties.

It may be the progressive deterioration of the economic conditions that make those properties insurable, financeable, maintainable, and desirable.


35. Conclusion: When Climate Risk Becomes Property Risk

The emerging flood threat is fundamentally different from the historical model of isolated disasters.

Climate change is increasing the potential for:

Sea-Level Rise + Heavy Rainfall + Stronger/Slower Hurricanes → Compound Flooding

At the same time:

Flood Frequency ↑ → Recovery Windows ↓

These physical changes increasingly interact with:

Insurance

Mortgage Finance

Property Markets

Municipal Finance

Infrastructure

Household Wealth

The resulting system can develop reinforcing feedbacks:

Flood Risk ↑ → Insurance Stress ↑ → Property Values ↓ → Investment ↓ → Infrastructure Resilience ↓ → Flood Vulnerability ↑

and:

Flood Frequency ↑ → Recovery Deficit ↑ → Resilience ↓ → Future Losses ↑

These feedbacks create the possibility of nonlinear and cascading consequences.

The immediate manifestation may be rising insurance premiums, shrinking insurance availability, higher deductibles, declining property demand, or increasing difficulty obtaining mortgages.

The next stage may be declining property values and reduced investment.

The subsequent stage may involve weakening municipal tax bases, deteriorating infrastructure, and increasing difficulty financing adaptation.

The final stage in the most vulnerable locations could involve managed retreat, population displacement, and abandonment.

The critical transition is therefore:

Climate Risk → Insurance Risk → Real-Estate Risk → Financial Risk → Municipal Risk → Resilience Risk → Cascading Systemic Risk

This suggests that real estate and insurance markets should be treated as critical components of the climate system’s socioeconomic response.

Insurance is not merely a mechanism for paying claims after a disaster. It is a mechanism for translating physical risk into financial information.

Real estate is not merely a collection of buildings. It is a store of household wealth, collateral for debt, a source of municipal revenue, and the foundation of local economic activity.

When the physical climate changes, these interconnected systems change with it.

The most consequential question is therefore not simply:

Will a property flood?

It is:

Will the property remain insurable, financeable, valuable, maintainable, and economically viable as the probability of flooding changes?

That is the central real-estate question of the emerging climate era.

The ultimate risk is not a single catastrophic flood.

It is the transition from:

Rare Disaster → Recurrent Hazard → Compound Flooding → Insurance Stress → Property Repricing → Investment Retreat → Resilience Erosion → Cascading Real-Estate Risk

When floods begin arriving faster than properties, infrastructure, insurers, lenders, governments, and communities can adapt, the flood itself becomes only the initiating event.

The deeper crisis is the progressive erosion of the economic and institutional systems that allow a place to remain habitable and investable.

In that sense, the future of climate-exposed real estate may be determined less by whether a property floods once than by whether the surrounding system can continue to recover between floods.

The flood becomes the trigger.
Insurance becomes the transmission mechanism.
Real estate becomes the financial amplifier.
Resilience becomes the limiting factor.
And cascading risk becomes the ultimate consequence.
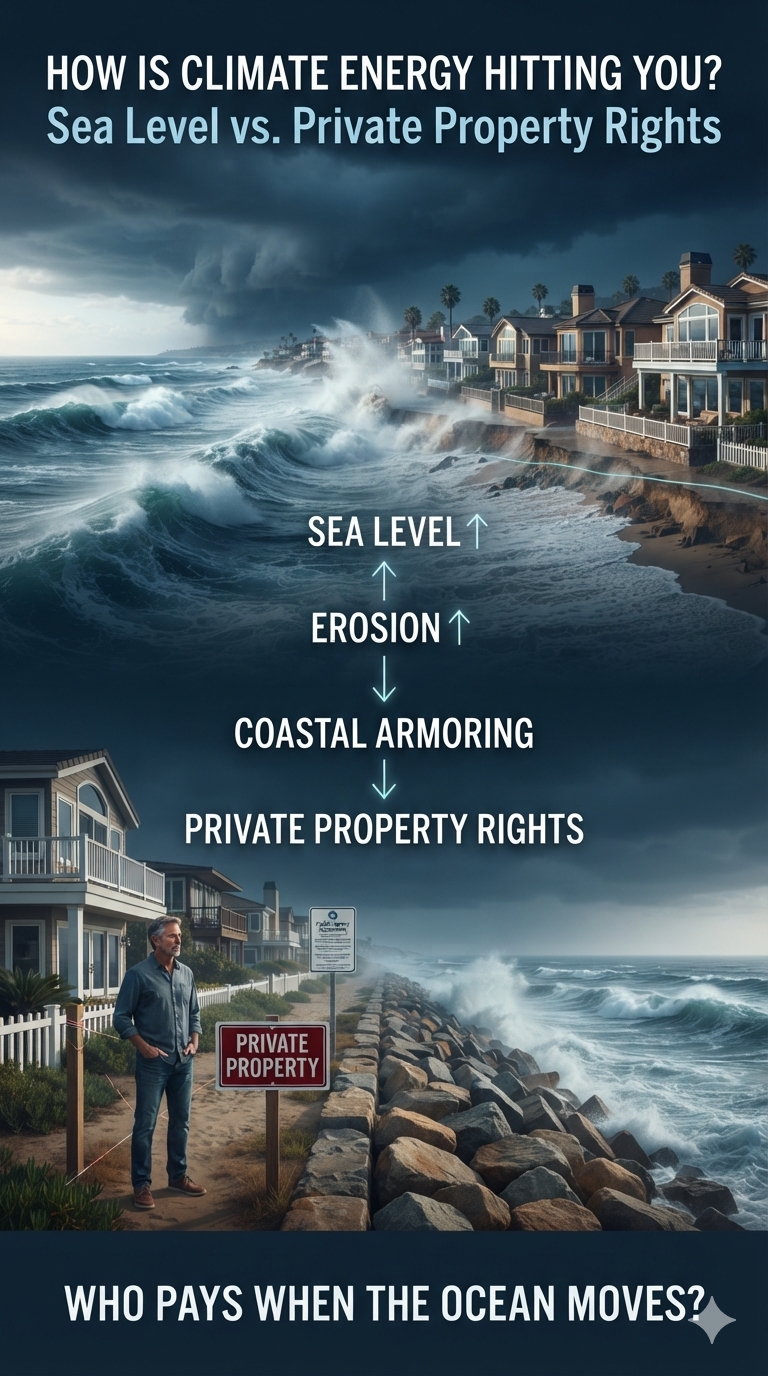
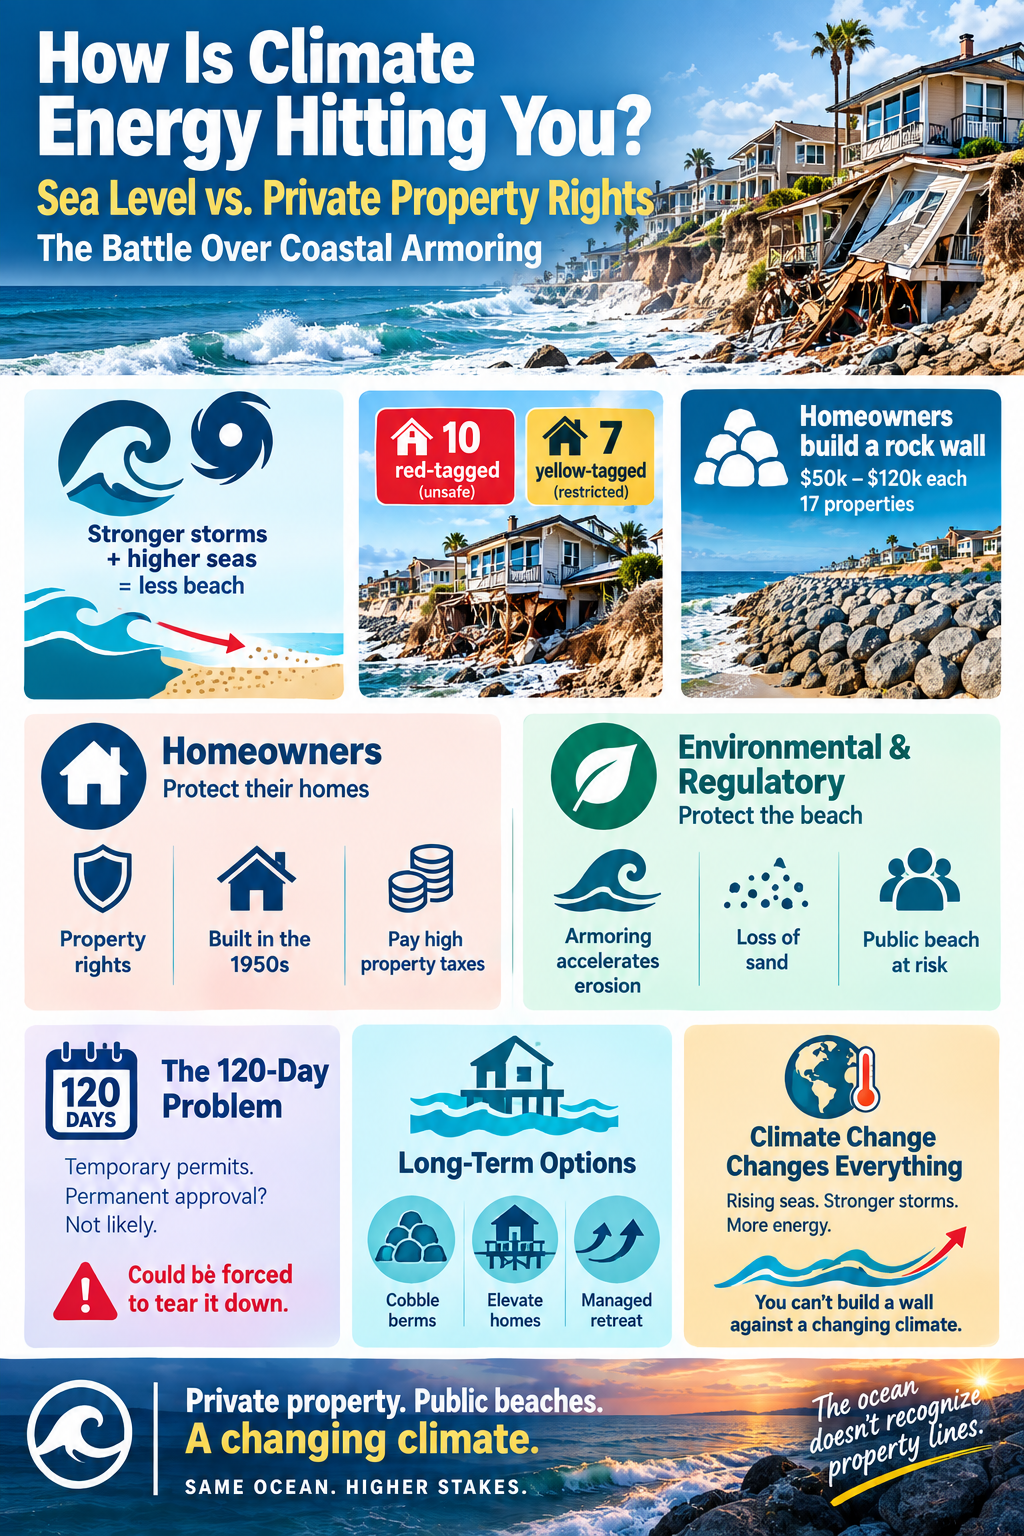
bookmark_borderHigh-Risk U.S. Real Estate Regions Under the Multiplicative Climate Risk Framework

by Daniel Brouse and Sidd Mukherjee

The Multiplicative Climate Risk Formula

The Multiplicative Climate Risk Formula is a real-estate climate-risk model designed to capture how multiple hazards and vulnerabilities can interact and compound rather than occur independently. The framework incorporates interconnected risks including sea-level rise, storm surge, extreme precipitation, flooding, hydroclimatic whiplash, wildfires, drought, extreme heat, hurricanes, landslides, avalanches, and other cascading hazards.

Rather than treating each hazard as an isolated threat, the model evaluates how hazard exposure, hazard coupling, structural vulnerability, insurance stress, and recovery deficits can multiply overall real-estate risk.

The central premise is simple:

Climate risk is not merely additive. When multiple vulnerabilities interact, their combined impact can be substantially greater than the sum of their individual effects.

Applying the Multiplicative Climate Risk Formula reveals an important characteristic of climate-driven real-estate risk: the highest-risk regions are not necessarily those experiencing the most dramatic individual weather events. The greatest systemic risk emerges where multiple risk dimensions interact and amplify one another.

A region can experience severe hurricanes, wildfires, flooding, or extreme heat without necessarily experiencing the highest level of cascading real-estate risk. The critical question is what happens when physical hazards interact with high exposure, hazard coupling, structural vulnerability, insurance-market stress, and limited recovery capacity.

The framework therefore evaluates five interacting dimensions:

Hazard Exposure × Hazard Coupling × Vulnerability × Insurance Stress × Recovery Deficit = Multiplicative Climate Risk

Each component is scored from 1 to 5, where:

1 = Low Risk

2 = Moderate-Low Risk

3 = Moderate Risk

4 = High Risk

5 = Extreme Risk

The resulting score is not a probability of loss or a conventional actuarial measure. It is a comparative systems-risk index designed to identify locations where multiple weaknesses can reinforce one another.

This distinction is critical.

A region with a score of 5 in one category but relatively low scores elsewhere may be less systemically exposed than a region scoring 4 or 5 across nearly every category.

The multiplicative framework captures that interaction:

Physical Hazard ↑ + Coupling ↑ + Vulnerability ↑ + Insurance Stress ↑ + Recovery Capacity ↓ → Cascading Real-Estate Risk ↑↑

The following ranking represents a comparative assessment of major U.S. real-estate risk regions, incorporating physical hazards and the increasingly important financial and institutional dimensions of climate exposure.


1. Gulf Coast & Southern Florida

The Compound-Compounding Zone

Hazard Exposure — 5/5

The Gulf Coast and southern Florida face some of the country’s most concentrated combinations of acute and chronic climate hazards.

These include:

Major Hurricanes + Storm Surge + Extreme Rainfall + Sea-Level Rise + Coastal Flooding + Extreme Heat

The region’s vulnerability is not based on any single hazard. It is the convergence of multiple hazards affecting a densely developed coastal real-estate market.

Hazard Coupling — 5/5

The defining characteristic is the interaction among hazards.

A tropical cyclone can simultaneously produce:

Storm Surge + Extreme Rainfall + River Flooding + High Winds

Sea-level rise increases the baseline upon which storm surge occurs, while extreme rainfall can overwhelm drainage systems at the same time that elevated coastal water levels restrict drainage.

The resulting process is:

Hurricane → Storm Surge + Extreme Rainfall → Drainage Impairment → Compound Flooding → Widespread Property Exposure

This is precisely the type of coupled hazard that can produce disproportionate economic consequences.

Vulnerability — 4/5

The region contains enormous quantities of residential, condominium, commercial, and infrastructure assets exposed to coastal and flood hazards.

Building age and construction standards vary substantially. Newer construction and mitigation measures can reduce vulnerability, while older structures and properties with inadequate flood, wind, or drainage protection remain substantially more exposed.

The critical issue is therefore not simply the age of the housing stock, but the mismatch between:

Long-Lived Real Estate Assets → Rapidly Changing Climate Risk

Insurance Stress — 5/5

Insurance is one of the most consequential real-estate constraints in the region.

The combination of hurricanes, storm surge, flooding, wind damage, sea-level rise, and repeated catastrophe losses places substantial pressure on insurance availability and affordability.

The resulting feedback is:

Climate Risk ↑ → Expected Losses ↑ → Insurance Premiums ↑ → Deductibles and Coverage Restrictions ↑ → Insurance Availability ↓

For homeowners, insurance costs directly increase the cost of ownership.

For commercial real estate, rising insurance expenses can reduce net operating income and asset values by increasing operating costs. The effect is particularly significant for multifamily, hospitality, retail, and other income-producing properties.

The insurance problem therefore extends beyond individual policies.

It becomes a real-estate valuation problem:

Insurance Cost ↑ → Cost of Ownership ↑ → Buyer Demand ↓ → Property Values ↓

Recovery Deficit — 4/5

The region’s substantial public and private capital resources provide recovery capacity, but the scale of the infrastructure challenge is enormous.

Long-term pressures include:

Flood-Control Systems + Pump Stations + Drainage Networks + Seawalls + Roads + Bridges + Utilities + Wastewater Systems

The concern is not whether these systems can recover from one disaster.

The concern is whether:

Repeated Damage > Available Recovery and Adaptation Capacity

If the frequency of major events increases faster than infrastructure can be repaired, upgraded, or relocated, a recovery deficit can develop.

Multiplicative Risk

5 × 5 × 4 × 5 × 4 = 2,000

Total Risk Factor: 2,000

The Gulf Coast and southern Florida therefore represent the most pronounced example of compound climate-real-estate risk in the framework.


2. Central & Southern California Wildland-Urban Interface

The Fire–Flood–Insurance Cascade Zone

Hazard Exposure — 4/5

The Central and Southern California WUI faces a combination of:

Wildfire + Extreme Heat + Drought + Water Stress + Extreme Rainfall

The exposure is particularly consequential because enormous quantities of residential real estate have been constructed adjacent to or within wildfire-prone landscapes.

Hazard Coupling — 5/5

The defining feedback is:

Drought → Vegetation Stress → Wildfire → Vegetation Loss → Soil Destabilization → Extreme Rainfall → Mudslides and Debris Flows

This is a classic sequential compound-risk mechanism.

Wildfire does not simply produce immediate property losses.

It can alter the landscape in ways that increase the consequences of subsequent precipitation events.

The result is:

Wildfire → Landscape Transformation → Increased Post-Fire Flood/Mudslide Risk

This creates a risk cascade extending beyond the original fire.

Vulnerability — 4/5

Residential development in steep terrain, narrow canyons, and areas with constrained evacuation routes can create substantial exposure.

Vulnerability also depends on construction standards, defensible space, vegetation management, access routes, and the ability of communities to recover rapidly after catastrophic fires.

Insurance Stress — 5/5

California represents one of the clearest examples of insurance-market stress becoming a real-estate problem.

The combination of catastrophic wildfire exposure, rapidly changing risk conditions, and repeated losses creates pressure on insurers to increase premiums, restrict coverage, reduce exposure, or withdraw from high-risk markets.

When private insurance becomes unavailable or unaffordable, property owners may be forced into residual or state-backed insurance mechanisms.

The resulting feedback is:

Wildfire Risk ↑ → Insurance Losses ↑ → Premiums ↑ → Coverage Restrictions ↑ → Private Insurance Availability ↓ → Residual-Market Dependence ↑

This creates a second real-estate feedback:

Insurance Availability ↓ → Financing Constraints ↑ → Buyer Pool ↓ → Property Liquidity ↓ → Property Values ↓

The insurance problem can therefore become a leading indicator of broader real-estate repricing.

Recovery Deficit — 4/5

Large wildfire events can produce extensive reconstruction requirements simultaneously.

The recovery system must contend with:

Destroyed Housing + Infrastructure Damage + Debris Removal + Labor Requirements + Construction Demand + Supply Constraints

The resulting competition for labor and materials can extend rebuilding timelines and increase reconstruction costs.

The longer recovery takes, the greater the potential for:

Recovery Delay → Business Interruption → Household Displacement → Reduced Local Economic Activity → Reduced Community Resilience

Multiplicative Risk

4 × 5 × 4 × 5 × 4 = 1,600

Total Risk Factor: 1,600

The California WUI therefore represents a particularly important example of insurance availability becoming a leading indicator of real-estate climate risk.


3. Coastal Texas

The Industrial and Commercial Risk Hub

Hazard Exposure — 4/5

Coastal Texas faces:

Hurricanes + Storm Surge + Extreme Rainfall + Flash Flooding + Extreme Heat + Grid Stress

The region’s importance is amplified by its enormous concentration of industrial, commercial, petrochemical, port, logistics, and residential assets.

Hazard Coupling — 4/5

The physical hazards can interact through several pathways.

For example:

Extreme Heat → Electricity Demand ↑ → Grid Stress ↑ → Power Disruption → Cooling/Industrial/Commercial Disruption

At the same time:

Hurricane → Wind + Surge + Rainfall → Flooding + Power Loss → Business Interruption

And:

Flooding + Heat + Power Loss → Mold + Water Damage + Equipment Failure + Building-System Damage

This produces a multi-system cascade rather than a single flood loss.

Vulnerability — 4/5

Coastal Texas contains enormous concentrations of development and infrastructure in flood-prone and low-lying areas.

Impervious surfaces can increase runoff, while dense development can make drainage problems more consequential.

The concentration of industrial and commercial assets also creates correlated economic risk.

A single major event can affect multiple businesses, transportation systems, suppliers, utilities, and customers simultaneously.

Insurance Stress — 4/5

Insurance costs and coverage limitations are becoming an increasingly important component of real-estate risk.

Wind, hail, hurricane, flood, and business-interruption exposures can produce substantial premiums and deductibles.

As insurers reassess catastrophe exposure, property owners can increasingly absorb a greater portion of the risk through:

Higher Deductibles + Coverage Restrictions + Increased Premiums + Greater Self-Insurance

For commercial real estate, increasing insurance expenses directly affect:

Operating Expenses ↑ → NOI ↓ → Capitalization Value ↓

This provides a direct financial transmission mechanism between climate risk and commercial property valuation.

Recovery Deficit — 3/5

Coastal Texas possesses substantial private capital and strong economic capacity, which can accelerate reconstruction.

However, public infrastructure and regional systems can take much longer to repair.

The result is a two-speed recovery:

Private Capital → Rapid Property Recovery

while:

Public Infrastructure → Slower System Recovery

This creates a temporary resilience gap.

Multiplicative Risk

4 × 4 × 4 × 4 × 3 = 768

Total Risk Factor: 768

Coastal Texas represents an important example of how high-value commercial real estate can convert physical climate exposure into large-scale correlated financial losses.


4. Mississippi River Delta & Inland Waterways

The Structural-Aging and Recovery-Deficit Zone

Hazard Exposure — 3/5

The Mississippi Delta and associated inland waterways face:

River Flooding + Extreme Rainfall + Severe Convective Storms + Subsidence + Coastal Flooding

The region’s raw hazard exposure is lower than some Gulf Coast locations, but the interaction of hazards with infrastructure and socioeconomic vulnerability dramatically increases systemic risk.

Hazard Coupling — 3/5

One important pathway is:

Upstream Extreme Rainfall → River Discharge ↑ → Downstream Flooding → Prolonged Inundation → Structural and Infrastructure Damage

In coastal portions of the Delta, this can interact with:

River Flooding + Storm Surge + Sea-Level Rise → Compound Inland/Coastal Flooding

The duration of inundation can be as important as peak water depth because prolonged water exposure can increase mold, structural deterioration, electrical damage, and infrastructure failure.

Vulnerability — 5/5

This region’s primary vulnerability is structural.

Risk is amplified by:

Aging Infrastructure + Levee Dependence + Aging Buildings + Economic Constraints + Limited Local Fiscal Capacity

The critical issue is not simply whether flood-control infrastructure exists.

It is whether that infrastructure can be maintained, upgraded, and replaced at the rate required under changing climate conditions.

Insurance Stress — 4/5

Flood insurance is an essential component of property financing in designated high-risk areas where federal requirements apply.

However, the availability and affordability of private flood coverage can vary substantially by location and risk profile.

Where private coverage is limited, property owners can become increasingly dependent on federal flood insurance and other residual mechanisms.

This creates another form of concentration risk:

Private Insurance Capacity ↓ → Public Backstop Dependence ↑

The problem becomes more acute when repeated losses increase premiums, deductibles, or coverage restrictions faster than property values and household incomes can absorb them.

Recovery Deficit — 5/5

This is the region’s defining weakness.

A major flood can produce:

Property Damage → Income Loss → Reduced Local Tax Revenue → Infrastructure Damage → Limited Local Recovery Capacity

Federal disaster assistance can be essential, but administrative processes, funding requirements, and reconstruction complexity can extend recovery timelines.

The resulting feedback can become:

Low Local Fiscal Capacity → Slow Recovery → Persistent Damage → Lower Property Values → Lower Tax Base → Even Lower Recovery Capacity

Multiplicative Risk

3 × 3 × 5 × 4 × 5 = 900

Total Risk Factor: 900

This produces an important result:

The Mississippi Delta scores lower than Coastal Texas in raw hazard exposure but higher in total multiplicative risk.

That is precisely why a multiplicative framework is useful.

A moderate physical hazard can produce extreme systemic risk when combined with high vulnerability and a severe recovery deficit.


5. Urban Northeast Corridor

The Legacy-Infrastructure and Urban-Flooding Zone

Hazard Exposure — 3/5

The urban Northeast faces:

Nor’easters + Extreme Rainfall + Tidal Flooding + Sea-Level Rise + Urban Flash Flooding

The region does not necessarily experience the most extreme individual climate hazards in the country.

Its risk derives from density, infrastructure age, and enormous concentrations of economic value.

Hazard Coupling — 4/5

A central pathway is:

Sea-Level Rise → Higher Coastal Baseline → Reduced Stormwater Drainage Capacity → Heavy Rainfall → Urban Flooding

The resulting flooding can affect:

Basements + Subways + Tunnels + Electrical Systems + Transportation Networks + Commercial Districts

This creates a particularly important urban cascade:

Extreme Rainfall → Stormwater Overload → Transit Disruption → Workforce Disruption → Business Interruption → Economic Loss

Vulnerability — 4/5

The region contains extraordinary quantities of legacy infrastructure and older real estate.

Many structures were designed under climate conditions substantially different from those now emerging.

Below-grade spaces can be especially vulnerable:

Basement Housing + Electrical Rooms + Subway Infrastructure + Underground Transportation

This makes the region highly sensitive to intense precipitation even when properties are not located directly adjacent to rivers or coastlines.

Insurance Stress — 3/5

Insurance remains more available than in the most stressed coastal and wildfire markets, but the trajectory remains important.

Increasing flood claims, basement losses, storm damage, and infrastructure disruption can gradually increase premiums and deductibles.

The principal concern is therefore not an immediate insurance-market collapse but gradual repricing of urban climate exposure.

The feedback is:

Urban Flood Risk ↑ → Claims ↑ → Insurance Costs ↑ → Cost of Ownership ↑ → Property-Value Pressure ↑

Recovery Deficit — 2/5

The Northeast possesses comparatively strong municipal tax bases, financial resources, infrastructure institutions, and access to federal resources.

This provides substantial recovery capacity.

However, the scale and age of infrastructure create long-term adaptation challenges.

The region’s primary weakness is therefore not immediate recovery capacity but the enormous cost of modernizing legacy systems before they become repeatedly overwhelmed.

Multiplicative Risk

3 × 4 × 4 × 3 × 2 = 288

Total Risk Factor: 288

The Urban Northeast demonstrates that high population density and high property values do not automatically produce the highest multiplicative risk.

Strong fiscal and institutional recovery capacity can substantially reduce systemic risk.


Real-Estate Climate Risk Comparison Matrix

The following matrix applies the five-factor multiplicative framework:

RegionHazard ExposureHazard CouplingVulnerabilityInsurance StressRecovery DeficitMultiplicative Risk
1. Gulf Coast & Southern Florida554542,000
2. California WUI454541,600
3. Mississippi River Delta & Inland Waterways33545900
4. Coastal Texas44443768
5. Urban Northeast Corridor34432288

Why the Ranking Matters

The ranking demonstrates why climate-driven real-estate risk cannot be measured solely by the severity of weather.

The Mississippi Delta provides the clearest example.

Its 3/5 hazard-exposure score is lower than Coastal Texas’s 4/5, yet its overall multiplicative score is higher:

Mississippi Delta → 900

Coastal Texas → 768

The difference arises from the interaction of:

High Vulnerability + High Insurance Stress + Severe Recovery Deficit

This is the essence of cascading risk.

A region does not need to have the most extreme weather to have the greatest systemic vulnerability.

It needs to have the most dangerous combination of interacting weaknesses.


The Central Insurance Feedback

Across the five regions, insurance functions as one of the primary transmission mechanisms connecting physical climate risk to real-estate values.

The feedback can be represented as:

Climate Risk ↑ → Expected Losses ↑ → Insurance Claims ↑ → Premiums ↑ → Deductibles ↑ → Coverage Restrictions ↑ → Insurance Availability ↓ → Cost of Ownership ↑ → Property Demand ↓ → Property Values ↓

Once property values begin declining, another feedback can emerge:

Property Values ↓ → Mortgage Collateral ↓ → Lending Risk ↑ → Financing Constraints ↑ → Buyer Pool ↓ → Property Liquidity ↓ → Property Values ↓

Insurance therefore does not merely compensate property owners after losses.

It can influence whether a property can be:

Owned → Financed → Sold → Developed → Maintained → Insured

This makes insurance availability and affordability a critical component of real-estate climate risk.


The Major Coupled Feedback Loops

1. Insurance–Property Value Feedback

Climate Risk ↑ → Insurance Losses ↑ → Premiums ↑ / Availability ↓ → Cost of Ownership ↑ → Buyer Demand ↓ → Property Values ↓


2. Property Value–Tax Base Feedback

Property Values ↓ → Tax Base ↓ → Municipal Revenue ↓ → Infrastructure Investment ↓ → Resilience ↓ → Flood Risk ↑ → Property Values ↓


3. Recovery-Deficit Feedback

Disaster Frequency ↑ → Recovery Window ↓ → Unresolved Damage ↑ → Vulnerability ↑ → Next-Event Losses ↑ → Recovery Window ↓


4. Insurance–Mortgage Feedback

Physical Risk ↑ → Insurance Stress ↑ → Coverage Constraints ↑ → Mortgage Risk ↑ → Lending Constraints ↑ → Buyer Pool ↓ → Property Values ↓


5. Commercial Real-Estate Feedback

For income-producing properties:

Climate Risk ↑ → Insurance + Maintenance + Adaptation Costs ↑ → Operating Expenses ↑ → NOI ↓ → Property Value ↓

This relationship is particularly important for multifamily, hospitality, retail, industrial, and other income-producing properties.


The Cascading Real-Estate Framework

The five regional examples reveal several recurring stages in the emerging climate-real-estate cascade:

Physical Hazard

Warming → Sea-Level Rise + Heavier Rainfall + Stronger/Slower Storms + Extreme Heat + Drought

Hazard Coupling

Multiple Hazards → Compound Events → Greater Physical Exposure

Property Damage

Compound Hazard → Structural Damage + Infrastructure Damage + Business Interruption

Insurance Stress

Losses ↑ → Premiums ↑ + Deductibles ↑ + Coverage Restrictions ↑ + Availability ↓

Property Repricing

Insurance Cost ↑ → Cost of Ownership ↑ → Buyer Demand ↓ → Property Values ↓

Financial Amplification

Property Values ↓ → Mortgage Risk ↑ + Investment ↓ + Liquidity ↓

Municipal Amplification

Property Values ↓ → Tax Base ↓ → Infrastructure Investment ↓

Resilience Erosion

Infrastructure Investment ↓ + Recovery Capacity ↓ → Vulnerability ↑

Cascading Risk

Vulnerability ↑ → Future Losses ↑ → Insurance Stress ↑ → Property Values ↓

The resulting closed-loop system is:

Climate Hazard → Physical Loss → Insurance Stress → Property-Value Decline → Investment Decline → Tax-Base Erosion → Infrastructure Deterioration → Recovery Deficit → Greater Vulnerability → Greater Future Loss


The Central Finding

The Multiplicative Climate Risk framework produces a fundamentally different understanding of climate-exposed real estate.

The highest-risk region is not necessarily the region with:

The Most Hurricanes

The Most Wildfires

The Most Rainfall

or

The Highest Sea-Level Rise

Instead, it is the region where multiple risk factors interact:

Hazard Exposure × Hazard Coupling × Vulnerability × Insurance Stress × Recovery Deficit

The resulting system can become self-reinforcing:

Climate Hazard → Insurance Stress → Property-Value Decline → Investment Decline → Tax-Base Erosion → Infrastructure Resilience Decline → Recovery Deficit → Greater Vulnerability → Greater Future Loss

This is the central transition from climate hazard to cascading real-estate risk.

The most consequential property-market question is therefore no longer simply:

Will this property flood, burn, or be damaged by extreme weather?

It is:

Can this property remain insurable, financeable, valuable, maintainable, and economically viable as climate hazards become more frequent and increasingly coupled?

That question shifts climate-risk analysis from the physical event itself to the long-term resilience of the economic system surrounding the property.

And that is where the greatest risks may emerge.

The weather creates the shock.
Coupled hazards amplify the shock.
Insurance translates the shock into financial cost.
Real estate capitalizes the cost into property values.
Weak recovery capacity allows the damage to accumulate.
And cascading feedbacks can turn a climate hazard into a real-estate crisis.

bookmark_borderClimate Change Impacts and You: The Rising Cost of a Changing Climate

by Daniel Brouse

Introduction

Climate change is no longer simply a future environmental threat. It is increasingly affecting American households through higher costs, declining air quality, extreme heat, infrastructure disruptions, property damage, and changing patterns of disease.

Although catastrophic floods, hurricanes, wildfires, and other disasters dominate the headlines, the most widespread climate impact may be less dramatic: the steady financial pressure climate change places on everyday household budgets. Food prices, insurance premiums, utility bills, and the costs of maintaining homes and communities are all increasingly influenced by a changing climate.

The impacts are not distributed equally. Some are nearly universal, while others are concentrated in particular regions or communities. The ranking below therefore considers two factors: how widely households are exposed and how severely the impact can disrupt everyday life.

Ranking of Climate Impacts on the Average U.S. Household

RankImpact CategoryPrimary Household ThreatsUbiquitySeverity
1Economic ImpactsFood inflation, insurance premiums, taxes, utility costsNearly universalHigh financial strain
2Air Quality & Chronic HealthWildfire smoke, longer allergy seasons, heat stressVery highHigh health risk
3Grid & Utility DisruptionsBlackouts, heat-related demand, water shortagesHigh, but regionalHigh daily disruption
4Acute Physical DamageFloods, hail, hurricanes, wildfiresRegional/localCatastrophic when exposed
5Vector-Borne DiseasesLyme disease, mosquitoes, expanding pathogen rangesRegional and expandingModerate to high health risk

Global Ranking of Climate Impacts on the Average Household

The ranking below shifts the order of impacts based on global reach and the immediate threat to human life and livelihoods across developing and developed nations alike.

RankImpact CategoryPrimary Global Household ThreatsUbiquitySeverity
1Economic & Food SecurityGlobal food price spikes, crop failures, loss of agricultural livelihoodsUniversal (100% of homes)Extreme financial/survival strain
2Acute Physical DamageCatastrophic monsoon flooding, sea-level rise, mega-wildfires, historic droughtsVery High (Millions displaced)Catastrophic loss of shelter
3Air Quality & Extreme HeatLethal wet-bulb temperatures, severe dust/smoke pollution, urban heat islandsHigh (Equatorial & Urban zones)Critical health emergency
4Grid & Utility DisruptionsTotal lack of power access, severe municipal water shortages, drying river basinsHigh (Varies by infrastructure)High daily survival disruption
5Vector-Borne DiseasesMalaria, Dengue fever expansion, waterborne cholera outbreaksExpanding (Sub-tropical regions)High health and mortality risk

1. Economic Impacts: The Most Universal Climate Burden

Economic impacts rank first because households do not have to live in a flood zone, wildfire corridor, or hurricane-prone region to pay the economic costs of climate change. Climate-related costs increasingly reach Americans through food prices, insurance premiums, utility bills, taxes, public fees, and the rising cost of maintaining homes and infrastructure.

Climate change can therefore function as a cost multiplier, increasing expenses both directly and indirectly.

Climate-Driven Food Inflation

Drought, extreme heat, excessive rainfall, and other weather disruptions can reduce agricultural yields and interfere with food production and supply chains. Because food markets are interconnected, production losses in one region can influence prices far beyond the location of the original climate event.

The effects can reach everyday staples and commodities such as coffee, wheat, corn, beef, fruits, and vegetables.

The result is a climate-related cost that can reach virtually every household through the grocery bill—even when the household is hundreds or thousands of miles from the drought, flood, or heatwave affecting agricultural production.

The Insurance Crisis

Insurance is one of the clearest mechanisms through which climate risk is transferred directly to households.

As floods, hurricanes, wildfires, severe storms, and other disasters generate increasingly costly losses, insurers may respond by raising premiums, increasing deductibles, restricting coverage, or withdrawing from particularly high-risk markets.

For homeowners, climate risk can therefore produce a double financial burden:

higher insurance costs + higher uninsured exposure.

In some locations, the problem extends beyond affordability. Homeowners may find that certain types of coverage are difficult or impossible to obtain through conventional private insurance markets.

Rising Utility Costs

Hotter summers increase demand for air conditioning. As temperatures remain elevated for longer periods, households may need to run cooling systems more frequently and for longer durations.

That increases electricity consumption while simultaneously placing additional stress on the power grid.

Climate change can therefore affect household budgets through both higher energy consumption and the cost of maintaining a more resilient electrical system.

Water systems can face similar pressures. Drought, declining water supplies, flooding, and changing precipitation patterns may require communities to invest in new reservoirs, treatment capacity, pipelines, drainage systems, and other infrastructure.

Those investments ultimately have to be paid for.

Taxes, Assessments, and Public Costs

One of the least visible climate costs is the portion that reaches households through government budgets rather than private markets.

When climate-related disasters become more costly, governments must spend more on emergency response, disaster recovery, infrastructure repair, flood protection, stormwater management, wildfire preparedness, water systems, coastal protection, and long-term climate adaptation.

Those expenses can eventually reach households through:

  • Property taxes used to finance infrastructure repairs and resilience projects.
  • Special assessments and municipal fees for stormwater, drainage, flood control, and other local projects.
  • Higher utility rates needed to upgrade vulnerable water and electrical systems.
  • State and federal taxes that help finance disaster recovery, emergency response, agricultural assistance, infrastructure rebuilding, and resilience programs.
  • Public insurance and disaster programs when private insurance markets cannot absorb the full cost of catastrophic losses.

This creates an important economic chain:

Climate hazard → physical damage → insurance losses → government response → infrastructure spending → taxes, fees, and utility costs.

The household may never experience the original flood, wildfire, hurricane, or drought, yet it can still participate in paying the bill.

Rising Property and Maintenance Costs

Climate stress can also increase the cost of owning and maintaining a home.

More intense rainfall can require improved drainage. Stronger storms can increase demand for roofing and exterior repairs. Heat can accelerate deterioration of infrastructure and building materials. Flooding and wildfire risk can require additional mitigation measures.

At the same time, widespread disasters can create temporary shortages of construction materials, contractors, equipment, and skilled labor, increasing repair costs.

The Hidden Climate Cost

Taken together, these effects mean that climate change does not have to destroy your home to affect your household finances.

A household can experience climate-related costs through:

  • Higher grocery prices
  • Higher insurance premiums
  • Higher electricity and water bills
  • Higher taxes and public fees
  • Higher repair and maintenance costs

Together, these expenses create a growing household climate burden—even when a family never experiences a major climate disaster firsthand.

The important point is that climate change is not simply a collection of isolated disasters. It is increasingly an economic force that propagates through markets, insurance systems, government budgets, and household expenses.

For the average American household, this may ultimately be the most widespread way climate change is experienced: not as one catastrophic event, but as a persistent accumulation of additional costs.

2. Air Quality & Chronic Health: A Widespread Physical Exposure

Climate change also affects the quality of the air people breathe.

Wildfire Smoke

Wildfire smoke can travel hundreds or even thousands of miles, carrying fine particulate matter such as PM₂.₅ into communities far from the original fire.

These particles can penetrate deep into the respiratory system and aggravate existing respiratory and cardiovascular problems. As wildfire activity and smoke exposure increase in some regions, air-quality impacts are no longer limited to communities immediately adjacent to fires.

Longer Allergy Seasons

Warmer temperatures can alter plant growing seasons and extend periods of pollen production.

For people with asthma or seasonal allergies, longer or more intense pollen seasons can mean more days of symptoms, greater medication use, and reduced quality of life.

Heat Stress

Rising baseline temperatures also increase the frequency and duration of dangerous heat.

Homes without adequate cooling, outdoor workplaces, and communities with limited access to cooling resources can be particularly vulnerable. Extreme heat is not merely uncomfortable—it can place substantial physiological stress on the human body.


3. Grid & Utility Disruptions: Climate Stress on Essential Infrastructure

Modern households depend on electricity, water, transportation, telecommunications, and other infrastructure every day.

Climate extremes can place additional stress on these systems.

Power Grid Failures

Extreme heat can push electricity demand toward peak levels as households and businesses increase air-conditioning use.

At the same time, extreme weather can damage transmission lines, substations, transformers, and other infrastructure.

The consequences can range from higher electricity costs to localized outages and, under severe conditions, prolonged disruptions to essential services.

Water Scarcity

Drought can reduce reservoir levels, groundwater availability, and other sources of municipal water.

Communities may respond with conservation requirements, watering restrictions, infrastructure investments, or higher water costs.

Water stress can therefore become both an environmental problem and a household financial problem.


4. Acute Physical Damage: Catastrophic Where It Strikes

Floods, hurricanes, wildfires, severe thunderstorms, hail, and high winds can cause enormous damage to homes, vehicles, businesses, and infrastructure.

This category ranks fourth not because the damage is minor, but because exposure is geographically concentrated.

A household directly hit by a major disaster can experience losses vastly greater than those associated with ordinary climate-related inflation.

Floods and Flash Floods

Intense rainfall can overwhelm drainage systems and produce rapid flooding in locations that may not have traditionally been considered high-risk.

Coastal communities also face storm surge and rising sea levels that can increase the consequences of major storms.

Severe Hail and Wind

Severe convective storms can produce damaging hail and straight-line or tornadic winds.

Roofing, siding, windows, vehicles, and other property can be damaged within minutes, creating repair costs that are often compounded by rising construction and insurance expenses.

Wildfires

Wildfires can destroy homes and communities directly while also creating secondary effects through smoke, evacuation, infrastructure disruption, and insurance losses.


5. Vector-Borne Diseases: A Smaller but Expanding Risk

Climate change can also alter the geographic range and seasonal activity of disease-carrying organisms.

Tick-Borne Illnesses

Changes in temperature and seasonal conditions can affect the distribution and activity of ticks and their hosts.

In some regions, this may increase opportunities for exposure to Lyme disease and other tick-borne illnesses.

Mosquito-Borne Diseases

Changing temperature and precipitation patterns can also influence mosquito populations and the geographic conditions suitable for certain mosquito-borne diseases.

The importance of this category varies considerably by region, but changing environmental conditions can alter the boundaries of disease risk over time.

Other Pathogens

Environmental changes can also affect exposure to less common infectious diseases, including tularemia (rabbit fever), which can be transmitted through several pathways involving ticks, biting flies, infected animals, or contaminated environments.


The Basics: How Climate Change Reaches Your Household

Climate change may seem like a global-scale phenomenon, but its consequences increasingly arrive through very ordinary parts of daily life.

Your Wallet: A Rising Cost of Living

Climate change can function like a hidden cost multiplier, increasing expenses directly and indirectly.

  • Higher grocery bills: Weather extremes can disrupt agricultural production and food supply chains.
  • Higher insurance premiums: Increasing disaster losses can raise premiums, deductibles, and coverage costs.
  • Higher utility bills: Hotter temperatures increase cooling demand and electricity consumption.
  • Higher repair costs: Disasters can increase demand for construction materials, contractors, and replacement vehicles.
  • Higher infrastructure costs and taxes: Communities may need to spend more on flood protection, stormwater systems, water supplies, roads, and electrical infrastructure.

The result is that climate change does not need to destroy your house to affect your household finances.


Your Health: New Physical Strains

A warmer climate can change the environmental conditions in which people live.

Extended Allergy Seasons

Longer growing seasons and changing pollen patterns can increase exposure for people with seasonal allergies and asthma.

Heat Stress

More frequent and intense heat events increase risks of heat exhaustion, heatstroke, dehydration, and other heat-related illnesses.

Air Pollution

Wildfire smoke and other climate-related air-quality problems can expose people to unhealthy concentrations of fine particulate matter.

Vector-Borne Disease

Changing environmental conditions can alter the geographic and seasonal ranges of ticks, mosquitoes, and other disease vectors.


Your Environment: Infrastructure and Safety

Climate change also affects the physical systems surrounding your home.

Property Damage

Flooding, severe storms, wildfires, hail, and high winds can damage homes, vehicles, and personal property.

Travel Disruptions

Flooded roads, damaged bridges, severe storms, wildfire smoke, and extreme heat can disrupt transportation and cause delays.

Power and Water Reliability

Extreme heat, drought, storms, and other hazards can put additional pressure on electricity and water systems.

These disruptions can affect people even when their own property escapes direct physical damage.


What You Can Do

Climate change is a global problem, but households can take practical steps to reduce both personal vulnerability and unnecessary expense.

Audit Home Energy

Improve insulation, use efficient lighting and appliances, and manage heating and cooling more efficiently.

Prepare for Emergencies

Maintain a basic emergency kit, understand local flood and wildfire risks, and have a plan for prolonged power outages.

Protect Your Property

Keep gutters and drainage systems clear, maintain trees and vegetation around structures, and understand your property’s exposure to flooding, wind, wildfire, and other hazards.

Reduce Waste

Reducing food waste, conserving water, and using energy efficiently can lower household costs while reducing resource demand.

Know Your Insurance

Review deductibles, exclusions, flood coverage, and other policies before disaster strikes. Standard homeowners insurance does not necessarily cover every major climate-related hazard.


The Bottom Line

Climate change is often discussed in terms of distant environmental consequences, but for American households, the most immediate effects are increasingly personal and financial.

You may encounter climate change as:

a higher grocery bill,
a larger insurance premium,
a higher electric bill,
a smoky summer afternoon,
a longer allergy season,
a power outage,
a flooded road,
a damaged roof,
or a greater risk of heat stress.

The most dramatic climate disasters will continue to make the headlines. But the deeper transformation may be quieter: climate change is becoming embedded in the ordinary economics and infrastructure of everyday life.

The question is no longer simply what will climate change do to the planet?

It is increasingly:

What will climate change cost you?

bookmark_borderClimate Change and the Global Insurance Crisis: Rising Losses, Retreating Insurers, and the Growing Protection Gap

by Daniel Brouse

Climate change is fundamentally destabilizing insurance markets by driving increasingly severe financial losses, pushing premiums sharply higher, and causing insurers to reduce or withdraw coverage in some high-risk regions. As extreme weather events become more frequent and, in many cases, more intense, traditional underwriting models are being challenged by rapidly changing risk. The result is a growing transfer of financial risk from private insurers to consumers, businesses, lenders, and governments.

The Protection Gap Crisis

One of the clearest signs of growing insurance instability is the widening protection gap—the difference between total economic losses from disasters and the portion covered by insurance.

In many climate-vulnerable regions, the majority of disaster losses remain uninsured. The gap can be particularly severe in developing economies, where insurance penetration is low and households, businesses, and governments may lack the financial resources to recover from catastrophic events.

This creates a dangerous feedback loop:

More extreme losses → higher insurance costs → reduced coverage → greater uninsured losses → greater financial vulnerability

The protection gap is therefore not simply an insurance problem. It is increasingly a problem of household financial security, economic resilience, infrastructure recovery, and public finance.

Corporate Pullbacks From High-Risk Regions

Insurers are increasingly reassessing their exposure to regions where climate-related risks are becoming more difficult to price and manage.

In some high-risk markets, major insurers have stopped writing certain types of new business, declined to renew policies, restricted coverage, increased deductibles, or imposed substantially higher premiums. These trends have been especially visible in wildfire-prone areas of California and hurricane- and flood-exposed coastal regions.

When private carriers retreat, governments and state-sponsored insurance programs often become insurers of last resort. This can concentrate risk in public or quasi-public systems while leaving taxpayers increasingly exposed to catastrophic losses.

Systemic Financial Risks

Mortgage Market Threats

Property insurance is closely connected to the housing and banking systems because mortgage lenders generally require borrowers to maintain adequate insurance on the underlying property.

As premiums rise and coverage becomes more difficult to obtain, homeowners can face rapidly increasing housing costs even when their mortgage payment remains unchanged. In the most exposed markets, some properties may become effectively uninsurable or prohibitively expensive to insure.

This creates a potential chain reaction:

Climate risk → higher insurance costs → declining property affordability → falling property values → mortgage stress → increased financial-system risk

The burden can fall disproportionately on lower-income homeowners, who have less capacity to absorb sudden increases in insurance and other climate-related costs.

Macroeconomic Volatility

Rising insurance premiums can also contribute to broader economic volatility. Insurance is an input into housing, transportation, agriculture, construction, business operations, and investment.

When insurers raise premiums to reflect increased catastrophe risk, those costs can eventually be passed through to consumers in the form of higher rents, housing costs, food prices, transportation costs, and prices for other goods and services.

In particularly vulnerable areas, insurance costs can also influence where people are willing and able to live. If housing becomes prohibitively expensive to insure—or insurance becomes unavailable altogether—households and businesses may begin relocating toward less exposed regions.

Climate change can therefore contribute to climate-driven migration within countries and across regions, even before an area becomes physically uninhabitable.

Global Climate Insurance Disruption Ranking

The global property and casualty (P&C) insurance market is experiencing very different levels of stress depending on regional climate hazards, catastrophe exposure, insurance penetration, regulatory frameworks, and the capacity of governments to absorb residual risk.

The following ranking identifies major regions experiencing significant climate-driven insurance disruption, moving from the most acute and visible market stress toward regions where systemic pressures are emerging or are likely to intensify.

Global RankVulnerable RegionKey Impacted AreasPrimary Climate PerilsMarket Disruption LevelKey Insurance Market Impact
1North AmericaFlorida; California; Gulf CoastHurricanes, wildfires, severe convective storms, floodingCriticalMajor premium increases, restricted coverage, insurer withdrawals from selected markets, rising reliance on state-backed insurers and residual-market programs
2EuropeMediterranean coast; Central European flood basinsExtreme heat, wildfires, flooding, severe stormsSevereGrowing protection gaps in high-risk areas, rising catastrophe and reinsurance costs, increasing pressure on household and commercial insurance
3Asia-PacificCoastal China; Japan; eastern AustraliaTyphoons, sea-level rise, flooding, bushfiresHighIncreasing pressure on property and agricultural insurance, growing exposure of ports, supply chains, and coastal infrastructure
4Latin America & CaribbeanCaribbean island nations; coastal MexicoHurricanes, flooding, drought, extreme heatModerate to HighLarge uninsured disaster losses, limited insurance penetration, and growing dependence on international reinsurance and alternative risk-transfer mechanisms
5Sub-Saharan AfricaEast African Rift; southern African coastal zonesMulti-year droughts, flooding, extreme heat, severe stormsEmerging Systemic RiskVery low insurance penetration in many markets, substantial reliance on microinsurance, development finance, humanitarian assistance, and international climate-risk mechanisms

The Emerging Global Pattern

The geographic details differ, but the underlying pattern is increasingly similar:

Climate risk rises → catastrophe losses increase → insurers reassess risk → premiums rise or coverage contracts → the protection gap widens → households, businesses, and governments absorb more of the loss.

This represents a fundamental challenge to the traditional concept of insurability.

Insurance works most effectively when risks are sufficiently predictable, geographically diversified, and economically manageable. Climate change can undermine all three conditions simultaneously. When catastrophic risks become correlated across large geographic areas, historical loss data become less reliable as a guide to future exposure, and the cost of transferring risk through reinsurance increases.

The consequences extend well beyond the insurance industry.

A property that cannot be affordably insured can become difficult to finance. A home that cannot be financed can lose market value. A business that cannot obtain affordable coverage can become less competitive or relocate. A community facing repeated disasters can experience declining tax revenues while public recovery costs rise.

The insurance market is therefore becoming an increasingly important early-warning indicator of climate-driven financial stress.

What begins as a change in weather risk can ultimately become a problem involving housing, banking, inflation, public budgets, infrastructure, migration, and regional economic stability.

The question is no longer simply whether climate change is generating larger physical losses.

It is whether the global financial system can continue to price, distribute, and absorb those losses at a sustainable cost.

bookmark_borderConsumer Solar Panels

Michigan State University’s technology sounds amazing because it can turn almost any window into a power generator. However, there’s an inherent trade-off: allowing light to pass through the window means not absorbing the visible energy needed to generate electricity, which limits energy efficiency.

What may be even more promising are “balcony” solar panels. These systems can plug into existing outlets and feed electricity directly into a home, making solar generation possible without installing a traditional rooftop system. They’re becoming increasingly popular around the world.

Unfortunately, in the U.S., some utilities and regulatory policies are restricting or limiting their use.

Solar shingles have also been developed as an alternative to conventional rooftop solar panels. However, they have struggled to gain widespread market acceptance because integrating the solar technology into the roof can make it difficult to provide the same 20–30-year roofing warranty and long-term durability that traditional roofing systems can offer. The lack of a long-term guarantee can also make it more difficult to obtain the necessary homeowners insurance and mortgage approval, potentially creating complications when it comes time to sell the home.

This also applies to traditional rooftop solar panels. Solar panels do not replace the underlying roofing system, and replacing a roof after solar panels have been installed can be prohibitively expensive because the panels typically have to be removed and reinstalled.

In addition, some rooftop solar companies advertise “free installation,” but the homeowner may not actually own the system. Instead, the company retains ownership and places the homeowner under a long-term lease or power-purchase agreement. These agreements can complicate the sale of the property because the solar contract may need to be transferred to the buyer or paid off before the transaction can close.