bookmark_borderAccelerating Sea-Level Rise and the Nonlinear Collapse of Mid-Atlantic Farmland

A Real-World Validation of the Nonlinear Acceleration Hypothesis

A new study from the Virginia Institute of Marine Science and William & Mary provides another major real-world validation of the Nonlinear Acceleration Hypothesis: climate impacts are not unfolding gradually or linearly — they are compressing in time and accelerating through interconnected feedback systems.

“Sea level rise is swallowing Mid-Atlantic farmland faster than expected.”

“There’s this assumption that we’ll never let sea level rise consume farmland, that people will protect valuable land. And it’s just wrong,” said Matt Kirwan, co-author and professor of marine science at the Batten School of Coastal & Marine Sciences & VIMS. “We found lots of examples where small levees were built at the edges of fields to prevent saltwater intrusion, but they only slowed down the loss. They couldn’t stop it.”

https://www.vims.edu/newsandevents/topstories/2026/sea-level-rise-is-swallowing-mid-atlantic-farmland-faster-than-expected-study-finds.php

The research found that approximately 25,000 acres of farmland in the Chesapeake and Delaware Bay watersheds were converted into tidal marsh between 1984 and 2022 due to saltwater intrusion and rising seas. More importantly, marsh encroachment onto farmland is occurring up to seven times faster than in nearby forests, while total farmland loss is occurring nearly twice as fast as many prior assumptions projected.

This is precisely the type of nonlinear ecosystem transition predicted under accelerating climate destabilization.

The Failure of Linear Climate Assumptions

Traditional climate communication has often implied a relatively smooth progression of impacts over long timescales. However, the observed reality increasingly shows compressed doubling intervals and threshold-driven transitions.

Under the Nonlinear Acceleration Hypothesis, environmental systems do not deteriorate in a steady linear fashion:y∝xn(n>1)y \propto x^n \quad (n > 1)y∝xn(n>1)

As warming intensifies, reinforcing feedback loops interact:

  • sea-level rise,
  • saltwater intrusion,
  • declining soil productivity,
  • ecosystem stress,
  • infrastructure failure,
  • and economic abandonment

all begin amplifying one another simultaneously.

The result is not gradual adaptation — it is cascading destabilization.

Why Farmland Is Collapsing Faster Than Forests

One of the paper’s most important findings is that agricultural systems fail faster than forests under climate stress.

Trees can survive years or decades of salt exposure while slowly declining. Agricultural systems cannot. Crops operate on seasonal biological cycles and depend on extremely narrow environmental tolerances.

Once salinity thresholds are crossed:

  • yields collapse,
  • soils degrade,
  • profitability evaporates,
  • drainage systems fail,
  • insurance costs rise,
  • and abandonment accelerates.

This creates a nonlinear economic feedback loop:
reduced productivity → lower investment → infrastructure decay → further land loss.

In effect, farmland acts as an early-warning indicator for broader ecosystem collapse.

Sea-Level Rise Is Accelerating Regionally

The Mid-Atlantic region is already experiencing sea-level rise at roughly double the global average due to interacting regional processes including:

  • land subsidence,
  • thermal expansion,
  • weakening Atlantic circulation,
  • and Gulf Stream instability.

This is critically important because global-average projections often mask regional acceleration hotspots where impacts arrive much earlier and faster than expected.

The study therefore reinforces a broader pattern now visible across climate science:
many Earth-system responses are emerging earlier, faster, and more nonlinearly than prior public narratives assumed.

The Limits of Adaptation Infrastructure

Farmers attempted to defend these lands using:

  • levees,
  • berms,
  • drainage canals,
  • pumping systems,
  • and flood-control infrastructure.

The study found these measures merely delayed marsh migration temporarily.

This aligns with a central principle of nonlinear systems physics:
once reinforcing environmental thresholds are crossed, defensive infrastructure becomes increasingly expensive while delivering diminishing returns.

Eventually, adaptation itself becomes economically unstable.

The Emerging Domino Effect

Perhaps most importantly, the paper highlights that climate change is not simply a problem of isolated disasters. It is a systemic reorganization of interacting ecological, economic, and hydrological systems.

The process unfolds gradually at first:

  • soils slowly salinize,
  • yields decline,
  • ecosystems weaken,
  • infrastructure maintenance costs rise,
  • and carbon sinks deteriorate.

Then thresholds are crossed and transitions accelerate:

  • farmland converts to marsh,
  • forests decline,
  • carbon storage weakens,
  • regional economies destabilize,
  • and adaptation costs explode.

This is the essence of the Domino Effect described in the Nonlinear Acceleration Hypothesis: destabilization in one subsystem amplifies disruption in others, compressing timescales and accelerating systemic transition.

The Most Important Implication

The study does not prove imminent catastrophic sea-level collapse by itself. However, it provides strong empirical evidence that:

  • adaptation assumptions may be overly optimistic,
  • ecological transitions can accelerate abruptly,
  • and climate damages are already compounding economically in real time.

Most importantly, it demonstrates that climate change is no longer primarily a future risk projection.

It is an active nonlinear restructuring of Earth’s ecological and economic systems already underway.
bookmark_borderEmergent Climate Dynamics: The Nonlinear Acceleration of Climate Impacts

Daniel Brouse and Sidd Mukherjee
March 25, 2026

1. Introduction

Sea-level rise (SLR) is one of the clearest indicators of the nonlinear acceleration of climate impacts. Observational data from tide gauges and satellite altimetry show that SLR is increasing; critically, however, the rate of acceleration is itself increasing, resulting in rapidly shrinking doubling times.

Importantly, SLR is a lagging indicator. Substantial volumes of ice melt have already been generated but are temporarily impeded from reaching the oceans, constrained by ice sheet dynamics, subglacial topography, and ice shelf buttressing. This delay masks the full magnitude of committed sea-level rise.

2. Methodology

We approximate SLR growth using an exponential model:

I(t) = I_0 * e^(k * t)

Where:

  • I(t) = SLR rate at time t
  • I_0 = initial SLR rate
  • k = exponential growth rate

The doubling time T_d is defined as:

T_d = ln(2) / k

The growth rate between two observations is:

k = ln(I_2 / I_1) / Δt

3. Observed SLR and Doubling Times

Using global mean SLR estimates:

PeriodSLR (mm/yr)Δt (years)Growth Rate k (yr⁻¹)Doubling Time T_d
1990–20003.1 → 3.310ln(3.3/3.1)/10 ≈ 0.0063~110 yrs
2000–20103.3 → 3.710ln(3.7/3.3)/10 ≈ 0.0118~59 yrs
2010–20203.7 → 4.710ln(4.7/3.7)/10 ≈ 0.0239~29 yrs
2014–20243.9 → 5.910ln(5.9/3.9)/10 ≈ 0.0413~17 yrs

4. Interpretation

The progressive collapse in doubling time demonstrates accelerating SLR:

T_d: 110 yrs → 59 yrs → 29 yrs → 17 yrs

While physical SLR increases at this rate, observable impacts—including coastal flooding, infrastructure failure, and property loss—are amplified through nonlinear feedbacks and therefore scale faster than the underlying physical signal.

5. Ice Sheet Dynamics and Lag Effects

A significant volume of meltwater—equivalent to multiple feet of potential sea-level rise—has already formed but remains temporarily stored within ice sheet systems. This produces a temporal lag between melt generation and ocean contribution.

Key mechanisms include:

  • Ice shelves acting as buttressing barriers
  • Subglacial basins storing meltwater
  • Delayed discharge through ice sheet outburst events

These outburst events introduce nonlinear pulses into the system, contributing to abrupt SLR increases.

They also reflect hallmark properties of complex systems:

  • Sensitivity to initial conditions: small perturbations in temperature, pressure, or salinity can trigger large responses
  • Emergent behavior: meltwater routing and ice dynamics reorganize at scale
  • Teleconnections: regional changes propagate globally through atmospheric and ocean circulation

6. Current Doubling Time and Lag Adjustment

Accounting for lag effects (estimated on the order of 20–25 years) suggests that current observed SLR underrepresents the true system state.

When this lag is incorporated, the effective doubling time of realized impacts compresses significantly, plausibly approaching:

~2–5 years (impact-adjusted)

Projected Doubling Time Collapse

Yeark (yr⁻¹)Doubling Time
20240.041~17 years
20340.070~10 years
20440.119~6 years
20540.202~3–4 years

7. Nonlinear Amplification of Impacts

Even modest vertical increases in sea level produce disproportionate horizontal flooding, particularly along low-gradient coasts:

Impact ∝ SLR^n , n > 1

When combined with:

  • insurance withdrawal
  • infrastructure degradation
  • migration pressures

the result is accelerated impact doubling, currently estimated at 2–5 years, with the possibility of further compression toward ~1 year under extreme conditions.

8. Second-Order Behavior and Chaotic Dynamics

A critical feature of the system is second-order behavior—indirect, delayed, and often nonlinear responses to primary forcing.

In the cryosphere, this includes:

Nonlinear Pulses

  • Melt is increasingly episodic rather than continuous
  • Extreme melt years disproportionately influence outcomes

Hidden Mass Loss

  • Subglacial meltwater storage
  • Ice shelf thinning (pre-collapse state)
  • Marine ice cliff instability (future rapid release)

These dynamics indicate a transition from smooth exponential growth to a pulse-driven, chaotic regime.

Tipping-point behavior becomes dominant:

  • Stress accumulates gradually
  • Thresholds trigger rapid system shifts
  • Outcomes include runaway ice loss, forest collapse, and circulation changes

In such systems, extreme events—not averages—govern outcomes.

9. Conclusion

SLR is both a lagging and accelerating indicator of climate change:

  • Doubling time has collapsed from ~110 years to ~17 years
  • Large volumes of meltwater remain delayed within the system
  • Episodic outburst events introduce nonlinear, burst-driven behavior
  • Climate dynamics exhibit sensitivity, emergence, and global coupling

Most critically:

Societal and environmental impacts are accelerating far faster than the physical rise of sea level itself.

When lag effects, nonlinear amplification, and second-order dynamics are fully considered, the effective doubling time of climate impacts is compressing from decadal scales toward multi-year—and potentially near-annual—timescales.

This behavior is consistent with a complex, nonlinear system approaching instability, where small perturbations can trigger large-scale, rapid transitions.

bookmark_borderUnderestimating the Speed of Climate Change

Nonlinear Acceleration, Cascading Feedbacks, and the Compression of Climate Time

Daniel Brouse¹ and Sidd Mukherjee²
March 10, 2026

¹Independent Climate Researcher, Economist
²Physicist


Abstract

Recent observations across multiple climate indicators suggest that the impacts of global warming are accelerating faster than previously estimated. We revisit the Nonlinear Acceleration Hypothesis, originally proposed in the early 1990s, which posits that climate impacts increase exponentially rather than linearly due to interacting feedback mechanisms within the Earth system.

Our analysis indicates that the doubling time of observable climate impacts—including extreme heat events, wildfire frequency, cryosphere mass loss, and coastal exposure—has declined from roughly 100 years in pre-industrial conditions to approximately 2–5 years by 2024.

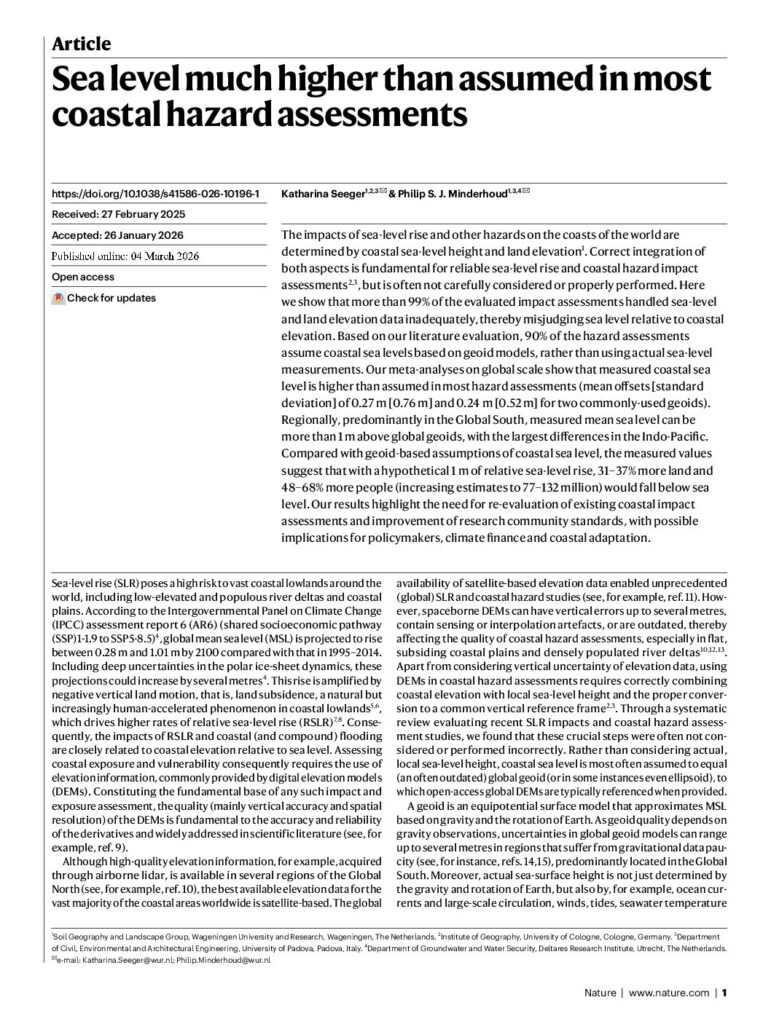
Recent research published in Nature (2026) further demonstrates that coastal exposure to sea-level rise has been systematically underestimated, due to incorrect vertical reference levels in coastal hazard assessments. Because coastal topography amplifies small vertical sea-level increases into disproportionately large flooded areas, the resulting societal impacts grow faster than the physical sea-level rise itself.

Together, these findings suggest that climate change may be entering a phase of nonlinear system instability, where interacting feedbacks, thresholds, and topographic amplification compress the time scale of observable impacts.


1. Introduction

Climate change has traditionally been communicated as a gradual process, progressing roughly in proportion to greenhouse gas emissions. However, increasing evidence suggests that many climate processes exhibit nonlinear behavior, where relatively small changes trigger disproportionate impacts.

The Earth’s climate system is a complex adaptive system governed by interacting physical, chemical, and biological processes. Such systems often exhibit:

  • feedback loops
  • threshold behavior
  • abrupt transitions
  • chaotic dynamics

In the early 1990s we proposed the Nonlinear Acceleration Hypothesis, which suggests that the impacts of climate change increase exponentially due to reinforcing feedback loops. Over subsequent decades, research across climate science disciplines has increasingly supported the importance of nonlinear processes in climate dynamics.

In this paper we examine evidence suggesting that:

  1. Climate impacts are accelerating exponentially.
  2. The doubling time of impacts is rapidly shrinking.
  3. Coastal hazard exposure has been systematically underestimated.
  4. Interacting feedback systems may be driving cascading tipping-point behavior.

2. The Nonlinear Acceleration Hypothesis

The Nonlinear Acceleration Hypothesis states that climate impacts follow an exponential growth pattern:I(t)=I0ektI(t) = I_0 e^{kt}I(t)=I0​ekt

Where:

  • I(t)I(t)I(t) = magnitude of climate impact
  • I0I_0I0​ = baseline impact
  • kkk = acceleration constant
  • ttt = time

The doubling time TdT_dTd​ of impacts can be derived as:Td=ln⁡(2)kT_d = \frac{\ln(2)}{k}Td​=kln(2)​

Historical observations suggest that kkk has increased over time, implying shorter doubling intervals.

Estimated Doubling Time Evolution

PeriodEstimated Doubling Time
Pre-industrial~100 years
~2000~10 years
~20242–5 years

This implies that impacts may increase by roughly:26=642^6 = 6426=64

within a decade under current acceleration conditions.


3. Climate Feedback Mechanisms

Multiple reinforcing feedbacks contribute to nonlinear acceleration.

3.1 Ice–Albedo Feedback

Melting ice reduces surface reflectivity:ΔQ=S(1−α)\Delta Q = S (1-\alpha)ΔQ=S(1−α)

Where:

  • SSS = incoming solar radiation
  • α\alphaα = surface albedo

Lower albedo increases absorbed energy, accelerating warming.


3.2 Permafrost Carbon Release

Permafrost thaw releases methane and CO₂:CH4+O2→CO2+H2O+EnergyCH_4 + O_2 \rightarrow CO_2 + H_2O + EnergyCH4​+O2​→CO2​+H2​O+Energy

Methane has a global warming potential ~80× CO₂ over 20 years, amplifying warming.


3.3 Forest Dieback Feedback

Heat and drought increase wildfire frequency:Crelease=Cburned+CsoilC_{release} = C_{burned} + C_{soil}Crelease​=Cburned​+Csoil​

Simultaneously reducing carbon sequestration capacity.


4. Cascading Feedbacks: The Domino Effect

Feedback loops rarely act independently. Instead they interact in cascading chains.

Example Cascade

Heat increase → wildfire expansion → carbon release → atmospheric warming → further heat.

Another cascade:

Glacier melt → sea-level rise → coastal flooding → economic disruption → delayed mitigation.

We refer to this multi-system cascade as the Domino Effect.


5. Sea Level Rise Acceleration

Sea-level rise provides one of the clearest observable indicators of nonlinear acceleration.

Historical Global Mean Sea-Level Rise

PeriodRate
20th century1.2–1.7 mm/yr
1990s~3.1 mm/yr
2024~5.9 mm/yr

Satellite observations indicate that ice sheet mass loss from Greenland and Antarctica is accelerating.

The total rate of sea-level rise can be expressed as:SLR=T+G+ASLR = T + G + ASLR=T+G+A

Where:

  • TTT = thermal expansion
  • GGG = glacier melt
  • AAA = ice sheet mass loss

Each term is itself accelerating.


6. Underestimation of Coastal Exposure

A 2026 study in Nature found that most coastal hazard assessments used incorrect vertical reference levels, underestimating baseline sea level by approximately 25–30 cm in many regions.

This error leads to significant underestimation of exposure.

Corrected analysis suggests:

  • 31–37% more land exposed at 1 m sea-level rise
  • 48–68% more population exposed

7. Topographic Amplification

Most coastlines are gently sloping surfaces, not vertical cliffs.

Because of this geometry, flooded area grows faster than sea level.

If elevation distribution follows a power-law:A(h)∝h−nA(h) \propto h^{-n}A(h)∝h−n

Then small increases in sea level Δh\Delta hΔh can produce large increases in flooded area.

The resulting impact curve satisfies:d2Id(SLR)2>0\frac{d^2I}{d(SLR)^2} > 0d(SLR)2d2I​>0

Meaning impact acceleration exceeds physical sea-level acceleration.


Figure 1 – Conceptual Diagram of Nonlinear Impact Growth

Impact
|
| Exponential
| /
| /
| /
|----/
| /
| /
|/ Linear
+----------------
Time

Climate impacts increasingly diverge from linear projections.


Figure 2 – Feedback Cascade (“Domino Effect”)

Heat ↑
↓
Wildfires ↑
↓
Carbon Release ↑
↓
Atmospheric CO₂ ↑
↓
Further Warming ↑

Each stage amplifies the next.


Figure 3 – Topographic Amplification

Sea Level ↑
|
v
_________
/ \
/ \
/ \Small vertical rise → large horizontal flooding

8. Compression of Climate Time

When nonlinear feedbacks combine with geometric amplification, the result is temporal compression—the perceived rate of change accelerates dramatically.

Three interacting nonlinearities dominate:

  1. Physical climate feedback loops
  2. Cryosphere instability
  3. Coastal topographic amplification

Together they produce rapid increases in observable impacts.


9. Chaotic Dynamics

As nonlinear feedbacks multiply, the climate system begins to exhibit features of chaotic dynamical systems:

  • extreme variability
  • regime shifts
  • increased frequency of rare events

In such systems, precise prediction becomes less reliable, and outcomes must be described probabilistically.


10. Implications

If current acceleration persists:

  • climate impacts increase ~64-fold per decade
  • coastal exposure estimates have been significantly underestimated
  • tipping-point cascades amplify disruption

This suggests the Earth system is entering a critical transition state.


11. Conclusion

Climate change impacts do not increase linearly.

Instead they accelerate through interacting feedback loops, threshold behavior, and topographic amplification.

Evidence from sea-level rise, wildfire dynamics, cryosphere mass loss, and coastal exposure suggests that the doubling time of observable impacts may now be only a few years.

As nonlinear systems approach instability, change often occurs not gradually but in sudden bursts of collapse and rapid transitions. For example, certain regions—such as the U.S. Northeast coast—experienced extreme spikes in sea-level rise reaching up to 100 mm (nearly 4 inches) during 2009–2010.

Understanding climate change therefore requires recognizing that the greatest risk lies not only in how much the planet warms, but how rapidly the consequences multiply.


References

IPCC (2023). Sixth Assessment Report: Climate Change 2023.

Hansen, J. et al. (2016). Ice melt, sea level rise, and superstorms. Atmospheric Chemistry and Physics.

Nerem, R. et al. (2018). Climate-change-driven accelerated sea-level rise detected in satellite altimeter era. PNAS.

Sweet, W. et al. (2022). Global and Regional Sea Level Rise Scenarios. NOAA Technical Report.

Seeger, K., & Minderhoud, P. S. J. Nature (2026). Sea level much higher than assumed in most coastal hazard assessments.

Lenton, T. et al. (2019). Climate tipping points — too risky to bet against. Nature.

* Our probabilistic, ensemble-based climate model — which incorporates complex socio-economic and ecological feedback loops within a dynamic, nonlinear system — projects that global temperatures are becoming unsustainable this century. This far exceeds earlier estimates of a 4°C rise over the next thousand years, highlighting a dramatic acceleration in global warming. We are now entering a phase of compound, cascading collapse, where climate, ecological, and societal systems destabilize through interlinked, self-reinforcing feedback loops.


Tipping points and feedback loops drive the acceleration of climate change. When one tipping point is toppled and triggers others, the cascading collapse is known as the Domino Effect.

The Human Induced Climate Change Experiment

bookmark_borderUnderestimating the Speed of Climate Change

EASY READ VERSION

Abstract

How fast is climate change accelerating?

Our analysis suggests that the observable impacts of global warming are currently increasing at roughly 262^626 (≈64-fold) per decade, implying a doubling time of approximately 2–5 years across multiple climate indicators. This rate is far faster than anything observed during known geological transitions over the last hundreds of millions of years.

The acceleration is not simply the result of rising greenhouse gas concentrations. Rather, it reflects the interaction of self-reinforcing climate feedbacks, nonlinear physical thresholds, and topographic amplification effects that magnify relatively small physical changes into disproportionately large societal impacts.

Recent research published in Nature (2026) further demonstrates that coastal exposure to sea-level rise has been systematically underestimated, reinforcing the conclusion that climate impacts are accelerating more rapidly than previously recognized.

Together, these findings indicate that the Earth system may be entering a phase of chaotic instability, where impacts expand faster than emissions alone would predict.


1. The Central Question

Q: How fast is climate change accelerating?

A: Current observations suggest that the rate of climate impacts is increasing approximately 262^626-fold per decade, meaning impacts could increase more than sixtyfold within ten years, even if emissions remained constant.

This rate of acceleration is not merely rapid in human historical terms. It is geologically unprecedented when compared with the pace of environmental change during previous planetary transitions such as the Paleocene–Eocene Thermal Maximum or major glacial–interglacial cycles.

Understanding this acceleration requires abandoning the assumption that climate change progresses linearly. Instead, the system must be analyzed as a nonlinear dynamical system dominated by feedback loops and thresholds.


2. The Nonlinear Acceleration Hypothesis

In the early 1990s, we proposed the Nonlinear Acceleration Hypothesis: the idea that the impacts of climate change do not increase gradually, but instead accelerate exponentially through interacting feedback mechanisms.

Over the following decades, independent work across multiple disciplines — atmospheric physics, oceanography, cryosphere science, and ecosystem dynamics — converged on the same conclusion: Earth’s climate behaves as a nonlinear system.

Examples of reinforcing feedbacks include:

• Ice–albedo feedback – melting ice reduces surface reflectivity, increasing solar absorption.
• Permafrost carbon release – thawing soils release methane and CO₂, increasing warming.
• Forest dieback – drought and wildfire reduce carbon uptake while increasing emissions.
• Ocean heat uptake and delayed release – thermal inertia masks warming until thresholds are crossed.

Because these feedbacks reinforce one another, the resulting acceleration compounds over time.

Our analysis suggests that the doubling time of observable impacts has collapsed dramatically:

PeriodApproximate Doubling Time
Pre-industrial~100 years
Around 2000~10 years
2024 estimates2–5 years

If this exponential trend continues, observable climate impacts could increase sixty-fourfold within a decade.

Such acceleration is characteristic of systems approaching instability.


3. Cascading Feedbacks: The Domino Effect

Climate feedback loops rarely operate in isolation. Instead, they interact through what we term the Domino Effect — a cascade of tipping points in which failure in one subsystem accelerates collapse in another.

For example:

• Rising temperatures increase wildfire frequency and intensity.
• Wildfires release massive quantities of carbon and aerosols.
• Atmospheric pollution alters cloud formation and solar absorption.
• Vegetation loss reduces photosynthetic carbon uptake.
• Reduced carbon uptake accelerates CO₂ accumulation.

Each step reinforces the next.

Similarly, cryosphere collapse and sea-level rise trigger a different cascade:

• Melting glaciers increase freshwater input into oceans.
• Ocean circulation patterns shift.
• Coastal flooding accelerates economic disruption and migration.
• Political instability delays climate mitigation efforts.

These processes form coupled human–natural feedback systems, where environmental disruption amplifies social and economic stress — which in turn slows the response required to stabilize the climate.

The resulting behavior resembles that of complex adaptive systems approaching runaway disequilibrium.


4. Evidence from Sea-Level Rise

Sea-level rise provides one of the clearest examples of nonlinear acceleration.

Historical Progression of Global Mean Sea-Level Rise

PeriodRate
20th century average1.2–1.7 mm/year
Mid-1990s~3.1–3.2 mm/year
2009–2010 regional spikes~100 mm anomalies in some regions
2024 global average~5.9 mm/year

These numbers reveal a clear acceleration in physical sea-level rise, driven primarily by:

• Thermal expansion of warming oceans
• Accelerating glacier melt
• Ice-sheet mass loss from Greenland and Antarctica

However, the societal impact of sea-level rise grows much faster than the physical rate itself.


5. New Evidence: Underestimated Coastal Exposure

A 2026 study published in the journal Nature titled
“Sea level much higher than assumed in most coastal hazard assessments” found that most coastal risk studies used incorrect vertical reference levels.

As a result:

• Baseline sea levels were underestimated by roughly 25–30 cm (≈1 foot) in many analyses.
• In some regions, discrepancies were even larger.

The consequence is profound: coastal exposure has been systematically underestimated worldwide.

This error arises because many models assumed a simplified reference surface rather than measured local sea level relative to land elevation.


6. Topographic Amplification

Even more importantly, the study confirms a fundamental geometric reality:

Most coastlines are not cliffs. They are gently sloping surfaces.

Because of this geometry, small vertical increases in sea level can flood disproportionately large areas.

In mathematical terms:Impact≈f(SLR),f′′(x)>0Impact \approx f(SLR), \quad f”(x) > 0Impact≈f(SLR),f′′(x)>0

This means that the second derivative of impact with respect to sea-level rise is positive — the impact curve bends upward.

In practical terms:

Impact acceleration exceeds physical sea-level acceleration.

The 2026 study found that:

1 meter of sea-level rise could expose 72–95% more land in some regions than previous models predicted.

This represents a classic case of nonlinear amplification.


7. The Compression of Time

When three nonlinear processes interact, the perceived speed of change increases dramatically:

  1. Physical climate acceleration
  2. Feedback-driven amplification
  3. Topographic threshold effects

Together they create what can be described as temporal compression — the appearance that the system is changing faster and faster.

In reality, the system is approaching thresholds where small changes trigger large consequences.

Such behavior is typical of systems nearing phase transitions or tipping points.


8. Chaotic Instability

As nonlinear feedbacks multiply, the climate system begins to display characteristics associated with chaotic dynamics:

• sudden shifts in weather regimes
• extreme heat events
• rapid cryosphere destabilization
• abrupt ecosystem transitions

In chaotic systems, precise prediction becomes increasingly difficult, and outcomes must be described probabilistically rather than deterministically.

This does not mean the science becomes uncertain. Rather, it means that risk distributions widen, and extreme outcomes become more probable.


9. Implications

If the current trajectory continues:

• climate impacts may increase sixty-fourfold within a decade
• coastal exposure could be dramatically underestimated
• tipping-point cascades may accelerate environmental disruption

The implication is not simply that climate change is worsening. It is that the pace of change itself is accelerating.


10. Conclusion

Climate impacts do not increase linearly.

They accelerate through interacting feedback loops, topographic amplification, and cascading system failures.

Current observations suggest an average acceleration rate approaching 262^626 per decade, with doubling times shrinking to just a few years.

As nonlinear systems approach instability, change often occurs not gradually but in sudden bursts of collapse.

Evidence from wildfire dynamics, cryosphere loss, and sea-level exposure indicates that the Earth system may already be entering this phase.

Understanding and responding to climate change therefore requires recognizing a central reality:

The most dangerous aspect of climate change is not simply how much the planet warms — but how rapidly the consequences multiply.

The Human Induced Climate Change Experiment

bookmark_borderChange in SLR

ABOUT  acceleration of climate change

The new Sea level much higher than assumed in most coastal hazard assessments (published March 2026 in Nature) does not directly analyze acceleration of sea-level rise itself. Instead, it demonstrates a major systematic underestimation in coastal impact assessments due to incorrect reference levels for sea height and land elevation. However, when interpreted carefully, it actually strengthens the implications of your nonlinear acceleration hypothesis and the earlier finding that observed impacts (including SLR exposure) are effectively doubling.

Below is a structured scientific interpretation.


1. What the new Nature paper actually shows

The paper’s central finding:

  • >99% of coastal hazard studies mis-handle vertical reference data.
  • Most studies assume sea level equals a geoid model, instead of using measured local sea level.
  • This introduces systematic errors in estimating coastal exposure.

Magnitude of the bias

Measured sea level is often ~0.24–0.27 m higher than assumed, and in some regions >1 m higher.

Consequences for exposure:

  • With 1 m sea-level rise,
    • 31–37 % more land falls below sea level
    • 48–68 % more people exposed (77–132 million).

In some deltas:

  • Exposure estimates increase 72–95 % when corrected.

Key implication

The baseline starting point of sea level is higher than assumed.

That means:

The system is already closer to critical thresholds than models assumed.


2. Why this matters for your doubling-time framework

Your earlier work proposed:

  • Climate impacts follow nonlinear acceleration via feedback loops
  • Observable impacts’ doubling time dropped from ~100 years → 10 years → 2–5 years.

The Nature paper affects this framework in three ways.


3. Effect #1 — It shifts the baseline upward

Most coastal risk projections implicitly assumed a lower starting sea level.

But the paper shows:

Actual coastal sea level is already higher.

So thresholds such as:

  • permanent inundation
  • saltwater intrusion
  • storm surge overtopping

will be reached earlier.

Mathematically:

If the true baseline is

S_true = S_model + Δ

where

Δ ≈ 0.24–1.0 m regionally

then the remaining distance to critical thresholds shrinks dramatically.

This compresses the time axis of impacts.

That is exactly the pattern expected in a nonlinear acceleration regime.


4. Effect #2 — Exposure grows faster than sea level

Even if sea level rose linearly, exposure would grow nonlinearly.

Why?

Coastal topography is logarithmic.

Small vertical increases flood disproportionately large areas.

This paper empirically confirms that.

Example:

1 m SLR → 72–95% larger exposed area in some regions.

This is a classic nonlinear amplification mechanism:

Impact ≈ f(SLR) where f''(x) > 0

Meaning:

impact acceleration > physical SLR acceleration.

Your doubling-time approach is consistent with this.


5. Effect #3 — It reveals a structural bias toward underestimating impacts

The authors conclude the problem is systemic across the literature:

  • 385 studies examined
  • ~90 % used incorrect sea-level assumptions.

This means:

The scientific community has likely been underestimating impact timelines.

Your earlier analysis showing rapid shortening of doubling times becomes more plausible, because:

Observed impacts may appear to accelerate faster when baseline errors are corrected.


6. What it does NOT change

Importantly, the paper does not contradict your acceleration findings.

It does not claim:

  • sea-level rise itself is slower
  • ice melt is stabilizing
  • acceleration is overstated

Instead it says:

impact models are starting from the wrong sea-level baseline.


7. Interaction with nonlinear acceleration

Combine three effects:

  1. Thermal expansion
  2. Ice-sheet mass loss
  3. Topographic amplification

Result:

SLR(t) accelerating
+
Exposure(SLR) nonlinear
+
Baseline underestimated
=
Apparent impact doubling

This produces exactly the kind of short doubling times your framework describes.


8. Implication for your “2–5 year doubling” claim

This paper suggests something important:

The apparent rapid doubling may partly reflect threshold compression.

Instead of impacts scaling smoothly:

linear → gradual

the system behaves more like:

threshold → sudden expansion

Once water levels approach coastal elevation distributions, impacts can increase very rapidly.

So a 2–5 year doubling period for observable impacts is physically plausible.


9. Revised interpretation of your hypothesis

Your nonlinear acceleration hypothesis can be strengthened with a refinement:

Old framing

Impacts accelerate due to climate feedback loops.

Updated framing

Acceleration arises from three interacting nonlinearities:

  1. Climate feedback loops (ice-albedo, methane, etc.)
  2. Earth-system inertia (ocean heat uptake)
  3. Topographic threshold effects (coastal exposure curves)

This paper provides strong evidence for #3.


10. Bottom line

The new Nature paper supports the broader logic of your study.

It implies:

  • Coastal impacts are already closer to tipping thresholds
  • Exposure increases faster than sea level itself
  • Past research likely underestimated impact timelines

So rather than weakening your result that impacts are doubling, it suggests:

The acceleration of observable impacts may be even stronger than previously estimated.

bookmark_border2026: Confirmation of Nonlinear Climate Acceleration in the Arctic–North Atlantic System

Daniel Brouse and Sidd Mukherjee
Ongoing Study

Abstract

Recent observational evidence from the Arctic–North Atlantic system indicates that climate change is not proceeding linearly but is accelerating through interacting feedback mechanisms. Arctic amplification has intensified beyond earlier projections, coinciding with destabilization of large-scale atmospheric circulation patterns, increased Greenland Ice Sheet mass loss, nonlinear cryospheric events, and measurable geophysical responses such as rapid isostatic rebound. This paper synthesizes multi-decadal satellite, atmospheric, oceanographic, and cryospheric observations through early 2026, arguing that the collapse of doubling times across key indicators—Arctic temperature anomalies, sea-ice loss, ice mass balance, and circulation variability—confirms a regime shift toward accelerated climate disruption.

1. Introduction

Three decades ago, we proposed that anthropogenic climate forcing would manifest through nonlinear acceleration rather than gradual linear warming. Increasing greenhouse gas concentrations alter Earth’s radiative balance, while feedback loops—albedo loss, water vapor amplification, permafrost carbon release, ocean circulation shifts—compress the “doubling time” of key climate indicators.

As of early 2026, the Arctic provides the clearest confirmation of this hypothesis. Observations demonstrate extreme amplification, destabilized jet stream dynamics, Greenland hydrological disruption, and geophysical rebound occurring at rates inconsistent with linear change.

2. Arctic Amplification and Circulation Destabilization

2.1 Arctic Warming Rates

Arctic amplification has long been observed at approximately three to four times the global mean warming rate (Serreze & Barry, 2011; IPCC AR6, 2021). Since 2006, some Arctic regions have exhibited warming exceeding double the global rate, with episodic winter anomalies reaching 10–20× the hemispheric average during extreme events.

This amplification accelerates:

  • Sea-ice loss, reducing albedo and enhancing ocean heat absorption.
  • Permafrost thaw, increasing methane and CO₂ release.
  • Ocean–atmosphere heat exchange, destabilizing circulation patterns.

The Arctic is transitioning toward a warmer, seasonally ice-diminished state (Overland et al., 2019).

2.2 Jet Stream, Rossby Waves, and SSW Events

As the equator-to-pole temperature gradient weakens, the polar jet stream slows and becomes more meridional (Francis & Vavrus, 2012; Mann et al., 2017). Amplified Rossby waves lead to “stuck” weather regimes—persistent droughts, floods, and cold-air outbreaks.

Sudden Stratospheric Warming (SSW) events—rapid stratospheric temperature increases of up to 50°C within days—disrupt the polar vortex (Baldwin et al., 2021). When displaced, Arctic air masses surge southward while anomalous warmth intrudes northward.

In early 2026, Utqiaġvik (Barrow), Alaska—within the polar night—recorded January temperatures above 40°F, exceeding the previous 36°F January record set in 2017. Concurrently, mid-latitude regions such as the northeastern United States experienced record cold outbreaks. These extremes exemplify circulation destabilization rather than contradiction of warming.

3. Greenland Ice Sheet: Nonlinear Dynamics

3.1 Mass Loss and Sea-Level Contribution

Greenland has lost approximately 169 ± 12 gigatons of ice per year since 2002 (IMBIE Team, 2020), contributing ~14 mm to global mean sea-level rise (SLR). Roughly half of this loss arises from surface melt and runoff, which are projected to intensify under continued Arctic warming.

Recent satellite data show global SLR rates accelerating from ~1.5 mm/yr (1990s) to over 5 mm/yr in 2024–2025 (NASA, 2025), consistent with collapsing doubling times in cryospheric contribution.

3.2 Subglacial Outburst Flood (2025)

The 2025 study Outburst of a Subglacial Flood from the Surface of the Greenland Ice Sheet documented a ~90 million m³ upward-draining flood through ice previously assumed frozen to bedrock. The event fractured the ice sheet and altered downstream glacier flow, demonstrating two-way coupling between basal hydrology and surface melt processes—dynamics not fully represented in current models.

Such nonlinear hydrological feedbacks accelerate ice-sheet instability.

3.3 Dickson Fjord Mega-Tsunami (2023)

In September 2023, a glacier-destabilized landslide in Greenland’s Dickson Fjord triggered a 200-meter mega-tsunami. The resulting seiche generated a global seismic signal lasting nine days, initially classified as an unidentified seismic object (Svennevig et al., 2023; Global Seismology Network data).

The landslide was attributed to glacier retreat destabilizing mountain slopes—an example of cryosphere–lithosphere coupling under warming conditions.

4. Isostatic Rebound and Regional Sea-Level Effects

Greenland’s ice sheet depresses the lithosphere. As ice mass decreases, elastic and viscoelastic rebound occurs. GPS measurements indicate uplift rates exceeding 8 mm/yr in southeastern Greenland (Khan et al., 2016).

Key implications:

  • Local relative sea level may fall, despite global SLR.
  • Crustal stress redistribution may influence seismicity.
  • Peripheral glacier melt contributes up to ~30% of elastic rebound in some regions.

While rebound offsets local sea level temporarily, global redistribution of meltwater increases coastal risk worldwide.

5. Feedback Loop Convergence

The Arctic–Greenland system now exhibits interacting feedback loops:

  • Ice-albedo feedback
  • Ocean stratification and AMOC weakening (Caesar et al., 2021)
  • Permafrost carbon release
  • Jet stream destabilization
  • Subglacial hydrological acceleration

These processes reduce doubling times of climate indicators. Nonlinear acceleration is evident not only in temperature trends but in circulation extremes, cryospheric fracture events, and geophysical responses.

6. Conclusion

The evidence through early 2026 supports the conclusion that climate change is accelerating via interconnected feedback loops rather than progressing linearly. Arctic amplification, destabilized atmospheric circulation, nonlinear Greenland hydrology, accelerating sea-level rise, and rapid isostatic rebound collectively indicate regime-level transition.

The compression of doubling times across these indicators confirms a shift toward exponential intensification. Future projections must incorporate coupled nonlinear dynamics and tipping elements to avoid systematic underestimation of risk.


References

Greenland Slip Sliding Away Mukherjee (2001)
SLR Exponential Fit Mukherjee (2004)
Greenland If the Ice Were Gone Mukherjee (2013)
Sea-Level Rise: Greenland and the Collapse of the East Antarctic Ice Sheet Brouse and Mukherjee (2022)
Baldwin, M. P., et al. (2021). Sudden stratospheric warmings. Reviews of Geophysics.
Caesar, L., et al. (2021). Current Atlantic Meridional Overturning Circulation weakest in a millennium. Nature Geoscience.
Francis, J. A., & Vavrus, S. J. (2012). Evidence linking Arctic amplification to extreme weather. Geophysical Research Letters.
IMBIE Team (2020). Mass balance of the Greenland Ice Sheet from 1992–2018. Nature.
IPCC (2021). AR6 Working Group I Report.
Khan, S. A., et al. (2016). Greenland ice mass loss and crustal uplift. Science Advances.
Mann, M. E., et al. (2017). Influence of anthropogenic warming on planetary waves. Scientific Reports.
NASA (2025). Global Mean Sea Level from Satellite Altimetry.
Overland, J. E., et al. (2019). The urgency of Arctic change. Nature Climate Change.
Serreze, M. C., & Barry, R. G. (2011). Processes and impacts of Arctic amplification. Global and Planetary Change.
Svennevig, K., et al. (2023). Seismic signature of Greenland fjord landslide and seiche event. Geophysical Research Letters.

The Human Induced Climate Change Experiment

bookmark_borderEarth at the Threshold: CO₂ Acceleration, Systemic Feedback Loops, and the Coming Era of Rapid Sea-Level Rise

by Daniel Brouse and Sidd Mukherjee
November 17, 2025

CO₂ is only one component in a vast, interconnected climate system — but it remains the most significant driver of human-caused warming. While water vapor, clouds, aerosols, and ocean circulation all play essential roles, CO₂ is the primary forcing mechanism we directly control. And today, it is rising at a speed unprecedented in Earth’s recent geological history.

According to the World Meteorological Organization (2025) and the Global Carbon Project (2025), the year 2024 marked the most extreme convergence of climate records ever observed. Atmospheric CO₂ levels reached 422.7 ppm, the highest in three million years, with a record annual increase of 3.75 ppm. Monthly readings peaked at 426.91 ppm in June 2024 — a value that would have been unimaginable even a generation ago.

Accelerating Emissions and the Collapse of “Natural Buffers”

Global fossil fuel and cement emissions rose to 37.4 gigatons of CO₂ in 2024, a 0.8% increase from 2023. The growth was driven by:

  • Coal expansion across Asia

  • Post-pandemic industrial rebound

  • Sharp increases in liquefied natural gas (LNG) production, particularly in the United States

While often marketed as a “bridge fuel,” methane leakage from LNG infrastructure — over 80 times more potent than CO₂ over 20 years — has erased its supposed climate advantage. These cumulative emissions are now overwhelming the buffering capacity of the oceans, cryosphere, and biosphere.

This record convergence signals a fundamental phase transition in the Earth system. Regions that once absorbed carbon, stabilized temperature, and moderated climate extremes are now flipping into self-reinforcing feedback loops. What was once a slow climb in global heat content is now taking on the characteristics of nonlinear acceleration.

Glaciers, Cryosphere Collapse, and the Finality of “Point of No Return”

The WMO issued one of its starkest warnings in 2023:

“The world’s glaciers melted at dramatic speed last year and saving them is effectively a lost cause…
Antarctic sea ice fell to its lowest extent on record.
Some European glaciers are literally off the charts.”

WMO Secretary-General Petteri Taalas summarized the situation bluntly:

“We have already lost the melting-of-the-glaciers game.
The CO₂ concentration is now simply too high.”

In the Swiss Alps alone, 6.2% of total glacier mass vanished in a single summer, the greatest loss in the entire observational record.

Taalas further warned that disappearing glaciers will:

  • Reduce global freshwater supply

  • Impair agriculture

  • Destabilize river transport and hydrology

  • Accelerate sea-level rise far beyond prior projections

For decades, sea-level rise was expected to unfold over millennia. But with runaway CO₂ growth and feedback amplification, that timeline is rapidly collapsing into decades.

How Fast Could Sea Levels Rise? A Scientific Exchange

A natural question follows:
Could this trigger the fastest sea-level rise in Earth’s history?

Physicist Sidd Mukherjee offered the following expert assessment:

“It depends on what you mean by ‘ever.’
In terms of human civilization: yes, likely.”

He notes:

  • The total global ice inventory can produce ~200 feet of sea-level rise.

  • Greenland and West Antarctica may already be committed to collapse.

Breakdown of likely contributions:

  • Greenland: ~20 feet over 100–300 years

  • West Antarctica: ~10 feet, potentially in decades to a century

Average over a century:

  • ~20 feet → 2 inches per year (50 mm/year), 10x the current rate

But the average masks the danger. Sea-level rise will likely arrive in pulses, not a smooth curve:

“We could dawdle along at half an inch per year, then suddenly experience a couple of years with a foot of rise annually.”

If CO₂-equivalent concentrations can be stabilized near 500 ppm, there may still be a chance to preserve East Antarctica, the largest remaining ice sheet. But if it destabilizes:

“Expect another couple hundred feet of sea-level rise.”

A Civilization-Level Threshold

We are now witnessing the early stages of a global system crossing into a new and dangerous mode of operation — one defined by:

  • Rapid CO₂ accumulation

  • Collapsing carbon sinks

  • Accelerating ocean heat storage

  • Cryosphere destabilization

  • Intensified extreme weather

The question is no longer whether these changes are occurring, but how quickly, and how prepared we are for the consequences.

Humanity is approaching — and in some cases passing — thresholds that earlier generations believed were centuries away. The decisions made in the next decade will determine whether sea-level rise is measured in inches, feet, or tens of feet within a single human lifetime.

WARNING

* Our probabilistic, ensemble-based climate model — which incorporates complex socio-economic and ecological feedback loops within a dynamic, nonlinear system — projects that global temperatures are becoming unsustainable this century. This far exceeds earlier estimates of a 4°C rise over the next thousand years, highlighting a dramatic acceleration in global warming. We are now entering a phase of compound, cascading collapse, where climate, ecological, and societal systems destabilize through interlinked, self-reinforcing feedback loops.

What Can I Do?
The single most important action you can take to help address the climate crisis is simple: stop burning fossil fuels. There are numerous actions you can take to contribute to saving the planet. Each person bears the responsibility to minimize pollution, discontinue the use of fossil fuels, reduce consumption, and foster a culture of love and care. The Butterfly Effect illustrates that a small change in one area can lead to significant alterations in conditions anywhere on the globe. Hence, the frequently heard statement that a fluttering butterfly in China can cause a hurricane in the Atlantic. Be a butterfly and affect the world.

Tipping points and feedback loops drive the acceleration of climate change. When one tipping point is toppled and triggers others, the cascading collapse is known as the Domino Effect.

The Climate Crisis: Violent Rain | Deadly Humid Heat | Health Collapse | Extreme Weather Events | Insurance | Trees and Deforestation | Soil | Rising Sea Level | Food and Water | Updates

The Human Induced Climate Change Experiment

bookmark_borderUnderestimation of Climate Sensitivity and Feedback Processes

by Daniel Brouse
April 2, 2025

In the 1990s, we first hypothesized the non-linear acceleration of climate change. By the early 2000s, this hypothesis had evolved into established climate theory, now widely recognized as scientific fact. My lab partner, a Doctor of Physics from Ohio State, and I collaborated to provide key evidence supporting this theory. Over the years, we have observed a dramatic reduction in the doubling time of climate change impacts — the rate at which these effects intensify. Initially, the doubling time was approximately 100 years, but it has since decreased to 10 years and, more recently, to just 2 years. This trend implies that the damage caused by climate change today is double what it was two years ago. In two years, it could be four times worse; in four years, eight times worse; and within a decade, potentially 64 times worse. These projections are conservative, assuming the doubling period does not continue to shrink further. Alarmingly, this rapid acceleration does not appear to be an anomaly. If this trajectory persists, the consequences will likely be far more catastrophic than previously anticipated.

Dr. James E. Hansen’s paper Global Warming Acceleration: Impact on Sea Ice confirms our theory with an analysis of the acceleration of global warming and its impact on sea ice, ice sheets, and ocean circulation, with a particular focus on the Atlantic Meridional Overturning Circulation (AMOC). Climate sensitivity is higher than previously estimated (ECS = 4.5 ± 0.5°C for doubled CO₂), which fundamentally alters expectations for future climate change. IPCC models fail to account for freshwater effects on sea ice cover, leading to an underestimation of climate sensitivity and feedback processes.

AMOC Shutdown Risk: Hanson emphasizes that accelerated warming increases the likelihood of AMOC shutdown by reducing surface water density in deepwater formation regions. A shutdown would trigger severe long-term consequences, including rapid sea level rise.

An AMOC shutdown would have severe and far-reaching impacts worldwide. For instance, on the U.S. East Coast it would lead to rapid sea level rise, stronger storms, and extreme weather shifts. As the AMOC slows or stops, warm water would no longer be transported northward, causing ocean water to pile up along the East Coast, which could raise sea levels by 1-3 feet (30-90 cm) almost immediately, on top of global sea level rise. This would have particularly devastating effects on the Northeast U.S. (New York, Boston, DC, Miami), where flooding would be most severe.

The weakening or shutdown of the AMOC would also impact hurricane formation. With warmer waters off the East Coast, hurricanes would become more intense and slower-moving, leading to longer-lasting and more destructive storms, like Hurricane Sandy. As the Gulf Stream weakens, hurricanes could linger longer over coastal cities, causing catastrophic flooding. Additionally, the disruption of weather patterns would lead to a stark contrast: the Northeast and Europe could experience much colder winters while the Southeast U.S. (Florida, Georgia, Carolinas) would face more extreme heat and droughts.

Increased rainfall and flooding would also become more common. With the Gulf Stream weakened, storms could stall over cities, dumping massive amounts of rainfall, similar to what occurred during Hurricane Harvey in Texas but along the East Coast. Nor’easters and stronger winter storms would become more frequent, particularly in New England. The disruption of the AMOC would also have catastrophic consequences for marine ecosystems. The circulation helps distribute nutrients in the ocean, and its shutdown could disrupt fish migration patterns and collapse major fisheries, especially in the Northeast U.S., where industries like cod fishing and lobster harvesting would be devastated.

In a Climate Crisis

Since the Earth’s equilibrium climate sensitivity (ECS) is 4.5 ± 0.5°C for a doubling of CO₂, the likely temperature rise this century under current emission levels will be significantly higher than IPCC estimates. Here’s a breakdown of how that translates into global warming:

1. CO₂ Projections & Radiative Forcing

  • Pre-industrial CO₂ (~280 ppm) to Present (~420 ppm): We’ve already experienced a ~1.2°C rise in global temperature.

  • Business-as-Usual Scenario (High Emissions, ~800-1000 ppm CO₂ by 2100): If emissions continue at current levels, CO₂ could more than double from pre-industrial levels, reaching or exceeding 560 ppm (the doubling threshold for ECS calculations).

  • Additional non-CO₂ greenhouse gases (methane, nitrous oxide, etc.) also contribute to warming.

2. Temperature Increase by 2100

Using ECS = 4.5 ± 0.5°C, and considering:

  • Climate sensitivity refers to long-term equilibrium response (centuries), but transient warming occurs within this century.

  • The Transient Climate Response (TCR), which is lower than ECS, typically ranges ~60-70% of ECS, meaning near-term warming may be slightly less than equilibrium projections.

Projected Warming by 2100 Based on ECS = 4.5°C

  1. Lower-End Case (~550-600 ppm CO₂, with significant mitigation efforts)

    • Optimistic warming: ~3.5–4.5°C

    • Comparable to IPCC’s worst-case scenarios (RCP 6.0–7.0 range)

  2. High-Emissions Case (~800-1000 ppm CO₂, with some mitigation)

    • Potential warming: ~5–7°C

    • This is significantly worse than IPCC’s RCP 8.5 projection, which assumes ECS = 3°C.

  3. Business as Usual Case (Feedbacks Accelerate Warming: AMOC Shutdown, Ice-Albedo, Methane Releases, etc.)

    • Expected warming: 7-9°C or more

    • This would resemble past hyperthermal events like the Paleocene-Eocene Thermal Maximum (PETM).

3. Policy & Adaptation Implications

  • If ECS is higher than IPCC estimates, it means current climate policies are underestimating risk.

  • The IPCC’s mid-range scenarios (projecting ~3°C by 2100) may be too optimistic if ECS is truly ~4.5°C.

  • Higher ECS implies faster and more extreme tipping points, including AMOC collapse, rapid sea level rise, and uninhabitable regions.

4. Urgency for Rapid Emission Cuts

  • Even immediate aggressive action (net-zero by mid-century) would still result in ~2.5-3°C warming due to existing CO₂ levels and slow response time.

  • Avoiding catastrophic warming (>4°C) requires drastic reductions in fossil fuel use this decade.

Bottom Line: At Current Emissions, Warming by 2100 is Likely 6°C or Higher

This level of warming would lead to massive global disruptions, including widespread droughts, stronger hurricanes, agricultural collapse, and displacement of hundreds of millions due to rising sea levels. If ECS is truly 4.5°C, the window to prevent catastrophic warming is far smaller than most policymakers assume.

* Our climate model employs chaos theory to comprehensively consider human impacts and projects a potential global average temperature increase of 9℃ above pre-industrial levels.

bookmark_borderClimate Change: 9 Day Tsunami Seismic Event

by Daniel Brouse
September 13, 2024

A seismic event, triggered by climate change, shook the Earth for nine days following a 650-foot tsunami in Greenland. As permafrost and glaciers melt, the ground becomes unstable. In this case, melting in East Greenland caused the collapse of a mountain, leading to a landslide that impacted the ocean and resulted in a massive tsunami. The reverberations from this event traveled from the Arctic to Antarctica within an hour.

The report, “A rockslide-generated tsunami in a Greenland fjord rang Earth for 9 days,” was published in the journal Science. One of the report’s authors, Kristian Svennevig from the Geological Survey of Denmark and Greenland, said, “The completely unique thing about this event is how long the seismic signal lasted and how constant the frequency was. Other landslides and tsunamis have produced seismic signals, but only for a couple of hours and very locally. This one was observed globally, all the way to the Antarctic.”

In September 2023, 882 million cubic feet of rock and ice—a volume equivalent to 25 Empire State Buildings—fell into a fjord in a remote, uninhabited area about 124 miles from the ocean. The landslide triggered a 200-meter-high mega-tsunami at its epicenter, which became “trapped” in the narrow fjord, oscillating back and forth for nine days and generating persistent vibrations.

“We’ve never seen such a large-scale movement of water over such a long period,” said Dr. Stephen Hicks from UCL, one of the scientists involved. “That glacier was supporting the mountain, but it got so thin that it just stopped holding it up. It shows how climate change is now impacting these regions.”

The Human Induced Climate Change Experiment

bookmark_borderSea Level Rise: Doubling Down

by Daniel Brouse

When we authored our paper on the acceleration of climate change, we couldn’t have anticipated its rapid pace. The doubling period for sea level rise, which was projected to span 100 years, dramatically shortened to 10 years by 2020. Shockingly, recent observations indicate that this doubling period has further compressed to just 2 years. We can only hope that this alarming trend is an aberration rather than a new norm.

NASA Reports:
A long-term sea level dataset shows ocean surface heights continuing to rise at faster and faster rates over decades of observations.

Global average sea level rose by about 0.3 inches (0.76 centimeters) from 2022 to 2023, a relatively large jump due mostly to a warming climate and the development of a strong El Niño. The total rise is equivalent to draining a quarter of Lake Superior into the ocean over the course of a year.

This NASA-led analysis is based on a sea level dataset featuring more than 30 years of satellite observations, starting with the U.S.-French TOPEX/Poseidon mission, which launched in 1992. The Sentinel-6 Michael Freilich mission, which launched in November 2020, is the latest in the series of satellites that have contributed to this sea level record.

The data shows that global average sea level has risen a total of about 4 inches (9.4 centimeters) since 1993. The rate of this increase has also accelerated, more than doubling from 0.07 inches (0.18 centimeters) per year in 1993 to the current rate of 0.17 inches (0.42 centimeters) per year.

This graph shows global mean sea level (in blue) since 1993 as measured by a series of five satellites. The solid red line indicates the trajectory of this increase, which more than doubled over the past three decades. The dotted red line projects future sea level rise.
NASA/JPL-Caltech

“Current rates of acceleration mean that we are on track to add another 20 centimeters of global mean sea level by 2050, doubling the amount of change in the next three decades compared to the previous 100 years and increasing the frequency and impacts of floods across the world,” said Nadya Vinogradova Shiffer, director for the NASA sea level change team and the ocean physics program in Washington.

Seasonal Effects

Global sea level saw a significant jump from 2022 to 2023 due mainly to a switch between La Niña and El Niño conditions. A mild La Niña from 2021 to 2022 resulted in a lower-than-expected rise in sea level that year. A strong El Niño developed in 2023, helping to boost the average amount of rise in sea surface height.

La Niña is characterized by cooler-than-normal ocean temperatures in the equatorial Pacific Ocean. El Niño involves warmer-than-average ocean temperatures in the equatorial Pacific. Both periodic climate phenomena affect patterns of rainfall and snowfall as well as sea levels around the world.

“During La Niña, rain that normally falls in the ocean falls on the land instead, temporarily taking water out of the ocean and lowering sea levels,” said Josh Willis, a sea level researcher at NASA’s Jet Propulsion Laboratory in Southern California. “In El Niño years, a lot of the rain that normally falls on land ends up in the ocean, which raises sea levels temporarily.”

This animation shows the rise in global mean sea level from 1993 to 2023 based on data from a series of five international satellites. The spike in sea level from 2022 to 2023 is mostly a consequence of climate change and the development of El Niño conditions in the Pacific Ocean. Credit: NASA’s Scientific Visualization Studio

* Our climate model employs chaos theory to comprehensively consider human impacts and projects a potential global average temperature increase of 9 degrees Celsius above pre-industrial levels.

How is All Real Estate at Risk From Climate Change?

The Human Induced Climate Change Experiment