bookmark_borderClimate Change: A Hard Rain Is Falling

by Daniel Brouse and Sidd Mukherjee

In a vacuum, everything falling to earth accelerates at 9.8 m/s^2 (32ft/s^2) [the downward speed increases at 9.8 m/s (32 ft/s) every second.]

Rain accelerates down to earth initially at 9.8 m/s^2, but air resistance slows the drops to a constant speed called the terminal velocity which depends on the size of the drop. “When all the parameters are considered the terminal velocity of a typical raindrop is calculated to be about 9 meters per second or 20 mph. A smaller raindrop of radius 0.15 cm has a terminal velocity of about 7 meters per second or 16 mph.” (1)

Velocity is only one factor in calculating the momentum of rain. The mass of rain also factors into the momentum.
p = mv
p = momentum
m = mass
v = velocity

“Climate change can affect the intensity and frequency of precipitation. Warmer oceans increase the amount of water that evaporates into the air. When more moisture-laden air moves over land or converges into a storm system, it can produce more intense precipitation — for example, heavier rain and snowstorms.” (2)

Part of the increasing momentum is transferred to the sides and upward increasing wind turbulence, as well as updrafts.

Most of the momentum is transferred upon impact. You may notice the rain bouncing higher off the streets and sidewalks. As rain becomes more massive, it will have greater momentum when it hits the ground. Ground without groundcover will be hit harder causing more damage. The groundcover will also be hit harder causing more damage.
* Concrete and asphalt will sustain more damage.
* Solar panels and roofs will sustain more damage.
* Trees and plants will sustain more damage.
* Food crops will sustain more damage.

1. “What is the speed of falling raindrops?” Kyle Hathcox, Glenn Marsch, David Ward (2001)
2. “Climate Change Indicators: Heavy Precipitation” EPA (2021)
The Human Induced Climate Change Experiment

bookmark_borderRecord-Setting Rain

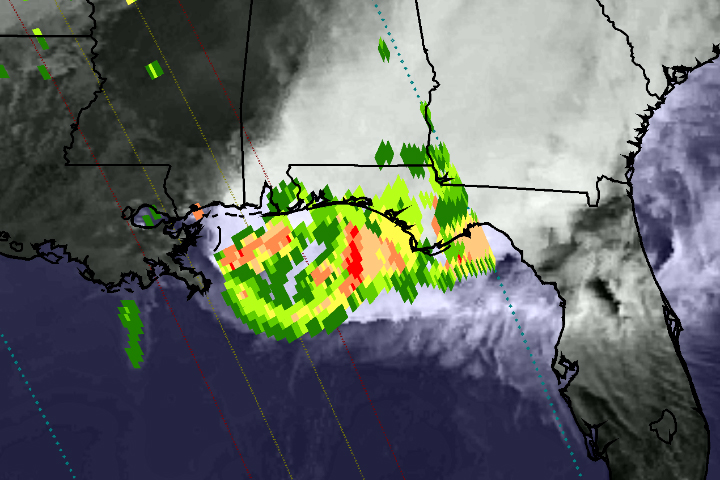
On April 29, 2014, the Global Precipitation Measurement (GPM) satellite observed the heavy rain that produced floods near Pensacola, Florida. The National Weather Service reported record-setting rainfall totals of more than 380 mm (15 inches) in Pensacola from the storm system that inundated the southeastern and eastern United States in recent days.

This image shows GPM Microwave Imager (GMI) rainfall estimates (green to red) superimposed on infrared observations (showing clouds and land) over the southeastern United States. Because the GPM satellite was launched only two months ago, the rainfall-estimation algorithms are currently undergoing a checkout period. For this reason, the scale indicates only qualitative information with green for light rain and red for heavy rain.

This GPM data was collected during a single satellite overpass shortly after noon local time, providing a snapshot of rain rates at that time. The outer blue dotted lines show the width of observations from the GMI instrument, while the two inner lines represent the area measured by the Ka-band (inner lines) and Ku-band (outer lines) of the Dual-Frequency Precipitation Radar. Once the radar data become available, they will provide a three-dimensional view of rain, ice, and snow in the atmosphere.

Extreme Weather
Extreme Weather

bookmark_borderWashington Mudslide

You would think with all the mud slinging in Washington DC that would be the Washington with the mudslide. No, the mudslide that killed over a dozen people and left over 100 missing was in Oso, Washington. Oso is a small village 55 miles northeast of Seattle (or, perhaps we should say *was*.) The village was “obliterated” after weeks of heavy rain.

This sort of extreme weather event is expected to become more normal due to the effects of global warming.

bookmark_borderClimate Change in the United States

The U.S. Environmental Protection Agency says:

The Earth’s climate is changing. Temperatures are rising, snow and rainfall patterns are shifting, and more extreme climate events—like heavy rainstorms and record high temperatures—are already affecting society and ecosystems. Scientists are confident that many of the observed changes in the climate can be linked to the increase in greenhouse gases in the atmosphere, caused largely by people burning fossil fuels to generate electricity, heat and cool buildings, and power vehicles.

EPA is working with many other organizations to better understand the causes and effects of climate change. With help from these partners, EPA has compiled a set of 26 indicators tracking signs of climate change. Most of these indicators focus on the United States, but some include global trends to provide context or a basis for comparison. These indicators represent a selected set of key climate change measurements, and are not an exhaustive group of all climate change indicators. EPA’s indicators are based on peer-reviewed data from various government agencies, academic institutions, and other organizations. EPA selected these indicators based on the quality of the data and other criteria.

EPA published these indicators in a comprehensive report in December 2012. Indicators will be updated periodically on the Web as newer data become available.

Use this site to learn more about EPA’s indicators related to greenhouse gases, weather and climate, oceans, snow and ice, and society and ecosystems.

bookmark_borderBelief in Anthropogenic Climate Change

From the American Meteorological Society

A series of polls provides new tests for how weather influences public beliefs about climate change. Statewide data from 5000 random-sample telephone interviews conducted on 99 days over 2.5 yr (2010–12) are merged with temperature and precipitation indicators derived from U.S. Historical Climatology Network (USHCN) station records. The surveys carry a question designed around scientific consensus statements that climate change is happening now, caused mainly by human activities. Alternatively, respondents can state that climate change is not happening, or that it is happening but mainly for natural reasons. Belief that humans are changing the climate is predicted by temperature anomalies on the interview day and the previous day, controlling for season, survey, and individual characteristics. Temperature effects concentrate among one subgroup, however: individuals who identify themselves as independent, rather than aligned with a political party. Interviewed on unseasonably warm days, independents tend to agree with the scientific consensus regarding anthropogenic climate change. On unseasonably cool days, they tend not to agree. Although temperature effects are sharpest for just a 2-day window, positive effects are seen for longer windows as well. As future climate change shifts the distribution of anomalies and extremes, this will first affect beliefs among unaligned voters.

bookmark_borderQ: Why Did the Sea Level Drop?

A: Because the rain fell on Australia.

By Alan Buis,
NASA’s Jet Propulsion Laboratory

David Hosansky,
National Center for Atmospheric Research

A unique and complex set of circumstances came together over Australia from 2010 to 2011 to cause Earth’s smallest continent to be the biggest contributor to the observed drop in global sea level rise during that time, finds a new study co-authored and co-funded by NASA.

In 2011, scientists at NASA’s Jet Propulsion Laboratory in Pasadena, Calif., and the University of Colorado at Boulder reported that between early 2010 and summer 2011, global sea level fell sharply, by about a quarter of an inch, or half a centimeter. Using data from the NASA/German Aerospace Center’s Gravity Recovery and Climate Experiment (GRACE) spacecraft, they showed that the drop was caused by the very strong La Niña that began in late 2010. That La Niña changed rainfall patterns all over our planet, moving huge amounts of Earth’s water from the ocean to the continents. The phenomenon was short-lived, however.

By mid-2012, global mean sea level had resumed its long-term mean annual rise of 0.13 inches (3.2 millimeters) per year (see http://www.jpl.nasa.gov/news/news.php?release=2012-362).

But analyses of the historical record showed that past La Niña events only rarely accompanied such a pronounced drop in sea level. So what made this particular La Niña unique?

To better understand this phenomenon, scientists at the National Center for Atmospheric Research (NCAR) in Boulder, Colo.; JPL; and the University of Colorado at Boulder combined GRACE data with data from the Argo global array of 3,000 free-drifting floats and satellite altimeters (Jason-1, Jason-2 and Topex/Poseidon).

They found that three atmospheric patterns converged over the Indian and Pacific Oceans in 2010 and 2011 to drive excessive precipitation over Australia. On average, the continent received almost one foot (300 millimeters) of rain more than normal. The result was widespread flooding. The flooding was in large part prevented from running back into the ocean by Australia’s dry soils and the mountain-ringed topography of the country’s vast interior, called the Outback, leading to the measurable drop in the world’s ocean levels.

“No other continent has this combination of atmospheric set-up and topography,” said NCAR scientist John Fasullo, lead author of the study. “Only in Australia could the atmosphere carry such heavy tropical rains to such a large area, only to have those rains fail to make their way to the ocean.”

Now that the atmospheric patterns have snapped back and more rain is falling over tropical oceans, the seas are rising again. In fact, with Australia in a major drought, they are rising faster than before. Since 2011, when the atmospheric patterns shifted out of their unusual combination, sea levels have been rising at a faster pace of about 0.4 inches (10 millimeters) per year.

The study, co-funded by NASA and the National Science Foundation, will be published next month in the journal Geophysical Research Letters.

bookmark_borderLarge Storm System in Eastern U.S.

The large storm in the eastern U.S. is visible in the satellite image below, taken by GOES East at 1715Z (12:15 EST) today.

The storm system continues to bring significant rainfall to Indiana and Michigan, where Flood Warnings and Advisories are in effect. The bulk of the precipitation has ended in Kentucky and southern Indiana, but several Flood Warnings and advisories continue. Central Kentucky and southern Indiana have received 2.5 to 5 inches of rainfall over the past 2 days. Additional rainfall amounts of 1 to 2 inches are possible in northern Indiana, northwest Ohio, and central and eastern lower Michigan before changing over to snow late this afternoon and evening for the first significant snowfall of the season. Winter Storm Watches and Warnings have been posted for northern Indiana, northwest Ohio, and central and southeast lower Michigan, where 4 to 8 inches of snow will be possible, with locally higher amounts possible if rain changes to snow earlier than expected.

Get the latest forecasts, watches and warnings from your local NWS Weather Forecast Office at http://www.weather.gov/.

Latest Storm Summary from the NWS Hydrometeorological Prediction Center:
http://www.hpc.ncep.noaa.gov/discussions/nfdscc3.html

High-Res version of image from NOAA’s Environmental Visualization Lab:
http://www.nnvl.noaa.gov/images/high_resolution/900_20111129-eastcoast.jpg

· · Share · about an hour ago ·