bookmark_borderThe Hemp Myth, Carbon Sinks and the Environment

by Daniel Brouse and Sidd Mukherjee

Q: Is hemp a good solution for carbon sequestration (carbon sinks) and/or beneficial to the environment?

A: No, not really. In general, hemp only acts as a carbon sink while it is growing and left unharvested. The harvesting usually negates any net-negative carbon sink. (ie more CO2 is released in the harvesting than is being sequestered.) In addition, production of oil, pulp, fibers, or other products usually results in a large carbon footprint. Hemp is not known to be more efficient in the production of anything. It’s also important to note, plant based oils and alcohols result in more low level ozone than petroleum, not to mention, any carbon that is combusted is converted to CO2. Ozone is killing many trees and humans (Death By Ozone, 2016).

Q: Remember the awful hole in the ozone layer in the 80-90’s? Don’t we want more ozone?

A: No. Ozone is a volatile gas and changes form rapidly. In general, there are 2 types of ozone — Tropospheric and Stratospheric. Tropospheric is low level ozone and deadly to life on earth. Stratospheric is in the upper level atmosphere (stratosphere) that protects life on earth (The Ozone Know Zone, 2005).

Q: Won’t the carbon be sequestered in the fiber and stay there until it rots (and hemp is resistant to rotting)?

A: Saying the carbon will stay in the fiber is partially correct… it will also stay in the leaves and the roots. The leaves and roots will decay faster. But, as for the fibers, to harvest them takes more carbon than the carbon that is sequestered. In all cases of plants as carbon sinks, it does nothing to solve the problem of the CO2 in the atmosphere that was released by fossil fuels. Plants are just a temporary store for their own carbon. Trees absorb and release about the same amount of carbon over a 100-year cycle (with many shorter time cycles for the leaves — about 1-2 years.) Comparatively, hemp’s cycle is only a few years. Another important factor in calculating the length of time of a carbon sink with plants is that plants also breath: “Plants release up to 30 per cent more CO2 than previously thought.” During daylight and night there is the process of plant respiration in which plants breath in O2 and breath out CO2. This is different than during daylight hours when a separate process called photosynthesis takes in carbon dioxide and releases oxygen. Plants release up to 30 per cent more CO2 than previously thought, 2017)

Q: Would it is better to have tarmac than grow hemp? Even though hemp can replace petroleum-based plastic with biodegradable products?

A: No, not at all. We should plant as many plants with the longest sink-cycle (trees). Most importantly we should stop releasing CO2 that has been sequestered for millions of years. Then, we should figure how to re-sequester CO2 for millions of years.

Hemp has far more benefits and significantly less costs than petroleum products; however, agriculture in general has many costs (in fact, the invention of flooded rice paddy agriculture thousands of years ago in China was one of the first major human causes of climate change.” The origins of human-influenced climate change may be traced back 5,000 years“, 2004) Monoculture of hemp, corn, and other bio-fuels release all the CO2, create more ozone and require vast areas of land. Having a single crop produced in large scale has a devastating effect on biodiversity. Bio-plastics and other petroleum substitutes create the same sort of environmental problems. They don’t instantly bio-degrade. They initially breakdown into micro-bio-plastics.

The little live creatures on this planet have evolved for a couple billion years to eat what plants make — like carbohydrates. So, they eat carbohydrates much faster than they can eat hydrocarbons from fossil fuels. (But they are working on it, we already see evolution in that direction.)

Unfortunately, there are no good carbon sinks known to Man (other than petroleum / hydrocarbons.) The best solution is to stop human Green House Gas emissions. A study published in the Journal Nature, The contribution of insects to global forest deadwood decomposition found, “Worldwide, dead and decaying wood releases roughly 10.9 gigatons of carbon every year. This is roughly 115% of annual fossil fuel emissions.”

“We found both the rate of decomposition and the contribution of insects are highly dependent on the climate, and will increase as temperatures rise,” study co-author David Lindenmayer said.

At present, bio derived packaging is to be preferred to fossil derived packaging since the former made out of carbohydrate will break down faster than fossil derived hydrocarbon. More important, the bio derived packaging is only returning to the atmosphere recently obtained CO2, since the plants from where the packaging came would decay anyway. But, if fossil plastic decays, that’s dumping into the atmosphere fossil C which was buried hundreds of millions of years ago. Maybe it’s a good thing the little bugs haven’t yet found a widespread, efficient way to eat fossil plastic.

Relative to petroleum, plants are much more beneficial. Hydrocarbons have a much greater cost to the environment. Relative to trees, hemp is far more costly; however, the real solution is to cut down on packaging and consumption.

The Human Induced Climate Change Experiment

bookmark_borderEmissions Worst Ever

The World Meteorological Organization reported on October 30, 2017:
Greenhouse gas concentrations surge to new record

Green-House-Gas-Bulletin-2017.pdf

Concentrations of carbon dioxide in the atmosphere surged at a record-breaking speed in 2016 to the highest level in 800,000 years, according to the World Meteorological Organization’s Greenhouse Gas Bulletin. The abrupt changes in the atmosphere witnessed in the past 70 years are without precedent.

Globally averaged concentrations of CO2 reached 403.3 parts per million in 2016, up from 400.00 ppm in 2015 because of a combination of human activities and a strong El Niño event. Concentrations of CO2 are now 145% of pre-industrial (before 1750) levels, according to the Greenhouse Gas Bulletin.

Rapidly increasing atmospheric levels of CO2 and other greenhouse gases have the potential to initiate unprecedented changes in climate systems, leading to “severe ecological and economic disruptions,” said the report.

The annual bulletin is based on observations from the WMO Global Atmosphere Watch Programme. These observations help to track the changing levels of greenhouse gases and serve as an early warning system for changes in these key atmospheric drivers of climate change.

Population growth, intensified agricultural practices, increases in land use and deforestation, industrialization and associated energy use from fossil fuel sources have all contributed to increases in concentrations of greenhouse gases in the atmosphere since the industrial era, beginning in 1750.

Since 1990, there has been a 40% increase in total radiative forcing – the warming effect on our climate – by all long-lived greenhouse gases, and a 2.5% increase from 2015 to 2016 alone, according to figures from the US National Oceanic and Atmospheric Administration quoted in the bulletin.

“Without rapid cuts in CO2 and other greenhouse gas emissions, we will be heading for dangerous temperature increases by the end of this century, well above the target set by the Paris climate change agreement,” said WMO Secretary-General Petteri Taalas. “Future generations will inherit a much more inhospitable planet, “ he said.

“CO2 remains in the atmosphere for hundreds of years and in the oceans for even longer. The laws of physics mean that we face a much hotter, more extreme climate in the future. There is currently no magic wand to remove this CO2 from the atmosphere,”said Mr Taalas.

The last time the Earth experienced a comparable concentration of CO2 was 3-5 million years ago, the temperature was 2-3°C warmer and sea level was 10-20 meters higher than now.

In a separate report, the United Nations (UN) released the Emissions Gap Report for 2017. The report concludes that world treaties are only slowing emissions by 1/3 of what is needed to meet the maximum 2 degree rise in temperature. A 2 degree Celsius rise in temperature would likely cause a 20-40 foot rise in sea levels.

Emissions-Gap-Report_2017.pdf

If the trend continues, most coastal and port cities (including the Jersey Shore and Philadelphia) will be submerged in your lifetime.

2 Degree Temp. Rise and Sea Level Rise
New Jersey Shore Under Sea Level

bookmark_borderClimate Change Breaks Multiple Records with Global Impacts

The World Meteorological Organization (WHO) issued a report that states records for 2016:

  • a record global temperature
  • exceptionally low sea ice
  • unabated sea level rise
  • ocean heat

Extreme weather and climate conditions have continued into 2017.

“This report confirms that the year 2016 was the warmest on record – a remarkable 1.1 °C above the pre-industrial period, which is 0.06 °C above the previous record set in 2015. This increase in global temperature is consistent with other changes occurring in the climate system,” said WMO Secretary-General Petteri Taalas.

“Globally averaged sea surface temperatures were also the warmest on record, global sea levels continued to rise, and Arctic sea-ice extent was well below average for most of the year,” he said.

“With levels of carbon dioxide in the atmosphere consistently breaking new records, the influence of human activities on the climate system has become more and more evident,” said Mr Taalas.

The report goes on to say: Global sea levels rose very strongly during the El Niño event, with the early 2016 values reaching new record highs. Global sea ice extent dropped more than 4 million square kilometres below average in November, an unprecedented anomaly for that month.

The very warm ocean temperatures contributed to significant coral bleaching and mortality was reported in many tropical waters, with important impacts on marine food chains, ecosystems and fisheries.

Carbon dioxide levels in the atmosphere reached the symbolic benchmark of 400 parts per millions in 2015 – the latest year for which WMO global figures are available – and will not fall below that level for many generations to come because of the long-lasting nature of CO2.

Noteworthy extreme events in 2016 included severe droughts that brought food insecurity to millions in southern and eastern Africa and Central America. Hurricane Matthew caused widespread suffering in Haiti as the first category 4 storm to make landfall since 1963, and inflicted significant economic losses in the United States of America, while heavy rains and floods affected eastern and southern Asia.

The extreme weather continues in 2017.
In addition to the report on 2016, the WHO issued a supplement for 2017:
“Even without a strong El Niño in 2017, we are seeing other remarkable changes across the planet that are challenging the limits of our understanding of the climate system. We are now in truly uncharted territory,” said World Climate Research Programme Director David Carlson.

At least three times so far this winter, the Arctic has witnessed the Polar equivalent of a heatwave, with powerful Atlantic storms driving an influx of warm, moist air. This meant that at the height of the Arctic winter and the sea ice refreezing period, there were days which were actually close to melting point. Antarctic sea ice has also been at a record low, in contrast to the trend in recent years.

Scientific research indicates that changes in the Arctic and melting sea ice is leading to a shift in wider oceanic and atmospheric circulation patterns. This is affecting weather in other parts of the world because of waves in the jet stream – the fast moving band of air which helps regulate temperatures.

Thus, some areas, including Canada and much of the USA, were unusually balmy, whilst others, including parts of the Arabian peninsula and North Africa, were unusually cold in early 2017.

In the USA alone, 11,743 warm temperature records were broken or tied in February, according to the US National Oceanic and Atmospheric Administration. Prolonged and extreme heat in January and February affected New South Wales, southern Queensland, South Australia and northern Victoria, and saw many new temperature records.

Highlights of the 2016 Statement

Global Temperatures:

2016’s warmth extended almost worldwide. Temperatures were above the 1961-90 average over the vast majority of the world’s land areas, the only significant exceptions being an area of South America centred on central Argentina, and parts of south-western Australia.

Mean annual temperatures at least 3 °C above the 1961-1990 average occurred in various high-latitude locations, particularly along the Russian coast and in Alaska and far north-western Canada, and on islands in the Barents and Norwegian Seas. In the high Arctic, Svalbard (Norway) Airport’s 2016 mean annual temperature of −0.1 °C was 6.5 °C above the 1961-1990 average, and 1.6 °C above the previous record.

Outside the Arctic, 2016’s warmth was more notable for its consistency across the globe than for its extreme nature in individual locations.

Oceans

Globally averaged sea surface temperatures in 2016 were the warmest on record. The anomalies were strongest in the early months of 2016.

Global ocean heat content was the second-highest on record after 2015. It reached new record highs in the northern hemisphere, but was cooler in the southern hemisphere.

Globally, sea level has risen by 20 cm since the start of the twentieth century, mostly due to thermal expansion of the oceans and melting of glaciers and ice caps. Global sea levels rose very strongly during the 2015/2016 El Niño, rising about 15 millimetres between November 2014 to a new record high in February 2016. This was well above the post-1993 trend of 3 to 3.5 mm per year. From February to August, sea levels remained fairly stable as the influence of the El Niño declined. Final 2016 sea level data are not yet available at the time of writing.

Arctic sea ice

The seasonal maximum, of 14.52 million square kilometres on 24 March, was the lowest in the 1979-2016 satellite record. The 2016 autumn freeze-up was exceptionally slow – with sea ice extent even contracting for a few days in mid-November.

Precipitation

Much of southern Africa began the year in severe drought. For the second year in succession, rainfall was widely 20 to 60% below average for the summer rainy season (October to April) in 2015/2016. The World Food Programme estimating that 18.2 million people would require emergency assistance by early 2017.

Provisional figures showed 2016 was the driest on record over the Amazon Basin, and there was also significant drought in north-east Brazil.  El Niño brought drought conditions elsewhere in Central America and northern South America.

The Yangtze basin in China experienced, overall, its most significant flood season since 1999, with some tributaries experiencing record flood levels. Averaged over China as a whole, it was the wettest year on record, with national mean rainfall of 730 mm being 16% above the long-term average.

Heatwaves

The year started with an extreme heatwave in southern Africa in the first week of January. On 7 January, it reached 42.7 °C at Pretoria and 38.9 °C at Johannesburg, both of which were 3 °C or more above the all-time records at those sites.

Extreme heat also affected South and South-East Asia in April and May, prior to the start of the summer monsoon. South-East Asia was badly affected in April. A national record of 44.6 °C was set at Mae Hong Son, Thailand, on 28 April, and 51.0 °C was observed on 19 May at Phalodi, the highest temperature on record for India.

Record or near-record temperatures occurred in parts of the Middle East and north Africa. The highest temperature observed was 54.0 °C at Mitribah (Kuwait) on 21 July which (subject to ratification) will be the highest temperature on record for Asia. Other extremely high temperatures included 53.9 °C at Basra (Iraq) and 53.0 °C at Delhoran (Islamic Republic of Iran – a national record), both on 22 July, whilst significant high temperatures were also reported in Morocco, Tunisia, Libya and the United Arab Emirates.

A late-season heatwave affected many parts of western and central Europe in the first half of September. In southern Spain, 45.4 °C was recorded at Cordoba on 6 September.

ABOUT WMO
WMO is a specialized agency of the United Nations (UN) with 191 Member States and Territories. It is the UN system’s authoritative voice on the state and behaviour of the Earth’s atmosphere, its interaction with the land and oceans, the weather and climate it produces and the resulting distribution of water resources.

Additional References
Guide To Climate Change
The Human Induced Climate Change Experiment

bookmark_borderHumans Set World Pollution Record

by Daniel Brouse

Scientists wrote in the journal Nature Geoscience, “Given currently available records, the present anthropogenic carbon release rate is unprecedented during the past 66 million years.”

The largest known natural surge is believed to have happened 56 million years ago and was likely caused by a release of frozen methane beneath the seabed.

“Our results suggest that future ocean acidification and possible effects on marine calcifying organisms will be more severe than during the PETM (Paleoeocene-Eocene Thermal Maximum),” said lead author Richard Zeebe of the University of Hawaii. “Future ecosystem disruptions are likely to exceed the relatively limited extinctions observed at the PETM.” It is believed in previous warming animals had more time to adapt. In the current warming trend, creatures (such as humans) will unlikely be able to adapt. The warming rate is too fast.

Article from Nature Geoscience:
Anthropogenic carbon release rate unprecedented during the past 66 million years
by Richard E. Zeebe, Andy Ridgwell & James C. Zachos

Abstract
Carbon release rates from anthropogenic sources reached a record high of ~10 Pg C yr−1 in 2014. Geologic analogues from past transient climate changes could provide invaluable constraints on the response of the climate system to such perturbations, but only if the associated carbon release rates can be reliably reconstructed. The Palaeocene–Eocene Thermal Maximum (PETM) is known at present to have the highest carbon release rates of the past 66 million years, but robust estimates of the initial rate and onset duration are hindered by uncertainties in age models. Here we introduce a new method to extract rates of change from a sedimentary record based on the relative timing of climate and carbon cycle changes, without the need for an age model. We apply this method to stable carbon and oxygen isotope records from the New Jersey shelf using time-series analysis and carbon cycle–climate modelling. We calculate that the initial carbon release during the onset of the PETM occurred over at least 4,000 years. This constrains the maximum sustained PETM carbon release rate to less than 1.1 Pg C yr−1. We conclude that, given currently available records, the present anthropogenic carbon release rate is unprecedented during the past 66 million years. We suggest that such a ‘no-analogue’ state represents a fundamental challenge in constraining future climate projections. Also, future ecosystem disruptions are likely to exceed the relatively limited extinctions observed at the PETM.

More Human Induced Climate Change Experiments

bookmark_borderCarbon Dioxide Breaks 800,000 Year Record

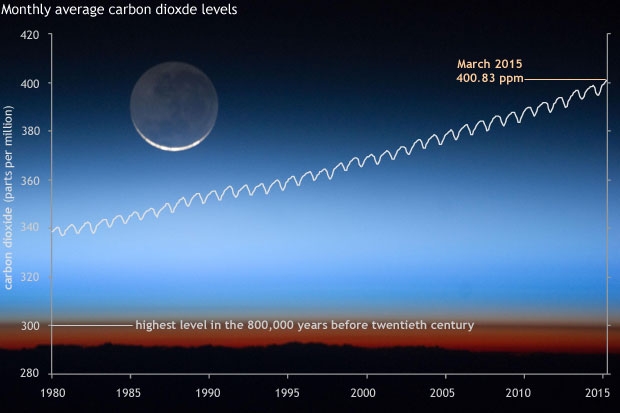
NOAA — For 800,000 years before the twentieth century, carbon dioxide levels in Earth’s atmosphere never exceeded 300 parts per million. Then the Industrial Revolution began, and modern human civilization started burning through millions of years of fossilized carbon in the geological blink of an eye.

NOAA scientists reported that in March 2015 the monthly average global carbon dioxide level went above 400 parts per million for the first time. The graph below puts this value into historical context, showing modern observations since 1980. The seasonal cycle of plant growth and decay in the Northern Hemisphere causes the dips and peaks in the line.

The graph is overlaid on an astronaut photograph of the Earth’s atmospheric limb—the narrow halo of air that appears as a layered cake when viewed from the side and far away. Heat from the sun-warmed surface of the Earth must travel that distance and pass back out to space for Earth’s surface temperature to remain in balance.

But within those layers of atmosphere, carbon dioxide molecules absorb heat, just like the bricks in your chimney absorb heat from a fire. The more carbon dioxide, the more heating, and the longer it takes the atmosphere to cool off. Every night, the solar heating stops, and everything begins to cool off, but every day the Sun comes up and restarts the heating. Because the day’s heat takes longer on average to pass through all those layers than it did when there was less carbon dioxide, Earth’s average temperature has gone up. The more carbon dioxide (and other greenhouse gases) we add, the more it will continue to go up.

In addition to the cascade of climate impacts from this global warming—rising sea level, more extreme rain events, insect pest population explosions, increasing coral bleaching—the extra carbon dioxide is also changing the pH of the ocean. Carbon dioxide is mildly acidic when it dissolves in water (think of your favorite carbonated beverage). The ocean’s rising acidity has harmed oysters and other marine creatures by weakening their shells.

When commenting on the milestone, NOAA scientists pointed out that carbon dioxide is a long-lived greenhouse gas, so stopping the further increase in emissions will not immediately return the Earth’s temperature to it’s pre-industrial state. Once we stop adding more than the Earth’s natural systems can remove in any given year, we will still have to wait thousands of years for the Earth to completely remove the excess amount we have already emitted.

Image by NOAA Climate.gov, based on monthly global carbon dioxide data from Mauna Loa Observatory, provided by NOAA ESRL. Astronaut photograph courtesy NASA Earth Observatory.

Record CO2 Level
Record CO2 Level