bookmark_borderSudden Sea Level Pulses: How “Cork Release” Ice-Sheet Failures Could Rapidly Reshape Global Coastlines

By Daniel Brouse and Sidd Mukherjee

November 25, 2025

Introduction: The Shift From Gradual to Abrupt Sea Level Rise

Sea level rise (SLR) is one of the most revealing indicators of the accelerating pace of climate change. A century ago, global SLR was doubling roughly every 100 years. Ten years ago the doubling time had collapsed to a decade. By 2023, the doubling time had plunged to only two years.

This extraordinary acceleration led us to focus on a much more dangerous and poorly modeled phenomenon:

Sudden Sea Level Pulses (SSLPs) — rapid, stepwise jumps in sea level triggered by abrupt ice-sheet failures, subglacial “cork release” events, and ice-shelf structural collapse.

These pulses are not hypothetical. They are beginning to occur.

Examples include:

  • Greenland Subglacial Flood: A massive outburst where trapped meltwater burst through the ice, demonstrating the potential for sudden hydrofracture.
  • Alaska’s Mendenhall Glacier Outburst: A glacial flood that produced rapid, dangerous water-level increases downstream.

A detailed overview is archived at:
http://membrane.com/global_warming/Greenland-Ouburst.html

These events reveal something ice-sheet models have not yet fully integrated: meltwater can accumulate beneath ice until pressure surpasses structural integrity, causing the ice surface to fail catastrophically — a “cork release.” When this occurs at scale, sea levels can jump not millimeters per year, but multiple feet per year.

Why This Matters: The Risk of Abrupt, Multi-Foot Sea Level Jumps

The public still imagines sea level rise as a slow, linear process. But the Earth system does not behave linearly. When hydrofracture and ice-cliff collapse become common, we could face:

  • Multi-foot sea level increases within a single decade
  • 1–3 feet of rise within a single year in extreme pulse scenarios
  • Little or no time for adaptation in cities like Miami, New York, Mumbai, Lagos, and Shanghai

Current global climate models fail to incorporate most “cork release” pathways because:

  • Subglacial water transport is poorly mapped
  • Meltwater storage and pressurization are not well parameterized
  • Ice-shelf fracture mechanics are only partially resolved
  • Positive feedback loops — such as meltwater-driven lubrication and ice-cliff collapse — are not modeled dynamically

The Greenland outburst events show that ice sheets can undergo abrupt, nonlinear failures — far faster than infrastructure, economies, or governance systems can adapt.

Sidd summarized it best:

“Under-ice hydrology is hard to observe… but once enough pressure builds, ice doesn’t melt — it fractures.”

Antarctica: The System Most Likely to Produce Catastrophic Pulses

While Greenland contributes meaningfully to long-term SLR, Antarctica is the critical risk for abrupt sea level pulses.

The East Antarctic Ice Sheet (EAIS)

  • Holds ~170 feet of potential sea level rise
  • Once thought stable for millennia
  • Now showing early signs of warming-driven destabilization
  • Marine-based sectors may begin collapsing this century

The West Antarctic Ice Sheet (WAIS)

  • Highly vulnerable
  • Resting on retrograde (downward-sloping) bedrock
  • Warm ocean water is eroding the shelves from below
  • Pinning points are failing, which removes the natural “brakes”

Sidd’s assessment:

Greenland: “Effectively lost,” 100–300 years, +20 ft
West Antarctica: Likely collapse within decades to ~100 years, +10 ft

Total plausible rise by 2125: 20–30 feet, with the possibility of sudden pulses:

“We could dawdle along at half an inch a year, then see a few years at a foot per year.”

New Evidence: The Impending Failure of Thwaites Eastern Ice Shelf (TEIS)

In November 2025, Advancing Earth and Space Sciences published a landmark study:
“Evolution of Shear-Zone Fractures Presages the Disintegration of Thwaites Eastern Ice Shelf”
(https://agupubs.onlinelibrary.wiley.com/doi/10.1029/2025JF008352)

The TEIS is a keystone structure. Once it collapses, the glacier behind it — the “Doomsday Glacier” — will accelerate dramatically. The study found:

Key Findings

  1. Long-term shear fracturing (2002–2017):
    Large fractures formed parallel to flow as the shelf strained against its pinning point.
  2. Recent explosive tensile fracturing (2017–2022):
    Smaller, orthogonal fractures began proliferating, indicating that structural integrity is failing.
  3. Dynamic destabilization:
    Satellite and GPS data reveal velocity perturbations rippling across the shelf as fractures expand — a sign of imminent collapse.
  4. Transition of the pinning point from stabilizer to destabilizer:
    Echoing Benn et al. (2022), the pinning point now increases fracture stress instead of reducing it.
  5. Self-reinforcing feedback loop:
    The shelf appears to be entering the “damage-acceleration-damage” feedback proposed by Lhermitte et al. (2020), a hallmark of impending disintegration.

What This Means

When TEIS collapses — an event many glaciologists now expect within years to a decade — Thwaites Glacier could:

  • accelerate dramatically
  • initiate ice-cliff collapse
  • trigger multi-foot sea level pulses within short timescales

This is the largest currently unfolding structural failure in the cryosphere.

Cork-Release Events: A Distinct Class of Tipping Point

We define a “cork release” event as:

A sudden failure of ice or subglacial pressure systems causing rapid, high-volume discharge of water or ice into the ocean.

These events include:

  • subglacial lake drainage
  • rapid ice-shelf collapse
  • meltwater-driven hydrofracture
  • ice-cliff structural failure

Unlike gradual melt, cork-release events:

  • are nonlinear
  • occur suddenly
  • accelerate with warming
  • have global consequences within months to years
  • are triggered by thresholds that are difficult to predict

This makes them one of the most dangerous — and least modeled — climate feedbacks.

Conclusion: The Urgent Need to Model Abrupt Sea Level Change

The climate system is not simply warming. It is accelerating, destabilizing, and producing events far outside historical norms. Sea level rise will not be a smooth curve; it will be stepwise, punctuated by abrupt pulses.

To prepare for what is coming, climate science and adaptation planning must incorporate:

  • ice-shelf fracture dynamics
  • under-ice hydrology
  • subglacial pressurization
  • ice-cliff collapse physics
  • nonlinear feedbacks
  • sudden sea level pulse scenarios

Human systems are built for gradual change. The cryosphere is not.

The question is no longer if abrupt sea level pulses will occur — but how soon, how large, and how many.

* Our probabilistic, ensemble-based climate model — which incorporates complex socio-economic and ecological feedback loops within a dynamic, nonlinear system — projects that global temperatures are becoming unsustainable this century. This far exceeds earlier estimates of a 4°C rise over the next thousand years, highlighting a dramatic acceleration in global warming. We are now entering a phase of compound, cascading collapse, where climate, ecological, and societal systems destabilize through interlinked, self-reinforcing feedback loops.

What Can I Do?
The single most important action you can take to help address the climate crisis is simple: stop burning fossil fuels. There are numerous actions you can take to contribute to saving the planet. Each person bears the responsibility to minimize pollution, discontinue the use of fossil fuels, reduce consumption, and foster a culture of love and care. The Butterfly Effect illustrates that a small change in one area can lead to significant alterations in conditions anywhere on the globe. Hence, the frequently heard statement that a fluttering butterfly in China can cause a hurricane in the Atlantic. Be a butterfly and affect the world.

→ “Solutions to the Fossil Fuel Economy and the Myths Accelerating Climate and Economic Collapse.“

Tipping points and feedback loops drive the acceleration of climate change. When one tipping point is toppled and triggers others, the cascading collapse is known as the Domino Effect.

The Human Induced Climate Change Experiment

bookmark_borderFlooding at Coastal Sites That Use and Produce Hazardous Substances

Sea level rise and flooding of hazardous sites in marginalized communities across the United States
Published in Nature / 20 November 2025

Sea level rise (SLR) increases the risk of flooding at coastal sites that use and produce hazardous substances. We assess whether socially marginalized populations in the United States are more likely to be impacted by projected SLR-related flooding of hazardous sites that could result in contaminant releases. We identify 5500 facilities at risk of a 1-in-100-year flood event by 2100 under a scenario of continued high greenhouse gas emissions, including coastal power plants, sewage treatment facilities, fossil fuel infrastructure, industrial facilities, and formerly used defense sites. Seven states (Louisiana, Florida, New Jersey, Texas, California, New York, and Massachusetts) account for nearly 80% of projected at-risk facilities. Controlling for population density and county, a one standard deviation increase in the proportion of linguistically isolated households, neighborhood residents identifying as Hispanic, households with incomes below twice the federal poverty line, households without a vehicle, non-voters, and renters is associated with 19-41% higher likelihood of having a site at risk of SLR-related flooding within 1 kilometer.

Flooding at Coastal Sites That Use and Produce Hazardous Substances

Flooding at Coastal Sites That Use and Produce Hazardous Substances

bookmark_borderThe Race Against Time: Climate Crisis vs. the United States

by Daniel Brouse
April 12, 2025

Abstract
Humanity stands at a historic crossroads where the accelerating pace of climate change threatens to overtake both our capacity for response and the viability of the global economic system itself. Recent models indicate that without immediate intervention, climate change could cause the collapse of capitalism as we know it—potentially as soon as 2050. At the same time, U.S. political developments—particularly Trump-era trade, fiscal, and environmental policies—may unintentionally hasten this collapse. The central question becomes: Will the U.S. economic system implode before climate change forces its hand, or has irreversible damage already been done?

I. Climate Change: From Hypothesis to Imminent Catastrophe

In the 1990s, we proposed a hypothesis: that climate change would not follow a linear trajectory but would instead accelerate non-linearly—driven by feedback loops such as polar ice melt, permafrost thaw, ocean acidification, and carbon release from soil and forests. Over the following decades, this hypothesis evolved into an established scientific theory, now widely accepted by the international scientific community.

Through collaboration with a physicist from Ohio State University, we observed a startling trend in the “doubling time” of climate impacts. Originally pegged at around 100 years, this timeframe has since shrunk to 10 years, and now—alarmingly—approaches just 2. That means climate-related damages could be 64 times worse a decade from now than they are today. These aren’t worst-case scenarios; they are conservative models assuming no further acceleration.

Our latest models integrate not only geophysical systems but also social, political, and economic feedback loops. The results are grim: we now forecast a potential 9°C rise in global temperatures within this century—a rate that would make much of the planet uninhabitable and render large-scale human migration and system failure unavoidable.

II. A New Threat Emerges: Trumpenomics and the War on Global Stability

Ironically, the Trump administration—through its aggressive trade, credit, and isolationist policies—has accelerated the very breakdown of capitalism that climate change is expected to cause.

The imposition of widespread tariffs, especially those based on falsified “reciprocal” trade deficits, has triggered not just a trade war, but a credit war. This combination has never before been tested in modern economic history. During Trump’s first term, the stage was set. Now, in his second term, the global economy is being subjected to a real-time, uncontrolled experiment.

The administration’s “drill, baby, drill” energy policy, paired with unprecedented regulatory rollbacks, has only deepened the climate crisis. Yet, from an economic systems perspective, it is the trade and credit dislocations that may deliver the first major blow.

III. Global Trade, Capital Flows, and the Liquidity Death Spiral

Most people think of tariffs as mere taxes on goods. But in today’s complex financial system, their impact extends far beyond the shipping yard.

When the U.S. imports less, foreign exporters earn fewer dollars. This reduces their ability to invest in U.S. Treasuries—the bedrock of the global financial system. As demand for Treasuries falls, yields rise, borrowing costs spike, and credit conditions tighten. This sets off a self-reinforcing liquidity crisis, undermining everything from consumer lending to corporate investment.

The risk is real and growing: a scenario where the U.S. dollar loses its global reserve status is no longer the stuff of academic theory. Should this occur, the fallout would include:

  • Exploding U.S. borrowing costs

  • A collapse in consumer purchasing power

  • Capital flight from U.S. markets

  • Severe contraction in both trade and credit

  • Domestic political and social unrest on a scale not seen in modern history

IV. The Tipping Point: Will Climate Collapse or Economic Collapse Win the Race?

The economic trajectory of the U.S. under Trump’s policies suggests that a post-capitalist transition may be triggered by domestic fiscal instability rather than climate catastrophe alone. In other words, the United States may be the first nation to economically implode under the dual weight of environmental and self-inflicted economic collapse.

Complicating matters, the U.S. is simultaneously dealing with aging infrastructure, mounting national debt, deteriorating public health, climate-related disasters, and rising political extremism—all of which erode resilience and reduce the chances of a coordinated national response.

This raises a chilling question: Will the collapse of the U.S. economy accelerate faster than climate change itself—or are we already too late to avoid either fate?

The U.S. dollar’s decline from global dominance — driven by unprecedented political dysfunction and fiscal recklessness — is unraveling the myth of American exceptionalism. Once the cornerstone of international finance, the United States now risks becoming a net liability to the world economy. Paradoxically, this economic unraveling may carry a sliver of hope. If Trump’s economic collapse marks the end of mass consumption, over-leveraged capitalism, and fossil fuel dependency, it could trigger a sharp drop in global emissions and slow the pace of climate change. Such a forced degrowth scenario–where contraction curbs carbon output–might buy humanity precious time to adapt, innovate, and survive. But this path would come at a steep cost: to livelihoods, political stability, and America’s standing in the world.

Conclusion: What Comes After?

Regardless of which crisis arrives first, one outcome is increasingly likely: the U.S. standard of living will fall sharply, and life expectancy may follow. Whether that post-collapse society can still be sustainable—or even enjoyable—will depend on the decisions we make in the next few years.

Our only hope is to treat this as a true “race against time” and respond with urgency, humility, and collective will. The future depends not just on science and economics, but on whether we can choose survival over ideology, cooperation over conflict, and truth over convenience.

The Human Induced Climate Change Experiment

bookmark_borderInternational Year of Glaciers

by Daniel Brouse
March 21, 2025

Glaciers Melting 36% Faster Than 20 Years Ago

The United Nations has designated 2025 as the International Year of Glaciers’ Preservation to raise global awareness about the critical role glaciers play in our planet’s climate system and water resources. This initiative aims to mobilize governments, scientific institutions, the private sector, and civil society to urgently reduce greenhouse gas emissions and implement effective adaptation strategies. Additionally, starting in 2025, March 21 will be observed annually as the World Day for Glaciers, emphasizing the need for concerted efforts to protect these vital natural resources. ​

Recent reports highlight the alarming acceleration of glacier melt worldwide. A UNESCO report reveals that glaciers have been melting 36% faster than they did 20 years ago, losing approximately 273 billion tons of ice per year between 2000 and 2023. This amounts to a total loss of 6,542 billion tons of ice during that period, significantly impacting regions from the Arctic to the Alps, South America, and the Tibetan Plateau. The accelerated melting contributes to rising sea levels, threatening millions with floods and disrupting essential water sources for energy and agriculture. ​

The rapid retreat of glaciers poses a severe risk to the food and water supply of up to 2 billion people globally. The climate crisis is causing unprecedented glacier melting and reduced snowfall, which in turn impacts irrigated agriculture and water supplies in mountainous regions. More than 1 billion people in these areas, particularly in developing countries, already face food insecurity, a situation predicted to worsen as glaciers continue to shrink.

In Antarctica, scientists are increasingly alarmed as evidence shows that sea ice has reached record lows for the fourth consecutive year. Notably, the Thwaites Glacier, often referred to as the “Doomsday Glacier,” remains particularly vulnerable, with significant implications for global sea levels. Recent Antarctic sea ice extents have fallen below 2 million square kilometers, with 2022 and 2025 both recording only 1.98 million square kilometers. This decline in sea ice has potential global repercussions, as it may amplify rising sea levels and influence global temperatures.

These developments underscore the urgency of the International Year of Glaciers’ Preservation in 2025, aiming to foster global action to mitigate the impacts of climate change on glaciers and the communities that depend on them.

The Past, Present, and Future of Climate Change
In the 1990s, we first hypothesized the non-linear acceleration of climate change. By the early 2000s, this hypothesis had evolved into established climate theory, now widely recognized as scientific fact. My lab partner, a Doctor of Physics from Ohio State, and I collaborated to provide key evidence supporting this theory. Over the years, we have observed a dramatic reduction in the doubling time of climate change impacts — the rate at which these effects intensify. Initially, the doubling time was approximately 100 years, but it has since decreased to 10 years and, more recently, to just 2 years. This trend implies that the damage caused by climate change today is double what it was two years ago. In two years, it could be four times worse; in four years, eight times worse; and within a decade, potentially 64 times worse. These projections are conservative, assuming the doubling period does not continue to shrink further. Alarmingly, this rapid acceleration does not appear to be an anomaly. If this trajectory persists, the consequences will likely be far more catastrophic than previously anticipated.

Rising Sea Level

The Human Induced Climate Change Experiment

bookmark_borderClimate Change: Adapt or Die

United Nations Press Release — UN scientists on Monday delivered a stark warning about the impact of climate change on people and the planet, saying that ecosystem collapse, species extinction, deadly heatwaves and floods are among the “unavoidable multiple climate hazards” the world will face over the next two decades due to global warming.

UN-IPCC-Climate-Change-March-2022 PDF

Climate change: a threat to human wellbeing and health of the planet. Taking action now can secure our future

BERLIN, Feb 28 – Human-induced climate change is causing dangerous and widespread disruption in nature and affecting the lives of billions of people around the world, despite efforts to reduce the risks. People and ecosystems least able to cope are being hardest hit, said scientists in the latest Intergovernmental Panel on Climate Change (IPCC) report, released today.

“This report is a dire warning about the consequences of inaction,” said Hoesung Lee, Chair of the IPCC. “It shows that climate change is a grave and mounting threat to our wellbeing and a healthy planet. Our actions today will shape how people adapt and nature responds to increasing climate risks.”

The world faces unavoidable multiple climate hazards over the next two decades with global warming of 1.5°C (2.7°F). Even temporarily exceeding this warming level will result in additional severe impacts, some of which will be irreversible. Risks for society will increase, including to infrastructure and low-lying coastal settlements.

The Summary for Policymakers of the IPCC Working Group II report, Climate Change 2022: Impacts, Adaptation and Vulnerability was approved on Sunday, February 27 2022, by 195 member governments of the IPCC, through a virtual approval session that was held over two weeks starting on February 14.

Urgent action required to deal with increasing risks

Increased heatwaves, droughts and floods are already exceeding plants’ and animals’ tolerance thresholds, driving mass mortalities in species such as trees and corals. These weather extremes are occurring simultaneously, causing cascading impacts that are increasingly difficult to manage. They have exposed millions of people to acute food and water insecurity, especially in Africa, Asia, Central and South America, on Small Islands and in the Arctic.

To avoid mounting loss of life, biodiversity and infrastructure, ambitious, accelerated action is required to adapt to climate change, at the same time as making rapid, deep cuts in greenhouse gas emissions. So far, progress on adaptation is uneven and there are increasing gaps between action taken and what is needed to deal with the increasing risks, the new report finds. These gaps are largest among lower-income populations.

The Working Group II report is the second instalment of the IPCC’s Sixth Assessment Report (AR6), which will be completed this year.

“This report recognizes the interdependence of climate, biodiversity and people and integrates natural, social and economic sciences more strongly than earlier IPCC assessments,” said Hoesung Lee. “It emphasizes the urgency of immediate and more ambitious action to address climate risks. Half measures are no longer an option.”

Safeguarding and strengthening nature is key to securing a liveable future

There are options to adapt to a changing climate. This report provides new insights into nature’s potential not only to reduce climate risks but also to improve people’s lives.

“Healthy ecosystems are more resilient to climate change and provide life-critical services such as food and clean water”, said IPCC Working Group II Co-Chair Hans-Otto Pörtner. “By restoring degraded ecosystems and effectively and equitably conserving 30 to 50 per cent of Earth’s land, freshwater and ocean habitats, society can benefit from nature’s capacity to absorb and store carbon, and we can accelerate progress towards sustainable development, but adequate finance and political support are essential.”

Scientists point out that climate change interacts with global trends such as unsustainable use of natural resources, growing urbanization, social inequalities, losses and damages from extreme events and a pandemic, jeopardizing future development.

“Our assessment clearly shows that tackling all these different challenges involves everyone – governments, the private sector, civil society – working together to prioritize risk reduction, as well as equity and justice, in decision-making and investment,” said IPCC Working Group II Co-Chair Debra Roberts.

“In this way, different interests, values and world views can be reconciled. By bringing together scientific and technological know-how as well as Indigenous and local knowledge, solutions will be more effective. Failure to achieve climate resilient and sustainable development will result in a sub-optimal future for people and nature.”

Cities: Hotspots of impacts and risks, but also a crucial part of the solution

This report provides a detailed assessment of climate change impacts, risks and adaptation in cities, where more than half the world’s population lives. People’s health, lives and livelihoods, as well as property and critical infrastructure, including energy and transportation systems, are being increasingly adversely affected by hazards from heatwaves, storms, drought and flooding as well as slow-onset changes, including sea level rise.

“Together, growing urbanization and climate change create complex risks, especially for those cities that already experience poorly planned urban growth, high levels of poverty and unemployment, and a lack of basic services,” Debra Roberts said.

“But cities also provide opportunities for climate action – green buildings, reliable supplies of clean water and renewable energy, and sustainable transport systems that connect urban and rural areas can all lead to a more inclusive, fairer society.”

There is increasing evidence of adaptation that has caused unintended consequences, for example destroying nature, putting peoples’ lives at risk or increasing greenhouse gas emissions. This can be avoided by involving everyone in planning, attention to equity and justice, and drawing on Indigenous and local knowledge.

A narrowing window for action

Climate change is a global challenge that requires local solutions and that’s why the Working Group II contribution to the IPCC’s Sixth Assessment Report (AR6) provides extensive regional information to enable Climate Resilient Development.

The report clearly states Climate Resilient Development is already challenging at current warming levels. It will become more limited if global warming exceeds 1.5°C (2.7°F). In some regions it will be impossible if global warming exceeds 2°C (3.6°F). This key finding underlines the urgency for climate action, focusing on equity and justice. Adequate funding, technology transfer, political commitment and partnership lead to more effective climate change adaptation and emissions reductions.

“The scientific evidence is unequivocal: climate change is a threat to human wellbeing and the health of the planet. Any further delay in concerted global action will miss a brief and rapidly closing window to secure a liveable future,” said Hans-Otto Pörtner.

bookmark_borderShorefalling Rainstorms

i have been reading of the floods in kerala (india, southwest)
and i just realized it isn’t just sea level rise and storm surge

these shorefalling rainstorms

a) pick up huge amounts of water off the ocean
b) drop it inland as they come ashore
c) all that water has to get out thru existing waterways
d) which is difficult, the same system has dumped a lot closer to shore already
e) and, of course added to stormsurge and sea level rise

the floods will come from both directions, the land and the ocean.
It is difficult to say which is worse, for the floods coming in from the land
will carry debris, and worse, poisons from pollution.

move far inland. The ocean, as i have said b4 is very large and wants in your basement.
But i didnt see clearly until now that watching oceanward is not enuf,
it can go over our heads thru the clouds and come in behind us.

Shoulda figured that out after Sandy.

I’m slo, but i get there.

sidd

LIVE

Kerala floods live
updates: Over 10
lakh in relief
camps; Centre declares disaster ‘calamity of severe nature’
Times of India
17 mins ago

LIVE

Kerala floods LIVE:
Devastation to cost
the state Rs 20000
cr, 40000 crore hectares of crops destroyed, says CM
Moneycontrol
52 mins ago
Bodies Found As
Water Recedes In
Kerala, Hundreds
Still Stuck: 10 Points
NDTV.com

More for kerala flood

Affected area
Affected area map

View on map

bookmark_borderOne Trillion Ton Iceberg

By Daniel Brouse

An iceberg weighing over one trillion tons (about the size of Delaware) broke off Antarctica. “Antarctica contains 90% of the world’s fresh water as ice. If all the ice melts, sea levels will rise by 60 meters (200 feet). The sea ice melting doesn’t raise the sea level as the ice is already floating.” (Brouse / Mukerhjee 2017)

Antarctica Larsen C Ice Crack

The new iceberg was already floating, so it won’t have much effect on the sea level; however, it may a destabilizing effect on the rest of Antarctica. “One warning sign that a dangerous warming is beginning in Antarctica, will be a breakup of ice shelves in the Antarctic Peninsula just south of the recent January 0C isotherm; the ice shelf in the Prince Gustav Channel on the east side of the peninsula, and the Wordie Ice Shelf; the ice shelf in George VI Sound, and the ice shelf in Wilkins Sound on the west side.” (John Mercer 1978)

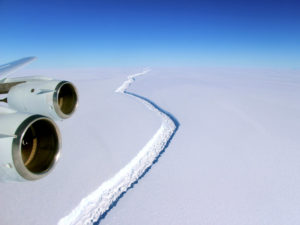
In January of 2017, a UK research team discovered a huge increase in a massive 90-mile crack running through the Larsen C shelf (pictured to the right). In June of 2017, the crack broke and a huge iceberg was created.

Ice Shelf Animation By Doyle Rice and Jim Sergent

See: Antarctica And Rising Sea Level

bookmark_borderClimate Change Breaks Multiple Records with Global Impacts

The World Meteorological Organization (WHO) issued a report that states records for 2016:

  • a record global temperature
  • exceptionally low sea ice
  • unabated sea level rise
  • ocean heat

Extreme weather and climate conditions have continued into 2017.

“This report confirms that the year 2016 was the warmest on record – a remarkable 1.1 °C above the pre-industrial period, which is 0.06 °C above the previous record set in 2015. This increase in global temperature is consistent with other changes occurring in the climate system,” said WMO Secretary-General Petteri Taalas.

“Globally averaged sea surface temperatures were also the warmest on record, global sea levels continued to rise, and Arctic sea-ice extent was well below average for most of the year,” he said.

“With levels of carbon dioxide in the atmosphere consistently breaking new records, the influence of human activities on the climate system has become more and more evident,” said Mr Taalas.

The report goes on to say: Global sea levels rose very strongly during the El Niño event, with the early 2016 values reaching new record highs. Global sea ice extent dropped more than 4 million square kilometres below average in November, an unprecedented anomaly for that month.

The very warm ocean temperatures contributed to significant coral bleaching and mortality was reported in many tropical waters, with important impacts on marine food chains, ecosystems and fisheries.

Carbon dioxide levels in the atmosphere reached the symbolic benchmark of 400 parts per millions in 2015 – the latest year for which WMO global figures are available – and will not fall below that level for many generations to come because of the long-lasting nature of CO2.

Noteworthy extreme events in 2016 included severe droughts that brought food insecurity to millions in southern and eastern Africa and Central America. Hurricane Matthew caused widespread suffering in Haiti as the first category 4 storm to make landfall since 1963, and inflicted significant economic losses in the United States of America, while heavy rains and floods affected eastern and southern Asia.

The extreme weather continues in 2017.
In addition to the report on 2016, the WHO issued a supplement for 2017:
“Even without a strong El Niño in 2017, we are seeing other remarkable changes across the planet that are challenging the limits of our understanding of the climate system. We are now in truly uncharted territory,” said World Climate Research Programme Director David Carlson.

At least three times so far this winter, the Arctic has witnessed the Polar equivalent of a heatwave, with powerful Atlantic storms driving an influx of warm, moist air. This meant that at the height of the Arctic winter and the sea ice refreezing period, there were days which were actually close to melting point. Antarctic sea ice has also been at a record low, in contrast to the trend in recent years.

Scientific research indicates that changes in the Arctic and melting sea ice is leading to a shift in wider oceanic and atmospheric circulation patterns. This is affecting weather in other parts of the world because of waves in the jet stream – the fast moving band of air which helps regulate temperatures.

Thus, some areas, including Canada and much of the USA, were unusually balmy, whilst others, including parts of the Arabian peninsula and North Africa, were unusually cold in early 2017.

In the USA alone, 11,743 warm temperature records were broken or tied in February, according to the US National Oceanic and Atmospheric Administration. Prolonged and extreme heat in January and February affected New South Wales, southern Queensland, South Australia and northern Victoria, and saw many new temperature records.

Highlights of the 2016 Statement

Global Temperatures:

2016’s warmth extended almost worldwide. Temperatures were above the 1961-90 average over the vast majority of the world’s land areas, the only significant exceptions being an area of South America centred on central Argentina, and parts of south-western Australia.

Mean annual temperatures at least 3 °C above the 1961-1990 average occurred in various high-latitude locations, particularly along the Russian coast and in Alaska and far north-western Canada, and on islands in the Barents and Norwegian Seas. In the high Arctic, Svalbard (Norway) Airport’s 2016 mean annual temperature of −0.1 °C was 6.5 °C above the 1961-1990 average, and 1.6 °C above the previous record.

Outside the Arctic, 2016’s warmth was more notable for its consistency across the globe than for its extreme nature in individual locations.

Oceans

Globally averaged sea surface temperatures in 2016 were the warmest on record. The anomalies were strongest in the early months of 2016.

Global ocean heat content was the second-highest on record after 2015. It reached new record highs in the northern hemisphere, but was cooler in the southern hemisphere.

Globally, sea level has risen by 20 cm since the start of the twentieth century, mostly due to thermal expansion of the oceans and melting of glaciers and ice caps. Global sea levels rose very strongly during the 2015/2016 El Niño, rising about 15 millimetres between November 2014 to a new record high in February 2016. This was well above the post-1993 trend of 3 to 3.5 mm per year. From February to August, sea levels remained fairly stable as the influence of the El Niño declined. Final 2016 sea level data are not yet available at the time of writing.

Arctic sea ice

The seasonal maximum, of 14.52 million square kilometres on 24 March, was the lowest in the 1979-2016 satellite record. The 2016 autumn freeze-up was exceptionally slow – with sea ice extent even contracting for a few days in mid-November.

Precipitation

Much of southern Africa began the year in severe drought. For the second year in succession, rainfall was widely 20 to 60% below average for the summer rainy season (October to April) in 2015/2016. The World Food Programme estimating that 18.2 million people would require emergency assistance by early 2017.

Provisional figures showed 2016 was the driest on record over the Amazon Basin, and there was also significant drought in north-east Brazil.  El Niño brought drought conditions elsewhere in Central America and northern South America.

The Yangtze basin in China experienced, overall, its most significant flood season since 1999, with some tributaries experiencing record flood levels. Averaged over China as a whole, it was the wettest year on record, with national mean rainfall of 730 mm being 16% above the long-term average.

Heatwaves

The year started with an extreme heatwave in southern Africa in the first week of January. On 7 January, it reached 42.7 °C at Pretoria and 38.9 °C at Johannesburg, both of which were 3 °C or more above the all-time records at those sites.

Extreme heat also affected South and South-East Asia in April and May, prior to the start of the summer monsoon. South-East Asia was badly affected in April. A national record of 44.6 °C was set at Mae Hong Son, Thailand, on 28 April, and 51.0 °C was observed on 19 May at Phalodi, the highest temperature on record for India.

Record or near-record temperatures occurred in parts of the Middle East and north Africa. The highest temperature observed was 54.0 °C at Mitribah (Kuwait) on 21 July which (subject to ratification) will be the highest temperature on record for Asia. Other extremely high temperatures included 53.9 °C at Basra (Iraq) and 53.0 °C at Delhoran (Islamic Republic of Iran – a national record), both on 22 July, whilst significant high temperatures were also reported in Morocco, Tunisia, Libya and the United Arab Emirates.

A late-season heatwave affected many parts of western and central Europe in the first half of September. In southern Spain, 45.4 °C was recorded at Cordoba on 6 September.

ABOUT WMO
WMO is a specialized agency of the United Nations (UN) with 191 Member States and Territories. It is the UN system’s authoritative voice on the state and behaviour of the Earth’s atmosphere, its interaction with the land and oceans, the weather and climate it produces and the resulting distribution of water resources.

Additional References
Guide To Climate Change
The Human Induced Climate Change Experiment

bookmark_borderAtlantic City Going Under

by Daniel Brouse

Atlantic City, NJ / Sea Level Rising

For decades businesses located on the island of Atlantic City have been scenario planning for climate change and rising sea levels. At the turn of the century, the casinos devised a plan to float their businesses and ferry gamblers in. Now, the rising waters are no longer a scenario.

So-called “nuisance flooding” — which causes public inconveniences such as frequent road closures, overwhelmed storm drains, and compromised infrastructure — has increased on all three U.S. coasts, between 300 and 925 percent since the 1960s, according to a 2014 NOAA report

“As relative sea level increases, it no longer takes a strong storm or a hurricane to cause flooding,” said William Sweet, Ph.D., oceanographer at NOAA’s Center for Operational Oceanographic Products and Services (CO-OPS) and the report’s lead author. “Flooding now occurs with high tides in many locations due to climate-related sea level rise, land subsidence and the loss of natural barriers. The effects of rising sea levels along most of the continental U.S. coastline are only going to become more noticeable and much more severe in the coming decades, probably more so than any other climate-change related factor.”

Atlantic City, N.J. ranked third in the top ten U.S. areas that experience nuisance flooding with a 682% surge since 1957.

“It started with a thunderstorm — high tide, heavy rain — and suddenly we had 6 inches of water in the entire office,” said Yellow Cab owner Paul Rosenberg. “We thought it was a freak thing and we had to submit insurance claims for drywall.” But, it keeps happening.

“It’s these smaller events where the accumulated toll begins chipping away at infrastructure,” says William Sweet, a NOAA oceanographer who has studied nuisance flooding. “The way the public will notice the impacts of sea level rise will be through nuisance tidal flooding. What this sea level rise does is it increases everything: the mean (sea level), the height of high tides and the water levels during severe events.”

“Sandy, as devastating as it was, isn’t the greatest barometer because we have flash floods,” said Cathy Burke, who has run the Irish Pub since 1973. We can have floods at the drop of a hat. Without even realizing we’re going to have them. It’ll be raining and within seconds you’ll see flooding in the street. You don’t read about it in the paper. You don’t hear about it on the radio or television. You just have water that just comes up and if you don’t have warning and move your car, you have water in the car.”

“There is no central place that makes all the decisions, so you get one town building a pump station to push water out and another town pumping the water back to the same place,” said Rouzbeh Nazari, an environmental engineering expert at Rowan University. “It kind of feels like we’ve just given up, that we can’t do anything about it. I’m less worried about a Sandy-like event than nuisance flooding. They are losing 20 cars a month to nuisance flooding on Absecon Island. We need a regional solution but New Jersey has no specific plan to deal with it

“The Native Americans were a lot smarter than the European settlers,” said James Whalen, a former Atlantic City mayor and now state senator. “The barrier islands up and down the coast really should not have been built on, but here we are.”

A spokesman for Chris Christie said: “I don’t know what you want me to do, you want me to go down there with a mop?”

Sources: NOAA, The Guardian, The Press of Atlantic City

Climate Change

Rising Sea Level

Flood Insurance

Extreme Weather Events

bookmark_borderAntarctica And Rising Sea Level

by Daniel Brouse and Sidd Mukherjee

The U.N. weather agency said the Antarctic peninsula has set a heat record of 63.5° Fahrenheit (17.5 degrees Celsius) on March 24, 2015. In March of 2017, there is about 10% less sea ice in Antarctica than the previous record minimum. “One would probably say that the old record was obliterated,” said Jan Lieser, a sea ice scientist at the Hobart-based Antarctic Climate and Ecosystems Co-operative Research Centre.

Antarctica contains 90% of the world’s fresh water as ice. If all the ice melts, sea levels will rise by 60 meters (200 feet). The sea ice melting doesn’t raise the sea level as the ice is already floating. The ice that is above land is a different story.

The problem with the ice in Antarctica is that much of the ice is on land. As the land ice melts or falls into the ocean the sea level rises. Compounding the problem is the elevation of the land. Over the centuries the weight of the ice has caused the land to sink. As the ocean temperature warms, water is starting to seep in under the ice. The warm water under the ice sheet is accelerating the destabilization of the sheet.

“There was a physicist called John Mercer at the Byrd polar research center here at Ohio State, who was warning of WAIS collapse as early as 1968,” said Sidd Mukherjee research physicist at Ohio State University.

Then in 1978 Mercer wrote:
“One warning sign that a dangerous warming is beginning in Antarctica, will be a breakup of ice shelves in the Antarctic Peninsula just south of the recent January 0C isotherm; the ice shelf in the Prince Gustav Channel on the east side of the peninsula, and the Wordie Ice Shelf; the ice shelf in George VI Sound, and the ice shelf in Wilkins Sound on the west side. ”

Each of these shelves is in retreat or gone. Mercer was more correct than he knew. Recent work by Bassis et al. shows that ice shelves collapse shortly after the temperature of the top surface exceeds the 0C melting point through a process called hydrofracture, where water filled crevasses penetrate all the way to the bottom of the shelf. Bassis et al. also pointed out that a cliff of ice higher than 100m (300 ft) is unstable against collapse. These cliff heights are attained where the bedrock is more than 1Km below sea level, as in large parts of WAIS. When the shelves melt leaving cliffs behind which directly face the ocean they will collapse along large sections of WAIS. The more frightening estimates for WAIS deglaciation are on the order of centuries, rather than millennia, indeed decadal time scales cannot be entirely ruled out. We know from past records that sea level can rise as fast as a foot a decade and maintain that rate for five hundred years. Such rates of sea level rise will destroy most coastal cities of the world, since coastal infrastructure cannot be moved inland or protected by seawalls quickly enough.

Antarctica Larsen C Ice Crack

In January of 2017, a UK research team discovered a huge increase in a massive 90-mile crack running through the Larsen C shelf (pictured to the right). The crack might soon split off a chunk of ice the size of Delaware. Larson C is part of Eastern Antarctic. Larson A and Larson B have already collapsed.

The Western Antarctic Ice Sheet (WAIS) is the segment of the continental ice sheet that covers West Antarctica. The melting of the West Antarctic ice sheet alone would raise global sea levels by more than 20 feet, according to researchers from the British Antarctic Survey. Over the last several years, WAIS has become unstable. A 2016 study by Khazendar, Rignot, and others adds to the mounting evidence that the threshold for an irreversible disintegration has begun.

“It’s generally accepted that it’s no longer a question of whether the West Antarctic Ice Sheet will melt, it’s a question of when,” said leader Ian Howat, associate professor of earth sciences at Ohio State in a 2016 study published in the journal Geophysical Research Letters. “This kind of rifting behavior provides another mechanism for rapid retreat of these glaciers, adding to the probability that we may see significant collapse of West Antarctica in our lifetimes.”

Ice calving is the breaking of ice chunks from the edge of a glacier. Calving causes mini-tsunamis daily in Antarctica.

The Thwaites Glacier is of great concern. Thwaites Glacier is an unusually broad and fast Antarctic glacier flowing into Pine Island Bay. As the warming temperature of sea water melts the bottom of the glacier, it allows water to enter underneath the ice. A University of Washington study determined that the Thwaites Glacier will gradually melt, leading to an irreversible collapse over the next 200 to 1000 years.