bookmark_borderClimate Denial and Climate Change Change

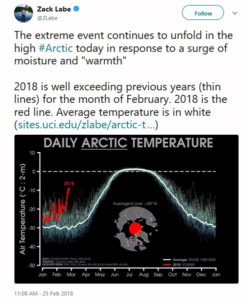
The North Pole saw record high temperatures for February during 2018.

Record Temperature at North Pole

Reuters reported:
Temperatures may have soared as high as 35 degrees Fahrenheit (2 degrees Celsius) at the pole, according to the U.S. Global Forecast System model. While there are no direct measurements of temperature there, Zack Labe, a climate scientist working on his PhD at the University of California at Irvine, confirmed that several independent analyses showed “it was very close to freezing,” which is more than 50 degrees (30 degrees Celsius) above normal.

The warm intrusion penetrated right through the heart of the Central Arctic, Labe said. The temperature averaged for the entire region north of 80 degrees latitude spiked to its highest level ever recorded in February. The average temperature was more than 36 degrees (20 degrees Celsius) above normal. “No other warm intrusions were very close to this,” Labe said in an interview, describing a data set maintained by the Danish Meteorological Institute that dates back to 1958. “I was taken by surprise how expansive this warm intrusion was.”

Climate scientist Sidd Mukherjee added, “Yes. Even more scarily — the fast ice north of Greenland is gone. That was some of the oldest ice left. It hasn’t melted, just been blown away and drifted away with the currents.” (see “Talk about unprecedented“)

An article in Rolling Stone about climate migrations quotes Solomon Hsiang:
Hsiang has many good papers outAn article in Rolling Stone about climate migrations quotes Solomon Hsiang:
“Most people don’t realize how much climate affects everything, from their property values to how hard people work,” says Solomon Hsiang, a professor of public policy at the University of California, Berkeley, who led a recent study that predicts, as the climate warms, there will be “a large transfer of value northward and westward.” And the wealthy, who can afford to adapt, will benefit, while the poor, who will likely be left behind, will suffer. “If we continue on the current path,” Hsiang says, “our analysis suggests that climate change may result in the largest transfer of wealth from the poor to the rich in the country’s history.”

Dr. Mukherjee replied, “But for city officials in at-risk cities, homeowners like Brown are terrifying. “Once people start thinking about the long-term value of their homes and how they will be impacted by climate change, that changes the game completely,” a county attorney in Florida says. What happens to the value of a house in, for instance, Fort Lauderdale, when the cost of flood insurance triples? “When I think about the future of South Florida, it’s flood insurance that scares me the most,” Wayne Pathman, a prominent Miami lawyer and board member of Miami Beach’s chamber of commerce, tells me. Many officials fear a climate-driven exodus that pushes down property values, which in turn reduces property-tax revenues, which are central to funding city services like police and teachers, not to mention road repair and infrastructure maintenance, at precisely the moment when the city needs to spend more to adapt to climate change.

Flooding in downtown Miami after Hurricane Irma in September 2017. Kadir van Lohuizen/NOOR/Redux

It’s a downward spiral for real estate that’s very hard to reverse. “It’s just like the dynamic in the stock market,” says U.C. Berkeley’s Hsiang. “The longer you hold on, the more you have to lose.” And, in many cases, the regions of the country where climate-change denial is strongest, such as the Southeast, are exactly the regions where residents have the most to lose. “In many places, climate denial is going to turn out to have big economic consequences,” Hsiang says.
[Hsiang has many good papers out]

WARNING: Do not buy real estate on or near floodplain.

From The Human Induced Climate Change Experiment

bookmark_borderClimate Change Breaks Multiple Records with Global Impacts

The World Meteorological Organization (WHO) issued a report that states records for 2016:

  • a record global temperature
  • exceptionally low sea ice
  • unabated sea level rise
  • ocean heat

Extreme weather and climate conditions have continued into 2017.

“This report confirms that the year 2016 was the warmest on record – a remarkable 1.1 °C above the pre-industrial period, which is 0.06 °C above the previous record set in 2015. This increase in global temperature is consistent with other changes occurring in the climate system,” said WMO Secretary-General Petteri Taalas.

“Globally averaged sea surface temperatures were also the warmest on record, global sea levels continued to rise, and Arctic sea-ice extent was well below average for most of the year,” he said.

“With levels of carbon dioxide in the atmosphere consistently breaking new records, the influence of human activities on the climate system has become more and more evident,” said Mr Taalas.

The report goes on to say: Global sea levels rose very strongly during the El Niño event, with the early 2016 values reaching new record highs. Global sea ice extent dropped more than 4 million square kilometres below average in November, an unprecedented anomaly for that month.

The very warm ocean temperatures contributed to significant coral bleaching and mortality was reported in many tropical waters, with important impacts on marine food chains, ecosystems and fisheries.

Carbon dioxide levels in the atmosphere reached the symbolic benchmark of 400 parts per millions in 2015 – the latest year for which WMO global figures are available – and will not fall below that level for many generations to come because of the long-lasting nature of CO2.

Noteworthy extreme events in 2016 included severe droughts that brought food insecurity to millions in southern and eastern Africa and Central America. Hurricane Matthew caused widespread suffering in Haiti as the first category 4 storm to make landfall since 1963, and inflicted significant economic losses in the United States of America, while heavy rains and floods affected eastern and southern Asia.

The extreme weather continues in 2017.
In addition to the report on 2016, the WHO issued a supplement for 2017:
“Even without a strong El Niño in 2017, we are seeing other remarkable changes across the planet that are challenging the limits of our understanding of the climate system. We are now in truly uncharted territory,” said World Climate Research Programme Director David Carlson.

At least three times so far this winter, the Arctic has witnessed the Polar equivalent of a heatwave, with powerful Atlantic storms driving an influx of warm, moist air. This meant that at the height of the Arctic winter and the sea ice refreezing period, there were days which were actually close to melting point. Antarctic sea ice has also been at a record low, in contrast to the trend in recent years.

Scientific research indicates that changes in the Arctic and melting sea ice is leading to a shift in wider oceanic and atmospheric circulation patterns. This is affecting weather in other parts of the world because of waves in the jet stream – the fast moving band of air which helps regulate temperatures.

Thus, some areas, including Canada and much of the USA, were unusually balmy, whilst others, including parts of the Arabian peninsula and North Africa, were unusually cold in early 2017.

In the USA alone, 11,743 warm temperature records were broken or tied in February, according to the US National Oceanic and Atmospheric Administration. Prolonged and extreme heat in January and February affected New South Wales, southern Queensland, South Australia and northern Victoria, and saw many new temperature records.

Highlights of the 2016 Statement

Global Temperatures:

2016’s warmth extended almost worldwide. Temperatures were above the 1961-90 average over the vast majority of the world’s land areas, the only significant exceptions being an area of South America centred on central Argentina, and parts of south-western Australia.

Mean annual temperatures at least 3 °C above the 1961-1990 average occurred in various high-latitude locations, particularly along the Russian coast and in Alaska and far north-western Canada, and on islands in the Barents and Norwegian Seas. In the high Arctic, Svalbard (Norway) Airport’s 2016 mean annual temperature of −0.1 °C was 6.5 °C above the 1961-1990 average, and 1.6 °C above the previous record.

Outside the Arctic, 2016’s warmth was more notable for its consistency across the globe than for its extreme nature in individual locations.

Oceans

Globally averaged sea surface temperatures in 2016 were the warmest on record. The anomalies were strongest in the early months of 2016.

Global ocean heat content was the second-highest on record after 2015. It reached new record highs in the northern hemisphere, but was cooler in the southern hemisphere.

Globally, sea level has risen by 20 cm since the start of the twentieth century, mostly due to thermal expansion of the oceans and melting of glaciers and ice caps. Global sea levels rose very strongly during the 2015/2016 El Niño, rising about 15 millimetres between November 2014 to a new record high in February 2016. This was well above the post-1993 trend of 3 to 3.5 mm per year. From February to August, sea levels remained fairly stable as the influence of the El Niño declined. Final 2016 sea level data are not yet available at the time of writing.

Arctic sea ice

The seasonal maximum, of 14.52 million square kilometres on 24 March, was the lowest in the 1979-2016 satellite record. The 2016 autumn freeze-up was exceptionally slow – with sea ice extent even contracting for a few days in mid-November.

Precipitation

Much of southern Africa began the year in severe drought. For the second year in succession, rainfall was widely 20 to 60% below average for the summer rainy season (October to April) in 2015/2016. The World Food Programme estimating that 18.2 million people would require emergency assistance by early 2017.

Provisional figures showed 2016 was the driest on record over the Amazon Basin, and there was also significant drought in north-east Brazil.  El Niño brought drought conditions elsewhere in Central America and northern South America.

The Yangtze basin in China experienced, overall, its most significant flood season since 1999, with some tributaries experiencing record flood levels. Averaged over China as a whole, it was the wettest year on record, with national mean rainfall of 730 mm being 16% above the long-term average.

Heatwaves

The year started with an extreme heatwave in southern Africa in the first week of January. On 7 January, it reached 42.7 °C at Pretoria and 38.9 °C at Johannesburg, both of which were 3 °C or more above the all-time records at those sites.

Extreme heat also affected South and South-East Asia in April and May, prior to the start of the summer monsoon. South-East Asia was badly affected in April. A national record of 44.6 °C was set at Mae Hong Son, Thailand, on 28 April, and 51.0 °C was observed on 19 May at Phalodi, the highest temperature on record for India.

Record or near-record temperatures occurred in parts of the Middle East and north Africa. The highest temperature observed was 54.0 °C at Mitribah (Kuwait) on 21 July which (subject to ratification) will be the highest temperature on record for Asia. Other extremely high temperatures included 53.9 °C at Basra (Iraq) and 53.0 °C at Delhoran (Islamic Republic of Iran – a national record), both on 22 July, whilst significant high temperatures were also reported in Morocco, Tunisia, Libya and the United Arab Emirates.

A late-season heatwave affected many parts of western and central Europe in the first half of September. In southern Spain, 45.4 °C was recorded at Cordoba on 6 September.

ABOUT WMO
WMO is a specialized agency of the United Nations (UN) with 191 Member States and Territories. It is the UN system’s authoritative voice on the state and behaviour of the Earth’s atmosphere, its interaction with the land and oceans, the weather and climate it produces and the resulting distribution of water resources.
Additional References
Guide To Climate Change
The Human Induced Climate Change Experiment

bookmark_borderHottest Year

By Daniel Brouse
For The Human Induced Climate Change Experiment

2016 was Earth’s warmest year in at least the last 125,000 years. It marks the third record year in a row.

NOAA reported, “The globally averaged temperature over land and ocean surfaces for 2016 was the highest among all years since record keeping began in 1880. During the final month, the December combined global land and ocean average surface temperature was the third highest for December in the 137-year record . During 2016, the globally-averaged land surface temperature was 2.57°F (1.43°C) above the 20th century average. This was the highest among all years in the 1880–2016 record, surpassing the previous record of 2015 by 0.18°F (0.10°C).”

Experts believe that a 1.5°C to 2°C increase is a tipping point that could make global warming irreversible. The 1.43°C increase is of grave concern.

Arctic ice also reached a record low. “Recent trends in the decline of Arctic polar sea ice extent continued in 2016.” The estimated average annual sea ice extent in the Arctic was approximately 3.92 million square miles. The smallest annual average on record.

bookmark_borderChilling Facts About Antarctica

by Daniel Brouse for The Human Induced Climate Change Experiment

A 1,930 square mile chunk of ice is getting ready to fall off a glacier in Antarctica. In December 2016, a large crack appeared in part of Larsen C ice shelf.

Global warming is increasing the temperature of the ocean water even more than the temperature of the air; however, Andrew Fleming (sensing manager at the British Antarctic Survey) said the ice was being thawed both by warmer air above and by warmer waters below the ice.

The Larsen B ice shelf has already been severely impacted. “Larsen B shattered like car safety glass into thousands and thousands of pieces,” Fleming said. “It disappeared in the space of about a week.”

“If it doesn’t go in the next few months, I’ll be amazed,” project leader Prof Adrian Luckman said. “There hasn’t been enough cloud-free Landsat images but we’ve managed to combine a pair of Esa Sentinel-1 radar images to notice this extension, and it’s so close to calving that I think it’s inevitable.”

bookmark_borderNorth Pole In Danger

In a study published by Geert Jan van Oldenborgh, Marc Macias-Fauria, Andrew King, Peter Uhe, Sjoukje Philip, Sarah Kew, David Karoly, Friederike Otto, Myles Allen, and Heidi Cullen, the scientists found the unusually high temperatures around the North Pole in November–December 2016 were influenced by anthropogenic climate change:

The climate of the North Pole in winter is extreme, with 24 hours of darkness and very cold temperatures that vary from year to year and decade to decade. This year, the North Pole and the surrounding Arctic region are seeing record-high temperatures in November and December and record-low ice extent). Fall usually ushers in the season of sea ice growth, but November saw a brief retreat that was virtually unprecedented in nearly 40 years of satellite records, according to the National Snow and Ice Data Center. That dip helped November set a record low for sea ice area since 1850 (Walsh et al, 2016). By December, the area around the North Pole is typically 95 percent covered by sea ice. However, this year it is only about 80 percent.

Mid-November saw an early winter “heat wave” with the temperature on November 11 reaching -7 ºC (19 ºF) – that is 15 ºC (27 ºF) above normal for the time of year. The monthly mean November temperature was 13 ºC (23 ºF) above normal on the pole. Temperatures in this region declined slightly after that but remained well above normal. The forecast for the next few days is again more than 15 ºC (27 ºF) above normal at the North Pole itself and 10 ºC (18 ºF) averaged over 80–90 ºC N.

To quantify how rare the event was, we computed the November-December averaged temperature around the North Pole (80–90 ºN) in the ERA-interim reanalysis augmented with the ECMWF analysis and forecast up to December 25 and persistence up to December 31. The temperatures are slightly less extreme than at the pole itself (Fig. 2), but unprecedented in the satellite era from 1979 onwards.

We first note some of the impacts of these high temperatures in the Arctic regions. Next we describe the physical mechanisms that are responsible for sea ice and temperature variability in the North Pole region, which is warming faster than anywhere else in the world. We then analyse the observed temperatures via a related time series encompassing the northern-most meteorological observations on land (70–80 ºN). This allows for a reconstruction of Arctic temperatures back to about 1900, which clearly shows how the current warmth is unprecedented over that period. It also gives a rough estimate of how rare it is in the current climate and how much the probability has changed over the last century.

Finally, we perform a multi-method analysis of North Pole temperatures with two sets of climate models: the CMIP5 multi-model ensemble that was used for the 2013 IPCC AR5 report, and a large ensemble of model runs in the Weather@Home project. Both sets of models give very comparable results, showing that the bulk of the increase is due to anthropogenic emissions. The results are combined in the synthesis and conclusions.

Impacts

Extreme warm events in the Arctic extend into biological and social implications. Unlike the Antarctic, Arctic lands are inhabited and their socio-economic systems are greatly affected by the impacts of extreme and unprecedented sea ice dynamics and temperatures. Recent work by Henri Huntington and colleagues reported on these effects on the timing of marine mammal migrations, their distribution and behaviour and the efficacy of certain hunting methods in the Beaufort Sea. Less than a month ago, Forbes and colleagues reported on the relationship between unseasonal sea ice decline in winter and the enhanced probability of rain-on-snow events in the Yamal Peninsula in north-Western Siberia. While rain on snow does not cause problems in spring, it can be catastrophic for reindeer in the autumn when rain turns to an ice crust as plummeting normal temperatures return. This crust, often several centimetres thick, prevents the reindeer from feeding on fodder beneath the snow throughout the winter months. Two extreme weather events in 2006 and 2013 caused mass starvation among the reindeer herds (one event alone in 2013 resulted in 61,000 reindeer deaths, about 22 percent out of 275,000 reindeer on the Yamal Peninsula), and were linked with sea ice loss in the adjoining Barents and Kara seas. These two examples only illustrate the variety of ways in which climate change in the Arctic directly affects its ecosystems and societies. Many others include effects on the timing of phytoplankton blooms (which are at the base of the food chain in the Arctic ocean) and terrestrial plants, their consequences for animals that depend on these resources, opportunities for invasive southern species to colonise the region, enhanced mobility around the Arctic region for marine mammals such as whales, or reduced and largely modified habitat for animals that directly depend on sea ice such as the polar bear.

Some background

The Arctic is the fastest-warming region on Earth, with the largest temperature increases in winter. In summer, the temperature is constrained by all the ice melting and it never rises very far above zero. However, the extra heat absorbed in summer is released in autumn and winter as the water remains warmer for longer and re-freezing sea ice releases the latent energy of melting.

This “Arctic amplification” of the global warming trend has several causes (see e.g., IPCC WG1 AR5 Box 5.1, Screen & Simmonds, 2010; Bintanja et al, 2011). The best-known is the extra warming due to the change in color (albedo-feedback): when white snow and ice is replaced by dark land and ocean, a much larger fraction of the incoming sunshine is absorbed instead of reflected. This extra heat warms the surface even more. Another positive feedback is less well known and is based on the observation that the warming trend in the Arctic is mainly confined to the lower part of the atmosphere. This is still far below the levels where thermal radiation escapes from the atmosphere on average, which is around 5 km (3 miles) high. This implies that the radiative cooling of the warmer air near the surface is not as efficient as in lower latitudes where the trend at altitude is similar to (mid-latitudes) or higher than (tropics) near the surface. The reduction of radiative cooling due to the vertical structure of the warming trend is called the lapse-rate feedback.

Variability has also increased in the Arctic. On top of the positive feedbacks mentioned above, this is due to two other factors. First, the shape of the Arctic Ocean. Before global warming began in earnest, the basin was filled with ice for most of the year, which implies that except for a few summer months the edge of the ice was relatively short and confined to the Atlantic sector. Now, there are more months in which the ice edge is free of the continents. This allows larger changes from year to year (van der Linden et al, 2014). Another factor is the thickness of the ice. The ice has thinned dramatically, with most of it now single-year ice that is much thinner, and hence flows and melts more quickly (Tschudi et al, 2016). This type of ice changes much more quickly at the whim of the ever-capricious weather, especially combined with the waves and swell that now develop in the ice-free regions (Thomson and Rogers, 2014).

Finally, warm episodes near the pole are usually due to so-called “moist intrusions”: warm and moist air from the mid-latitudes that not only advects heat, but also clouds that block outgoing long-wave radiation and hence trap more heat. There is some evidence that these have become more frequent (Woods and Caballero, 2016).

Discussion and conclusions

We have investigated the rarity of the November-December 2016 average temperature around the North Pole and assessed how much November-December average temperatures have changed over the past century using observations over a wider region. We also attempted to quantify how much high Arctic temperatures have changed due to anthropogenic emissions (greenhouse gases and aerosols) in two climate model ensembles.

The observations and the bias-corrected CMIP5 ensemble point to a return period of about 50 to 200 years in the present climate, i.e., the probability of such an extreme is about 0.5 percent to two percent every year, with a large uncertainty. This is rare, but it should be kept in mind that we are focusing on this particular November–December period precisely because an unusual event has occurred. For a random two-month period it would be between six and 12 times more likely. The prescribed SST design of the HadAM3P simulations precludes estimating an absolute return period.

The observations show that November–December temperatures have risen on the North Pole, modulated by decadal North Atlantic variability. For all phases of this variability a warm event like the one of this year would have been extremely unlikely in the climate of a century ago. The probability was so small it is hard to estimate, but less than 0.1 percent per year. The model analyses show that the event would also have been extremely unlikely in a world without anthropogenic emissions of greenhouse gases and aerosols, attributing the cause of the change to human influences. This also holds for the warm extremes caused by the type of circulation of November 2016. If nothing is done to slow climate change, by the time global warming reaches 2 ºC (3.6 ºF) events like this winter would become common at the North Pole, happening every few years.

bookmark_borderAntarctic Glacial Ice Melt

Australia’s ABC news reports:

Scientists hope to discover how warm water is reaching one of the world’s largest glaciers, causing it to melt rapidly.

Lead author Steve Rintoul said it was the first time scientists had been able to test the hypothesis that warm ocean waters were driving the glacier’s thinning.

“We knew the Totten has been thinning faster than other glaciers in East Antarctica, but nobody has known exactly why until we took these measurements,” he said.

“We found that warmer ocean water is reaching the cavity through this channel at temperatures capable of melting the ice shelf at the point where it meets ground.

Dr Rintoul said it was important to be able to predict the Totten glacier’s future behaviour, because it contained enough sea ice to raise global sea levels by about 3.5 metres.

“So the real importance of the research is that it helps provide some clues about how sea level might change in the future.”

The publication of the research today comes as scientists make their way back to the Totten glacier, where they hope to find more clues about what controls the amount of warm water reaching the glacier.

A team of about 30 scientists, technicians and PhD students left Hobart on December 8 and plan to arrive at the glacier in late December.

Dr. Rintoul said their goal was to learn more about the pathways that bring the warm water up from the deep ocean.

“Understanding the physical processes delivering heat to the ice shelf will help us assess the vulnerability of the East Antarctic ice sheet to future changes in the Southern Ocean,” he said.

“What we have shown is that warm water reaches the glacier. What we need to know is what’s going to happen in the future.

Dr. Tas van Ommen from the Australian Antarctic Division said it would be concerning to see an increase in the Totten glacier’s natural melt rate.

“If its natural melt rate was to increase because of changes in ocean circulation, that would then add to the sea level rise that we see from glaciers already melting in Antarctica, particularly in the West.

“So we are concerned to track that and to be able to predict what might happen in the future.”

bookmark_borderAntarctica: Melting Glacier Could See Sea Levels to Rise by 6 Feet

In a new study by Imperial College of London, “current rates of climate change could trigger instability in a major Antarctic glacier, ultimately leading to more than 2m of sea-level rise.”

“The evidence coming together is painting a picture of East Antarctica being much more vulnerable to a warming environment than we thought,” said Professor Martin Siegert, Co-Director of the Grantham Institute at Imperial College London. “This is something we should worry about. Totten Glacier is losing ice now, and the warm ocean water that is causing this loss has the potential to also push the glacier back to an unstable place.”

“Totten Glacier is only one outlet for the ice of the East Antarctic Ice Sheet, but it could have a huge impact. The East Antarctic Ice Sheet is by far the largest mass of ice on Earth, so any small changes have a big influence globally.”

bookmark_borderFeedback Loops

Feedback loops accelerate global warming.

In the 1990’s, the Membrane Domain started publishing research on human induced climate change. The research team was the first to put forth the hypothesis that global warming is an exponential phenomenon. Up to that point, the scientific community had based their forecasts on a linear event. The Membrane Domain suggested the model was more like a bathtub curve or hockey stick curve.

Since that time, the hypothesis has been proven. One of the main factors are chain reactions that are caused by the result. The chain reactions have been given the name “feedback loops”.

“Feedback in general is the process in which changing one quantity changes a second quantity, and the change in the second quantity in turn changes the first. Positive feedback amplifies the change in the first quantity….” (Wikipedia)

An example of a feedback loop, it the melting of Arctic sea ice. Methane, one of the most severe greenhouse gases, is trapped under the ice. However, when global warming causes the sea ice to melt, methane is released. When methane is released it intensifies global warming, resulting in more ice melting. In turn, more methane is released causing an acceleration in global warming… and so on.

Another example was sited in a report by NASA:
Greenland’s snowy surface has been getting darker over the past two decades, absorbing more heat from the sun and increasing snow melt. The feedback loops work like this: During a warm summer with clear skies and lots of solar radiation pouring in, the surface starts to melt. As the top layers of fresh snow disappear, old impurities, like dust from erosion or soot that blew in years before, begin to appear, darkening the surface. A warm summer can remove enough snow to allow several years of impurities to concentrate at the surface as surrounding snow layers disappear. At the same time, as the snow melts and refreezes, the grains of snow get larger. This is because the meltwater acts like glue, sticking grains together when the surface refreezes. The larger grains create a less reflective surface that allows more solar radiation to be absorbed.

A third example of feedback loops can be witnessed as a result of ethanol in gasoline. Ethanol in gasoline causes an increase tropospheric ozone. Tropospheric ozone is a result of a volatile reaction that occurs from vehicle emissions, a warm temperature and ultraviolet light. Tropospheric ozone causes tree death and deforestation. The decline in trees lessens the carbon dioxide sink that trees provide resulting in more global warming. More global warming results in more days when the conditions are right for the creation of tropospheric ozone.

bookmark_borderThe Fall of the Arctic King

Famous wildlife photographer, Sebastian Copeland, utilized a graphic picture to raise awareness of human induced climate change. “‘For the state of the ice in general, we’re headed into uncharted territory. There’s no doubt about it. The frozen remains of this young bear point to starvation. The faster retreat of the sea ice, a bear’s favoured spot for seal hunting, leads to longer fasting periods and the demise of more animals from starvation.”

Polar Bear Starves Due to Global Warming

More From the Human Induced Climate Change Experiment

bookmark_borderNews from the Ice Wars

The Membrane Domain has been conducting Human Induced Climate Change Experiments since 1999. One of the first scientist to hypothesize that global warming was exponential (as opposed to the linear models) requested fellow scientists to conduct studies.

One Membrane Domain scientists began a study on the decline of the ice mass. The analysis is on-going; however, recent data leads to the conclusion that the process is exponential:

The two largest ice sheets on earth, Greenland and Antarctica, are losing mass faster and faster. The figure below is from Velicogna and Wahr, “Time-variable gravity observations of ice sheet mass balance: Precision and limitations of the GRACE satellite data” GEOPHYSICAL RESEARCH LETTERS, VOL. 40, 3055-3063, doi:10.1002/grl.50527, 2013

Mass loss for Greenland and  Antarctica from 2003-2013

For reference, 360 GTonne of mass loss results in 1 mm sea level rise. Greenland lost more than that in 2012 alone.

Causes of Mass Loss

I. Marine terminated glaciers flow to the ocean and calve off icebergs. The figure below is from Rignot and Mouginot,”Ice flow in Greenland for the International Polar Year 2008-2009,” GEOPHYSICAL RESEARCH LETTERS, VOL. 39, L11501, doi:10.1029/2012GL051634, 2012

Read More on the Decline of the Ice Mass