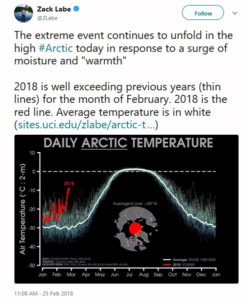
In a study published by Geert Jan van Oldenborgh, Marc Macias-Fauria, Andrew King, Peter Uhe, Sjoukje Philip, Sarah Kew, David Karoly, Friederike Otto, Myles Allen, and Heidi Cullen, the scientists found the unusually high temperatures around the North Pole in November–December 2016 were influenced by anthropogenic climate change:
The climate of the North Pole in winter is extreme, with 24 hours of darkness and very cold temperatures that vary from year to year and decade to decade. This year, the North Pole and the surrounding Arctic region are seeing record-high temperatures in November and December and record-low ice extent). Fall usually ushers in the season of sea ice growth, but November saw a brief retreat that was virtually unprecedented in nearly 40 years of satellite records, according to the National Snow and Ice Data Center. That dip helped November set a record low for sea ice area since 1850 (Walsh et al, 2016). By December, the area around the North Pole is typically 95 percent covered by sea ice. However, this year it is only about 80 percent.
Mid-November saw an early winter “heat wave” with the temperature on November 11 reaching -7 ºC (19 ºF) – that is 15 ºC (27 ºF) above normal for the time of year. The monthly mean November temperature was 13 ºC (23 ºF) above normal on the pole. Temperatures in this region declined slightly after that but remained well above normal. The forecast for the next few days is again more than 15 ºC (27 ºF) above normal at the North Pole itself and 10 ºC (18 ºF) averaged over 80–90 ºC N.
To quantify how rare the event was, we computed the November-December averaged temperature around the North Pole (80–90 ºN) in the ERA-interim reanalysis augmented with the ECMWF analysis and forecast up to December 25 and persistence up to December 31. The temperatures are slightly less extreme than at the pole itself (Fig. 2), but unprecedented in the satellite era from 1979 onwards.
We first note some of the impacts of these high temperatures in the Arctic regions. Next we describe the physical mechanisms that are responsible for sea ice and temperature variability in the North Pole region, which is warming faster than anywhere else in the world. We then analyse the observed temperatures via a related time series encompassing the northern-most meteorological observations on land (70–80 ºN). This allows for a reconstruction of Arctic temperatures back to about 1900, which clearly shows how the current warmth is unprecedented over that period. It also gives a rough estimate of how rare it is in the current climate and how much the probability has changed over the last century.
Finally, we perform a multi-method analysis of North Pole temperatures with two sets of climate models: the CMIP5 multi-model ensemble that was used for the 2013 IPCC AR5 report, and a large ensemble of model runs in the Weather@Home project. Both sets of models give very comparable results, showing that the bulk of the increase is due to anthropogenic emissions. The results are combined in the synthesis and conclusions.
Impacts
Extreme warm events in the Arctic extend into biological and social implications. Unlike the Antarctic, Arctic lands are inhabited and their socio-economic systems are greatly affected by the impacts of extreme and unprecedented sea ice dynamics and temperatures. Recent work by Henri Huntington and colleagues reported on these effects on the timing of marine mammal migrations, their distribution and behaviour and the efficacy of certain hunting methods in the Beaufort Sea. Less than a month ago, Forbes and colleagues reported on the relationship between unseasonal sea ice decline in winter and the enhanced probability of rain-on-snow events in the Yamal Peninsula in north-Western Siberia. While rain on snow does not cause problems in spring, it can be catastrophic for reindeer in the autumn when rain turns to an ice crust as plummeting normal temperatures return. This crust, often several centimetres thick, prevents the reindeer from feeding on fodder beneath the snow throughout the winter months. Two extreme weather events in 2006 and 2013 caused mass starvation among the reindeer herds (one event alone in 2013 resulted in 61,000 reindeer deaths, about 22 percent out of 275,000 reindeer on the Yamal Peninsula), and were linked with sea ice loss in the adjoining Barents and Kara seas. These two examples only illustrate the variety of ways in which climate change in the Arctic directly affects its ecosystems and societies. Many others include effects on the timing of phytoplankton blooms (which are at the base of the food chain in the Arctic ocean) and terrestrial plants, their consequences for animals that depend on these resources, opportunities for invasive southern species to colonise the region, enhanced mobility around the Arctic region for marine mammals such as whales, or reduced and largely modified habitat for animals that directly depend on sea ice such as the polar bear.
Some background
The Arctic is the fastest-warming region on Earth, with the largest temperature increases in winter. In summer, the temperature is constrained by all the ice melting and it never rises very far above zero. However, the extra heat absorbed in summer is released in autumn and winter as the water remains warmer for longer and re-freezing sea ice releases the latent energy of melting.
This “Arctic amplification” of the global warming trend has several causes (see e.g., IPCC WG1 AR5 Box 5.1, Screen & Simmonds, 2010; Bintanja et al, 2011). The best-known is the extra warming due to the change in color (albedo-feedback): when white snow and ice is replaced by dark land and ocean, a much larger fraction of the incoming sunshine is absorbed instead of reflected. This extra heat warms the surface even more. Another positive feedback is less well known and is based on the observation that the warming trend in the Arctic is mainly confined to the lower part of the atmosphere. This is still far below the levels where thermal radiation escapes from the atmosphere on average, which is around 5 km (3 miles) high. This implies that the radiative cooling of the warmer air near the surface is not as efficient as in lower latitudes where the trend at altitude is similar to (mid-latitudes) or higher than (tropics) near the surface. The reduction of radiative cooling due to the vertical structure of the warming trend is called the lapse-rate feedback.
Variability has also increased in the Arctic. On top of the positive feedbacks mentioned above, this is due to two other factors. First, the shape of the Arctic Ocean. Before global warming began in earnest, the basin was filled with ice for most of the year, which implies that except for a few summer months the edge of the ice was relatively short and confined to the Atlantic sector. Now, there are more months in which the ice edge is free of the continents. This allows larger changes from year to year (van der Linden et al, 2014). Another factor is the thickness of the ice. The ice has thinned dramatically, with most of it now single-year ice that is much thinner, and hence flows and melts more quickly (Tschudi et al, 2016). This type of ice changes much more quickly at the whim of the ever-capricious weather, especially combined with the waves and swell that now develop in the ice-free regions (Thomson and Rogers, 2014).
Finally, warm episodes near the pole are usually due to so-called “moist intrusions”: warm and moist air from the mid-latitudes that not only advects heat, but also clouds that block outgoing long-wave radiation and hence trap more heat. There is some evidence that these have become more frequent (Woods and Caballero, 2016).
Discussion and conclusions
We have investigated the rarity of the November-December 2016 average temperature around the North Pole and assessed how much November-December average temperatures have changed over the past century using observations over a wider region. We also attempted to quantify how much high Arctic temperatures have changed due to anthropogenic emissions (greenhouse gases and aerosols) in two climate model ensembles.
The observations and the bias-corrected CMIP5 ensemble point to a return period of about 50 to 200 years in the present climate, i.e., the probability of such an extreme is about 0.5 percent to two percent every year, with a large uncertainty. This is rare, but it should be kept in mind that we are focusing on this particular November–December period precisely because an unusual event has occurred. For a random two-month period it would be between six and 12 times more likely. The prescribed SST design of the HadAM3P simulations precludes estimating an absolute return period.
The observations show that November–December temperatures have risen on the North Pole, modulated by decadal North Atlantic variability. For all phases of this variability a warm event like the one of this year would have been extremely unlikely in the climate of a century ago. The probability was so small it is hard to estimate, but less than 0.1 percent per year. The model analyses show that the event would also have been extremely unlikely in a world without anthropogenic emissions of greenhouse gases and aerosols, attributing the cause of the change to human influences. This also holds for the warm extremes caused by the type of circulation of November 2016. If nothing is done to slow climate change, by the time global warming reaches 2 ºC (3.6 ºF) events like this winter would become common at the North Pole, happening every few years.