bookmark_borderClimate Denial and Climate Change Change

The North Pole saw record high temperatures for February during 2018.
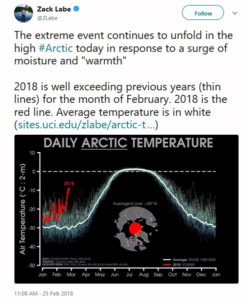
Record Temperature at North Pole

Reuters reported:
Temperatures may have soared as high as 35 degrees Fahrenheit (2 degrees Celsius) at the pole, according to the U.S. Global Forecast System model. While there are no direct measurements of temperature there, Zack Labe, a climate scientist working on his PhD at the University of California at Irvine, confirmed that several independent analyses showed “it was very close to freezing,” which is more than 50 degrees (30 degrees Celsius) above normal.

The warm intrusion penetrated right through the heart of the Central Arctic, Labe said. The temperature averaged for the entire region north of 80 degrees latitude spiked to its highest level ever recorded in February. The average temperature was more than 36 degrees (20 degrees Celsius) above normal. “No other warm intrusions were very close to this,” Labe said in an interview, describing a data set maintained by the Danish Meteorological Institute that dates back to 1958. “I was taken by surprise how expansive this warm intrusion was.”

Climate scientist Sidd Mukherjee added, “Yes. Even more scarily — the fast ice north of Greenland is gone. That was some of the oldest ice left. It hasn’t melted, just been blown away and drifted away with the currents.” (see “Talk about unprecedented“)

An article in Rolling Stone about climate migrations quotes Solomon Hsiang:
Hsiang has many good papers outAn article in Rolling Stone about climate migrations quotes Solomon Hsiang:
“Most people don’t realize how much climate affects everything, from their property values to how hard people work,” says Solomon Hsiang, a professor of public policy at the University of California, Berkeley, who led a recent study that predicts, as the climate warms, there will be “a large transfer of value northward and westward.” And the wealthy, who can afford to adapt, will benefit, while the poor, who will likely be left behind, will suffer. “If we continue on the current path,” Hsiang says, “our analysis suggests that climate change may result in the largest transfer of wealth from the poor to the rich in the country’s history.”

Dr. Mukherjee replied, “But for city officials in at-risk cities, homeowners like Brown are terrifying. “Once people start thinking about the long-term value of their homes and how they will be impacted by climate change, that changes the game completely,” a county attorney in Florida says. What happens to the value of a house in, for instance, Fort Lauderdale, when the cost of flood insurance triples? “When I think about the future of South Florida, it’s flood insurance that scares me the most,” Wayne Pathman, a prominent Miami lawyer and board member of Miami Beach’s chamber of commerce, tells me. Many officials fear a climate-driven exodus that pushes down property values, which in turn reduces property-tax revenues, which are central to funding city services like police and teachers, not to mention road repair and infrastructure maintenance, at precisely the moment when the city needs to spend more to adapt to climate change.

Flooding in downtown Miami after Hurricane Irma in September 2017. Kadir van Lohuizen/NOOR/Redux

It’s a downward spiral for real estate that’s very hard to reverse. “It’s just like the dynamic in the stock market,” says U.C. Berkeley’s Hsiang. “The longer you hold on, the more you have to lose.” And, in many cases, the regions of the country where climate-change denial is strongest, such as the Southeast, are exactly the regions where residents have the most to lose. “In many places, climate denial is going to turn out to have big economic consequences,” Hsiang says.
[Hsiang has many good papers out]

WARNING: Do not buy real estate on or near floodplain.

From The Human Induced Climate Change Experiment

bookmark_borderGreenland Is Melting

NASA — Greenland’s snowy surface has been getting darker over the past two decades, absorbing more heat from the sun and increasing snow melt, a new study of satellite data shows. That trend is likely to continue, with the surface’s reflectivity, or albedo, decreasing by as much as 10 percent by the end of the century, the study says.

Greenland's Darkening Ice
Greenland’s Darkening Ice

The Columbia study says:
Greenland’s snowy surface has been getting darker over the past two decades, absorbing more heat from the sun and increasing snow melt, a new study of satellite data shows. That trend is likely to continue, with the surface’s reflectivity, or albedo, decreasing by as much as 10 percent by the end of the century, the study says.

While soot blowing in from wildfires contributes to the problem, it hasn’t been driving the change, the study finds. The real culprits are two feedback loops created by the melting itself. One of those processes isn’t visible to the human eye, but it is having a profound effect.

The results, published in the European Geosciences Union journal The Cryosphere, have global implications. Fresh meltwater pouring into the ocean from Greenland raises sea level and could affect ocean ecology and circulation.

“You don’t necessarily have to have a ‘dirtier’ snowpack to make it dark,” said lead author Marco Tedesco, a research professor at Columbia University’s Lamont-Doherty Earth Observatory and adjunct scientist at NASA Goddard Institute of Space Studies. “A snowpack that might look ‘clean’ to our eyes can be more effective in absorbing solar radiation than a dirty one. Overall, what matters, it is the total amount of solar energy that the surface absorbs. This is the real driver of melting.”

The feedback loops work like this: During a warm summer with clear skies and lots of solar radiation pouring in, the surface starts to melt. As the top layers of fresh snow disappear, old impurities, like dust from erosion or soot that blew in years before, begin to appear, darkening the surface. A warm summer can remove enough snow to allow several years of impurities to concentrate at the surface as surrounding snow layers disappear. At the same time, as the snow melts and refreezes, the grains of snow get larger. This is because the meltwater acts like glue, sticking grains together when the surface refreezes. The larger grains create a less reflective surface that allows more solar radiation to be absorbed. The impact of grain size on albedo – the ratio between reflected and incoming solar radiation – is strong in the infrared range, where humans can’t see, but satellite instruments can detect the change.

“It’s a complex system of interaction between the atmosphere and the ice sheet surface. Rising temperatures are promoting more melting, and that melting is reducing albedo, which in turn is increasing melting,” Tedesco said. “How this accumulates over decades is going to be important, because it can accelerate the amount of water Greenland loses. Even if we don’t have a lot of melting because of atmospheric conditions one year, the surface is more sensitive to any kind of input the sun can give it, because of the previous cycle.”

bookmark_borderGlacier Breakup

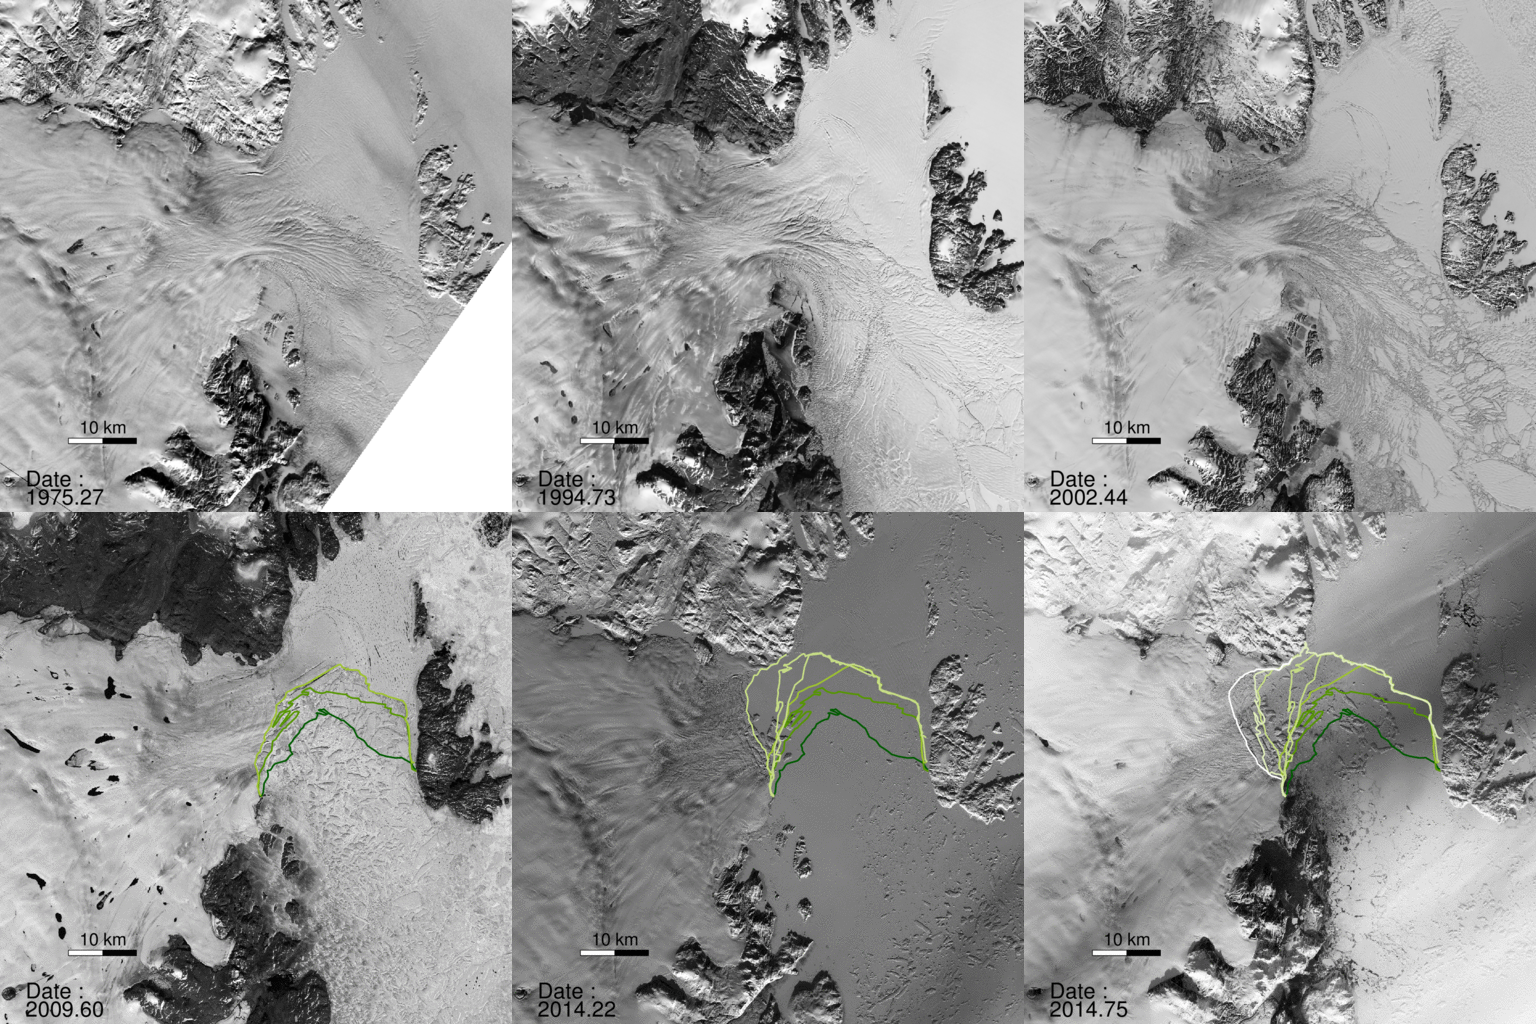
Glacier Breakup Animation
A NASA study published in the journal Science found a glacier in Greenland broke apart. “The consequences will be felt for decades to come.”

“North Greenland glaciers are changing rapidly,” said lead author Jeremie Mouginot, an assistant researcher in the Department of Earth System Science at the University of California, Irvine. “The shape and dynamics of Zachariae Isstrom have changed dramatically over the last few years. The glacier is now breaking up and calving high volumes of icebergs into the ocean, which will result in rising sea levels for decades to come.”

The scientists determined the bottom of Zachariae Isstrom is being rapidly eroded by warmer ocean water mixed with growing amounts of meltwater from the ice sheet surface. “Ocean warming has likely played a major role in triggering [the glacier’s] retreat,” Mouginot said, “but we need more oceanographic observations in this critical sector of Greenland to determine its future.”

“Zachariae Isstrom is being hit from above and below,” said the study’s senior author Eric Rignot, Chancellor’s Professor of Earth system science at UCI, and Joint Faculty Appointee at JPL. “The top of the glacier is melting away as a result of decades of steadily increasing air temperatures, while its underside is compromised by currents carrying warmer ocean water, and the glacier is now breaking away into bits and pieces and retreating into deeper ground.”

“Not long ago, we wondered about the effect on sea levels if Earth’s major glaciers in the polar regions were to start retreating,” Rignot noted. “We no longer need to wonder; for a couple of decades now, we’ve been able to directly observe the results of climate warming on polar glaciers. The changes are staggering and are now affecting the four corners of Greenland.”

bookmark_borderDisappearing Ice Sheets, Glaciers and Arctic Sea Ice

The U.N.’s panel on global warming warns:

Over the last two decades, the Greenland and Antarctic ice sheets have been losing mass, glaciers have continued to shrink almost worldwide, and Arctic sea ice and Northern Hemisphere spring snow cover have continued to decrease in extent (high confidence).

• The average rate of ice loss 8 from glaciers around the world, excluding glaciers on the periphery of the ice sheets 9, was very likely 226 [91 to 361] Gt yr−1 over the period 1971−2009, and very likely 275 [140 to 410] Gt yr −1 over the period 1993−2009 10. {4.3}
• The average rate of ice loss from the Greenland ice sheet has very likely substantially increased from 34 [–6 to 74] Gt yr –1 over the period 1992–2001 to 215 [157 to 274] Gt yr –1 over the period 2002–2011. {4.4}
• The average rate of ice loss from the Antarctic ice sheet has likely increased from 30 [–37 to 97] Gt yr –1 over the period 1992–2001 to 147 [72 to 221] Gt yr –1 over the period 2002–2011. There is very high confidence that these losses are mainly from the northern Antarctic Peninsula and the Amundsen Sea sector of West Antarctica.
• The annual mean Arctic sea ice extent decreased over the period 1979–2012 with a rate that was very likely in the range 3.5 to 4.1% per decade (range of 0.45 to 0.51 million km 2 per decade), and very likely in the range 9.4 to 13.6% per decade (range of 0.73 to 1.07 million km 2 per decade) for the summer sea ice minimum (perennial sea ice). The average decrease in decadal mean extent of Arctic sea ice has been most rapid in summer (high confidence); the spatial extent has decreased in every season, and in every successive decade since 1979 (high confidence). There is medium confidence from reconstructions that over the past three decades, Arctic summer sea ice retreat was unprecedented and sea surface  temperatures were anomalously high in at least the last 1,450 years. {4.2, 5.5}
• It is very likely that the annual mean Antarctic sea ice extent increased at a rate in the range of 1.2 to 1.8% per decade (range of 0.13 to 0.20 million km 2 per decade) between 1979 and 2012. There is high confidence that there are strong regional differences in this annual rate, with extent increasing in some regions and decreasing in others. {4.2}
• There is very high confidence that the extent of Northern Hemisphere snow cover has decreased since the mid-20th century (see Figure SPM.3). Northern Hemisphere snow cover extent decreased 1.6 [0.8 to 2.4] % per decade for March and April, and 11.7 [8.8 to 14.6] % per decade for June, over the 1967–2012 period. During this period, snow cover extent in the Northern Hemisphere did not show a statistically significant increase in any month. {4.5}
• There is high confidence that permafrost temperatures have increased in most regions since the early 1980s. Observed warming was up to 3°C in parts of Northern Alaska (early 1980s to mid-2000s) and up to 2°C in parts of the Russian European North (1971–2010). In the latter region, a considerable reduction in permafrost thickness and areal extent has been observed over the period 1975–2005 (medium  confidence). {4.7}
• Multiple lines of evidence support very substantial Arctic warming since the mid-20th century. {Box 5.1, 10.3}