bookmark_borderGlaciers Are Vanishing

Around the world glaciers are melting at an alarming rate. The World Glacier Monitoring Service publishes a survey of the mass changes from glaciers.

In their latest survey, the found “The average mass balance of the glaciers with available long-term observation series around the world continues to be negative, with tentative figures indicating a further thickness reduction of 1.1 meters water equivalent (m w.e.) during the hydrological year 2015.”

Melting Glaciers
Melting Glaciers

More About “Human Induced Climate Change”

bookmark_borderGlacier Breakup

Glacier Breakup Animation
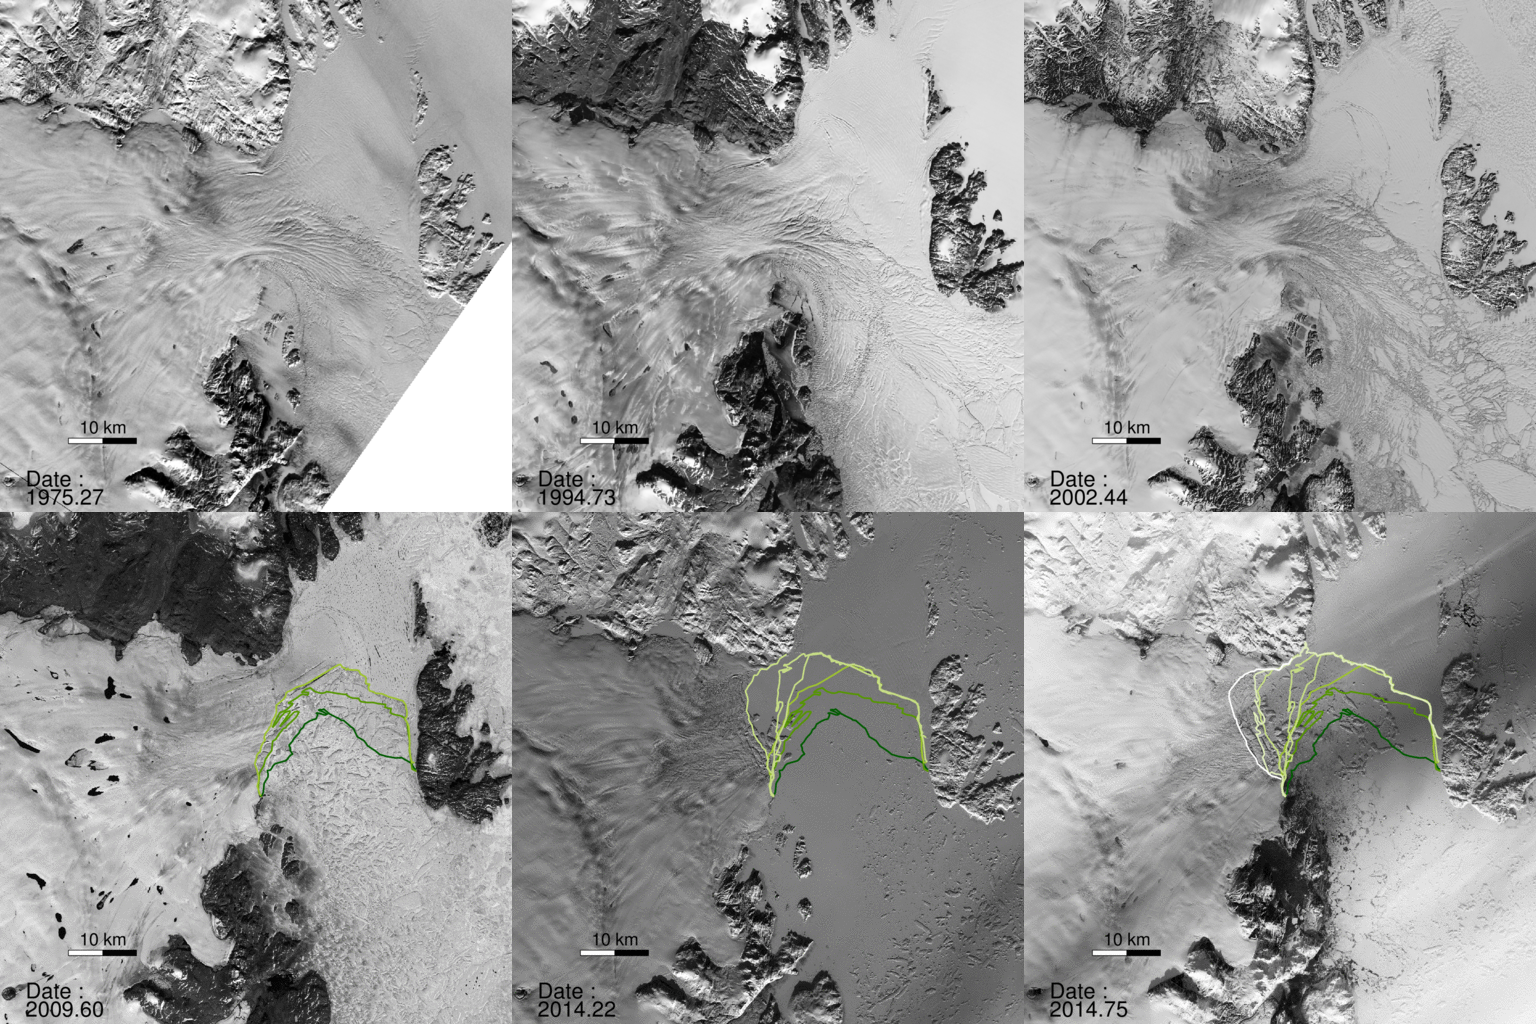
A NASA study published in the journal Science found a glacier in Greenland broke apart. “The consequences will be felt for decades to come.”

“North Greenland glaciers are changing rapidly,” said lead author Jeremie Mouginot, an assistant researcher in the Department of Earth System Science at the University of California, Irvine. “The shape and dynamics of Zachariae Isstrom have changed dramatically over the last few years. The glacier is now breaking up and calving high volumes of icebergs into the ocean, which will result in rising sea levels for decades to come.”

The scientists determined the bottom of Zachariae Isstrom is being rapidly eroded by warmer ocean water mixed with growing amounts of meltwater from the ice sheet surface. “Ocean warming has likely played a major role in triggering [the glacier’s] retreat,” Mouginot said, “but we need more oceanographic observations in this critical sector of Greenland to determine its future.”

“Zachariae Isstrom is being hit from above and below,” said the study’s senior author Eric Rignot, Chancellor’s Professor of Earth system science at UCI, and Joint Faculty Appointee at JPL. “The top of the glacier is melting away as a result of decades of steadily increasing air temperatures, while its underside is compromised by currents carrying warmer ocean water, and the glacier is now breaking away into bits and pieces and retreating into deeper ground.”

“Not long ago, we wondered about the effect on sea levels if Earth’s major glaciers in the polar regions were to start retreating,” Rignot noted. “We no longer need to wonder; for a couple of decades now, we’ve been able to directly observe the results of climate warming on polar glaciers. The changes are staggering and are now affecting the four corners of Greenland.”

bookmark_borderDisappearing Ice Sheets, Glaciers and Arctic Sea Ice

The U.N.’s panel on global warming warns:

Over the last two decades, the Greenland and Antarctic ice sheets have been losing mass, glaciers have continued to shrink almost worldwide, and Arctic sea ice and Northern Hemisphere spring snow cover have continued to decrease in extent (high confidence).

• The average rate of ice loss 8 from glaciers around the world, excluding glaciers on the periphery of the ice sheets 9, was very likely 226 [91 to 361] Gt yr−1 over the period 1971−2009, and very likely 275 [140 to 410] Gt yr −1 over the period 1993−2009 10. {4.3}
• The average rate of ice loss from the Greenland ice sheet has very likely substantially increased from 34 [–6 to 74] Gt yr –1 over the period 1992–2001 to 215 [157 to 274] Gt yr –1 over the period 2002–2011. {4.4}
• The average rate of ice loss from the Antarctic ice sheet has likely increased from 30 [–37 to 97] Gt yr –1 over the period 1992–2001 to 147 [72 to 221] Gt yr –1 over the period 2002–2011. There is very high confidence that these losses are mainly from the northern Antarctic Peninsula and the Amundsen Sea sector of West Antarctica.
• The annual mean Arctic sea ice extent decreased over the period 1979–2012 with a rate that was very likely in the range 3.5 to 4.1% per decade (range of 0.45 to 0.51 million km 2 per decade), and very likely in the range 9.4 to 13.6% per decade (range of 0.73 to 1.07 million km 2 per decade) for the summer sea ice minimum (perennial sea ice). The average decrease in decadal mean extent of Arctic sea ice has been most rapid in summer (high confidence); the spatial extent has decreased in every season, and in every successive decade since 1979 (high confidence). There is medium confidence from reconstructions that over the past three decades, Arctic summer sea ice retreat was unprecedented and sea surface  temperatures were anomalously high in at least the last 1,450 years. {4.2, 5.5}
• It is very likely that the annual mean Antarctic sea ice extent increased at a rate in the range of 1.2 to 1.8% per decade (range of 0.13 to 0.20 million km 2 per decade) between 1979 and 2012. There is high confidence that there are strong regional differences in this annual rate, with extent increasing in some regions and decreasing in others. {4.2}
• There is very high confidence that the extent of Northern Hemisphere snow cover has decreased since the mid-20th century (see Figure SPM.3). Northern Hemisphere snow cover extent decreased 1.6 [0.8 to 2.4] % per decade for March and April, and 11.7 [8.8 to 14.6] % per decade for June, over the 1967–2012 period. During this period, snow cover extent in the Northern Hemisphere did not show a statistically significant increase in any month. {4.5}
• There is high confidence that permafrost temperatures have increased in most regions since the early 1980s. Observed warming was up to 3°C in parts of Northern Alaska (early 1980s to mid-2000s) and up to 2°C in parts of the Russian European North (1971–2010). In the latter region, a considerable reduction in permafrost thickness and areal extent has been observed over the period 1975–2005 (medium  confidence). {4.7}
• Multiple lines of evidence support very substantial Arctic warming since the mid-20th century. {Box 5.1, 10.3}

bookmark_borderCoastal Change: Hurricanes and Extreme Storm Hazards

Part of the Human Induced Climate Change Experiment

One of the goals of the USGS Coastal and Marine Geology Program is a national assessment of coastal change hazards. Hurricanes provide a powerful force that generates dangerous waves and currents capable of moving large amounts of sand, destroying buildings and infrastructure, and reshaping our nation’s coastline. Our research focuses on understanding the magnitude and variability of the impacts of hurricanes and extreme storms on the sandy beaches of the United States. The overall objective is to improve the capability to predict coastal change that results from severe storms. Such a capability will support management of coastal infrastructure, resources, and safety.

Hurricane Sandy Example

As Hurricane Sandy moved northward along the U.S. Atlantic coast in October 2012, U.S. Geological Survey scientists worked to determine where and how the storm’s waves and surge might dramatically reshape the beaches and dunes that stand between the storm and coastal developments. Through a complex modeling process that uses coastal elevations, wave forecasts, and potential storm surge, they predicted coastal change hazards, such as shoreline and dune erosion, that might be expected during a Sandy landfall.

Using the latest storm information available, USGS predicted the likelihood of a range of coastal change impacts within the region affected by the storm:

  • Dune erosion was very likely for the majority of the sandy beaches along the Maryland and Delaware coasts with widespread overwash also very likely in many areas.
  • Most of the New Jersey coast was very likely to experience extensive beach and dune erosion and many areas were very likely to overwash.
  • Along the south shore of Long Island, New York, the models predicted extensive beach and dune erosion as well as intermittent overwash.

Hurricane Sandy, the largest Atlantic hurricane on record, made landfall on October 30, 2012, and impacted a long swath of the Mid-Atlantic coastline. Many areas that had been hit by Hurricane Irene in August 2011 were again battered by strong waves and surge. The barrier islands were breached in a number of places and erosion of the beach and dunes occurred all along the Mid-Atlantic coast. This was the most destructive storm to impact this coastline since an extremely powerful nor’easter in December of 1992.

Following landfall, oblique aerial photography and lidar surveys of beach elevations were used to document the changes that occurred as a result of the storm. In addition, field measurements of the beaches and dunes were collected immediately after the storm. Comparisons of data collected before the storm show the nature, magnitude and spatial variability of the coastal response. These data will be used to further refine predictive models for storm-induced erosion.

Response Activities

Pre-landfall

Post-landfall (approx. 3-14 days)

bookmark_borderClimate Change Time Machine

NASA has developed a web application that allows you to view the sea ice declining, sea level, carbon emissions and average temperature rising over time: Climate Time Machine