bookmark_borderGlaciers Are Vanishing

Around the world glaciers are melting at an alarming rate. The World Glacier Monitoring Service publishes a survey of the mass changes from glaciers.

In their latest survey, the found “The average mass balance of the glaciers with available long-term observation series around the world continues to be negative, with tentative figures indicating a further thickness reduction of 1.1 meters water equivalent (m w.e.) during the hydrological year 2015.”

Melting Glaciers
Melting Glaciers

More About “Human Induced Climate Change”

bookmark_borderAntarctic Glacial Ice Melt

Australia’s ABC news reports:

Scientists hope to discover how warm water is reaching one of the world’s largest glaciers, causing it to melt rapidly.

Lead author Steve Rintoul said it was the first time scientists had been able to test the hypothesis that warm ocean waters were driving the glacier’s thinning.

“We knew the Totten has been thinning faster than other glaciers in East Antarctica, but nobody has known exactly why until we took these measurements,” he said.

“We found that warmer ocean water is reaching the cavity through this channel at temperatures capable of melting the ice shelf at the point where it meets ground.

Dr Rintoul said it was important to be able to predict the Totten glacier’s future behaviour, because it contained enough sea ice to raise global sea levels by about 3.5 metres.

“So the real importance of the research is that it helps provide some clues about how sea level might change in the future.”

The publication of the research today comes as scientists make their way back to the Totten glacier, where they hope to find more clues about what controls the amount of warm water reaching the glacier.

A team of about 30 scientists, technicians and PhD students left Hobart on December 8 and plan to arrive at the glacier in late December.

Dr. Rintoul said their goal was to learn more about the pathways that bring the warm water up from the deep ocean.

“Understanding the physical processes delivering heat to the ice shelf will help us assess the vulnerability of the East Antarctic ice sheet to future changes in the Southern Ocean,” he said.

“What we have shown is that warm water reaches the glacier. What we need to know is what’s going to happen in the future.

Dr. Tas van Ommen from the Australian Antarctic Division said it would be concerning to see an increase in the Totten glacier’s natural melt rate.

“If its natural melt rate was to increase because of changes in ocean circulation, that would then add to the sea level rise that we see from glaciers already melting in Antarctica, particularly in the West.

“So we are concerned to track that and to be able to predict what might happen in the future.”

bookmark_borderLakes Expanding Dangerously

The BBC reports that the glaciers on Mount Everest are melting so fast that they are causing large lakes. No only do the lakes make it difficult to scale the mountain, but if the ice dams break up it could cause massive flooding.

“A decade or so ago, there were individual ponds on the Khumbu glacier but in the past five years or so they have begun to get larger and join up,” said Ann Rowan, who led the field study team from the universities of Sheffield and Leeds.

“Particularly, on the left hand side of the lower reaches of the glacier, there is a series of about seven or eight large ponds that are now starting to link and form a big chain,” she told the BBC.

“There is water flowing from the upper part of the glacier through the series of these ponds and that is going to encourage them to join up.

“At present, the glacier appears to be disintegrating, and may form a few large and potentially hazardous lakes on the glacier surface.”

bookmark_borderGlacier Breakup

Glacier Breakup Animation
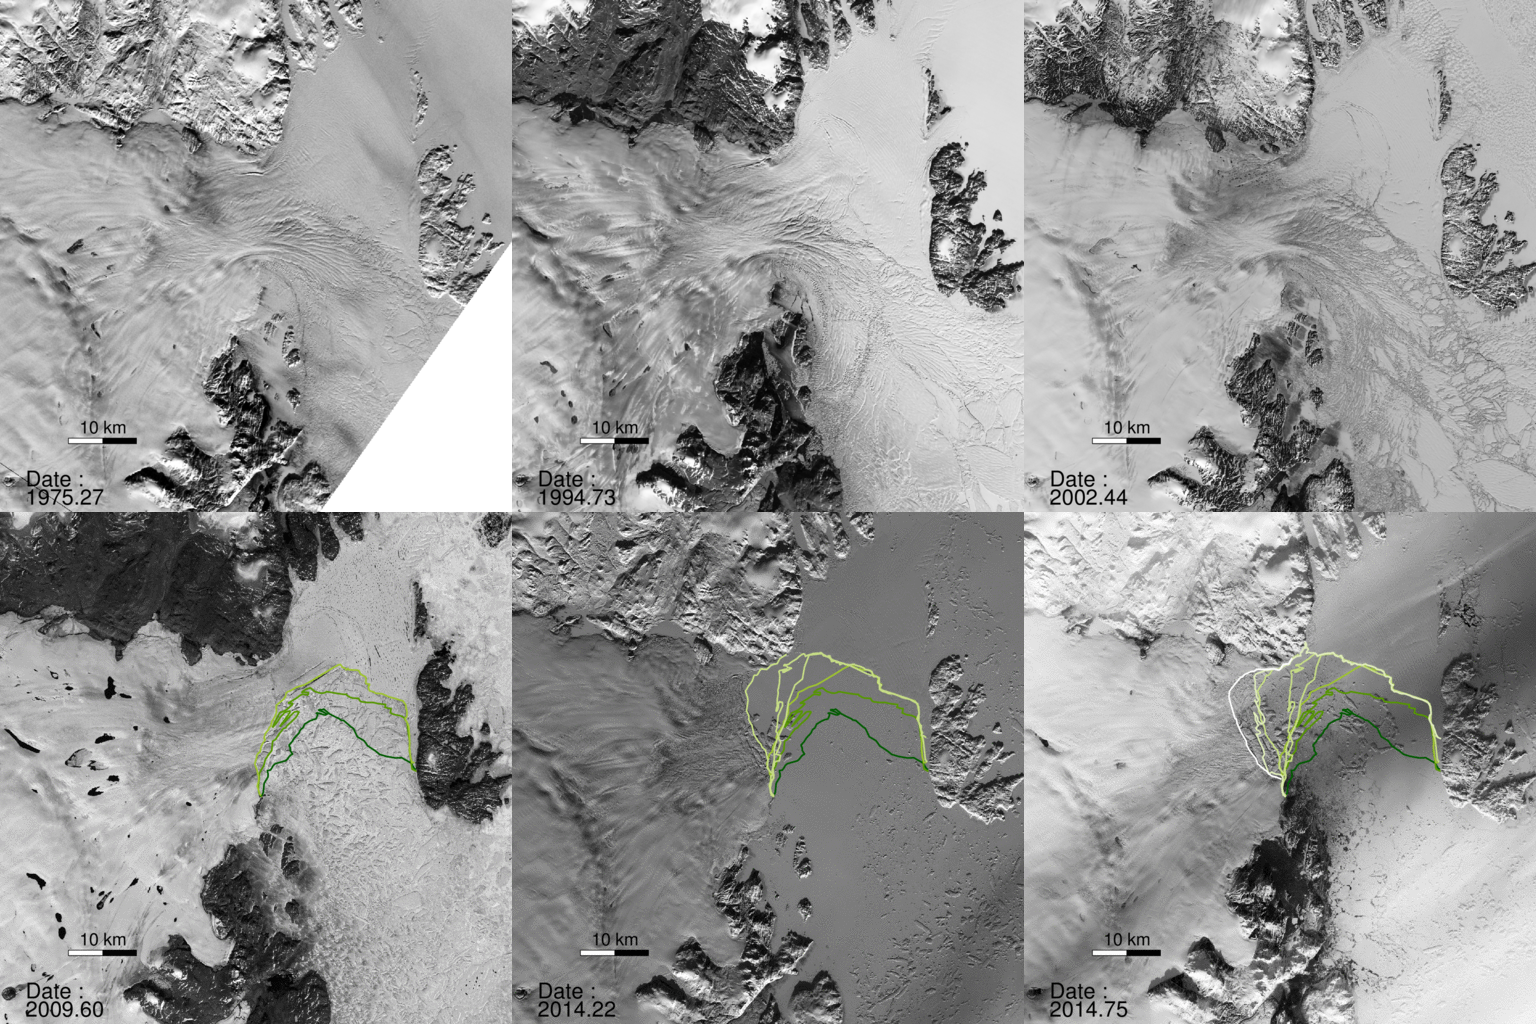
A NASA study published in the journal Science found a glacier in Greenland broke apart. “The consequences will be felt for decades to come.”

“North Greenland glaciers are changing rapidly,” said lead author Jeremie Mouginot, an assistant researcher in the Department of Earth System Science at the University of California, Irvine. “The shape and dynamics of Zachariae Isstrom have changed dramatically over the last few years. The glacier is now breaking up and calving high volumes of icebergs into the ocean, which will result in rising sea levels for decades to come.”

The scientists determined the bottom of Zachariae Isstrom is being rapidly eroded by warmer ocean water mixed with growing amounts of meltwater from the ice sheet surface. “Ocean warming has likely played a major role in triggering [the glacier’s] retreat,” Mouginot said, “but we need more oceanographic observations in this critical sector of Greenland to determine its future.”

“Zachariae Isstrom is being hit from above and below,” said the study’s senior author Eric Rignot, Chancellor’s Professor of Earth system science at UCI, and Joint Faculty Appointee at JPL. “The top of the glacier is melting away as a result of decades of steadily increasing air temperatures, while its underside is compromised by currents carrying warmer ocean water, and the glacier is now breaking away into bits and pieces and retreating into deeper ground.”

“Not long ago, we wondered about the effect on sea levels if Earth’s major glaciers in the polar regions were to start retreating,” Rignot noted. “We no longer need to wonder; for a couple of decades now, we’ve been able to directly observe the results of climate warming on polar glaciers. The changes are staggering and are now affecting the four corners of Greenland.”

bookmark_borderDisappearing Ice Sheets, Glaciers and Arctic Sea Ice

The U.N.’s panel on global warming warns:

Over the last two decades, the Greenland and Antarctic ice sheets have been losing mass, glaciers have continued to shrink almost worldwide, and Arctic sea ice and Northern Hemisphere spring snow cover have continued to decrease in extent (high confidence).

• The average rate of ice loss 8 from glaciers around the world, excluding glaciers on the periphery of the ice sheets 9, was very likely 226 [91 to 361] Gt yr−1 over the period 1971−2009, and very likely 275 [140 to 410] Gt yr −1 over the period 1993−2009 10. {4.3}
• The average rate of ice loss from the Greenland ice sheet has very likely substantially increased from 34 [–6 to 74] Gt yr –1 over the period 1992–2001 to 215 [157 to 274] Gt yr –1 over the period 2002–2011. {4.4}
• The average rate of ice loss from the Antarctic ice sheet has likely increased from 30 [–37 to 97] Gt yr –1 over the period 1992–2001 to 147 [72 to 221] Gt yr –1 over the period 2002–2011. There is very high confidence that these losses are mainly from the northern Antarctic Peninsula and the Amundsen Sea sector of West Antarctica.
• The annual mean Arctic sea ice extent decreased over the period 1979–2012 with a rate that was very likely in the range 3.5 to 4.1% per decade (range of 0.45 to 0.51 million km 2 per decade), and very likely in the range 9.4 to 13.6% per decade (range of 0.73 to 1.07 million km 2 per decade) for the summer sea ice minimum (perennial sea ice). The average decrease in decadal mean extent of Arctic sea ice has been most rapid in summer (high confidence); the spatial extent has decreased in every season, and in every successive decade since 1979 (high confidence). There is medium confidence from reconstructions that over the past three decades, Arctic summer sea ice retreat was unprecedented and sea surface  temperatures were anomalously high in at least the last 1,450 years. {4.2, 5.5}
• It is very likely that the annual mean Antarctic sea ice extent increased at a rate in the range of 1.2 to 1.8% per decade (range of 0.13 to 0.20 million km 2 per decade) between 1979 and 2012. There is high confidence that there are strong regional differences in this annual rate, with extent increasing in some regions and decreasing in others. {4.2}
• There is very high confidence that the extent of Northern Hemisphere snow cover has decreased since the mid-20th century (see Figure SPM.3). Northern Hemisphere snow cover extent decreased 1.6 [0.8 to 2.4] % per decade for March and April, and 11.7 [8.8 to 14.6] % per decade for June, over the 1967–2012 period. During this period, snow cover extent in the Northern Hemisphere did not show a statistically significant increase in any month. {4.5}
• There is high confidence that permafrost temperatures have increased in most regions since the early 1980s. Observed warming was up to 3°C in parts of Northern Alaska (early 1980s to mid-2000s) and up to 2°C in parts of the Russian European North (1971–2010). In the latter region, a considerable reduction in permafrost thickness and areal extent has been observed over the period 1975–2005 (medium  confidence). {4.7}
• Multiple lines of evidence support very substantial Arctic warming since the mid-20th century. {Box 5.1, 10.3}