bookmark_borderWARNING! Hold Your Breath / Air Quality Alert

By Daniel Brouse

Many days in the Philadelphia region are not healthy for breathing. On “Ozone Action Alert Days” you are advised to avoid outside activities. Children should not play outdoors. Avoid running and other fitness activities. Do not breathe in unconditioned air. Low level ozone is volatile and causes micro-explosions in your lungs that result in chronic respiratory and immune system damage. The more and harder you breathe, the more damage you cause to your body. Avoid exercise.

Pollution is the leading cause of death and illness. Low level (tropospheric) ozone is a major contributor to air pollution diseases.

Also see: “Why Fresh Air + Sunshine = Dangerous”

View the current air quality for Philadelphia.

The Philadelphia Region started the season with three Action Alert days in a row.

June 13, 2017

Dangerous Air Quality / June 13, 2017

June 12, 2017

Unhealthy Air Quality June 12, 2017

June 11, 2017

Unhealthy Air Quality June 11, 2017

NOTE: Graphics are from the EPA (Environmental Protection Agency of the United States of America)

Death By Ozone | The Ozone Know Zone

Ozone is not only killing humans, it is also killing the trees. The chain reaction is known as an adverse feedback loop.

Dying Trees, The Membrane Domain

  1. Tree Death Questions
  2. The Earth’s Status
  3. Answers About Ozone and Dying Trees
  4. Ozone Questions Part 4
  5. Ozone Answers Part 5

bookmark_borderClimate Change Breaks Multiple Records with Global Impacts

The World Meteorological Organization (WHO) issued a report that states records for 2016:

  • a record global temperature
  • exceptionally low sea ice
  • unabated sea level rise
  • ocean heat

Extreme weather and climate conditions have continued into 2017.

“This report confirms that the year 2016 was the warmest on record – a remarkable 1.1 °C above the pre-industrial period, which is 0.06 °C above the previous record set in 2015. This increase in global temperature is consistent with other changes occurring in the climate system,” said WMO Secretary-General Petteri Taalas.

“Globally averaged sea surface temperatures were also the warmest on record, global sea levels continued to rise, and Arctic sea-ice extent was well below average for most of the year,” he said.

“With levels of carbon dioxide in the atmosphere consistently breaking new records, the influence of human activities on the climate system has become more and more evident,” said Mr Taalas.

The report goes on to say: Global sea levels rose very strongly during the El Niño event, with the early 2016 values reaching new record highs. Global sea ice extent dropped more than 4 million square kilometres below average in November, an unprecedented anomaly for that month.

The very warm ocean temperatures contributed to significant coral bleaching and mortality was reported in many tropical waters, with important impacts on marine food chains, ecosystems and fisheries.

Carbon dioxide levels in the atmosphere reached the symbolic benchmark of 400 parts per millions in 2015 – the latest year for which WMO global figures are available – and will not fall below that level for many generations to come because of the long-lasting nature of CO2.

Noteworthy extreme events in 2016 included severe droughts that brought food insecurity to millions in southern and eastern Africa and Central America. Hurricane Matthew caused widespread suffering in Haiti as the first category 4 storm to make landfall since 1963, and inflicted significant economic losses in the United States of America, while heavy rains and floods affected eastern and southern Asia.

The extreme weather continues in 2017.
In addition to the report on 2016, the WHO issued a supplement for 2017:
“Even without a strong El Niño in 2017, we are seeing other remarkable changes across the planet that are challenging the limits of our understanding of the climate system. We are now in truly uncharted territory,” said World Climate Research Programme Director David Carlson.

At least three times so far this winter, the Arctic has witnessed the Polar equivalent of a heatwave, with powerful Atlantic storms driving an influx of warm, moist air. This meant that at the height of the Arctic winter and the sea ice refreezing period, there were days which were actually close to melting point. Antarctic sea ice has also been at a record low, in contrast to the trend in recent years.

Scientific research indicates that changes in the Arctic and melting sea ice is leading to a shift in wider oceanic and atmospheric circulation patterns. This is affecting weather in other parts of the world because of waves in the jet stream – the fast moving band of air which helps regulate temperatures.

Thus, some areas, including Canada and much of the USA, were unusually balmy, whilst others, including parts of the Arabian peninsula and North Africa, were unusually cold in early 2017.

In the USA alone, 11,743 warm temperature records were broken or tied in February, according to the US National Oceanic and Atmospheric Administration. Prolonged and extreme heat in January and February affected New South Wales, southern Queensland, South Australia and northern Victoria, and saw many new temperature records.

Highlights of the 2016 Statement

Global Temperatures:

2016’s warmth extended almost worldwide. Temperatures were above the 1961-90 average over the vast majority of the world’s land areas, the only significant exceptions being an area of South America centred on central Argentina, and parts of south-western Australia.

Mean annual temperatures at least 3 °C above the 1961-1990 average occurred in various high-latitude locations, particularly along the Russian coast and in Alaska and far north-western Canada, and on islands in the Barents and Norwegian Seas. In the high Arctic, Svalbard (Norway) Airport’s 2016 mean annual temperature of −0.1 °C was 6.5 °C above the 1961-1990 average, and 1.6 °C above the previous record.

Outside the Arctic, 2016’s warmth was more notable for its consistency across the globe than for its extreme nature in individual locations.

Oceans

Globally averaged sea surface temperatures in 2016 were the warmest on record. The anomalies were strongest in the early months of 2016.

Global ocean heat content was the second-highest on record after 2015. It reached new record highs in the northern hemisphere, but was cooler in the southern hemisphere.

Globally, sea level has risen by 20 cm since the start of the twentieth century, mostly due to thermal expansion of the oceans and melting of glaciers and ice caps. Global sea levels rose very strongly during the 2015/2016 El Niño, rising about 15 millimetres between November 2014 to a new record high in February 2016. This was well above the post-1993 trend of 3 to 3.5 mm per year. From February to August, sea levels remained fairly stable as the influence of the El Niño declined. Final 2016 sea level data are not yet available at the time of writing.

Arctic sea ice

The seasonal maximum, of 14.52 million square kilometres on 24 March, was the lowest in the 1979-2016 satellite record. The 2016 autumn freeze-up was exceptionally slow – with sea ice extent even contracting for a few days in mid-November.

Precipitation

Much of southern Africa began the year in severe drought. For the second year in succession, rainfall was widely 20 to 60% below average for the summer rainy season (October to April) in 2015/2016. The World Food Programme estimating that 18.2 million people would require emergency assistance by early 2017.

Provisional figures showed 2016 was the driest on record over the Amazon Basin, and there was also significant drought in north-east Brazil.  El Niño brought drought conditions elsewhere in Central America and northern South America.

The Yangtze basin in China experienced, overall, its most significant flood season since 1999, with some tributaries experiencing record flood levels. Averaged over China as a whole, it was the wettest year on record, with national mean rainfall of 730 mm being 16% above the long-term average.

Heatwaves

The year started with an extreme heatwave in southern Africa in the first week of January. On 7 January, it reached 42.7 °C at Pretoria and 38.9 °C at Johannesburg, both of which were 3 °C or more above the all-time records at those sites.

Extreme heat also affected South and South-East Asia in April and May, prior to the start of the summer monsoon. South-East Asia was badly affected in April. A national record of 44.6 °C was set at Mae Hong Son, Thailand, on 28 April, and 51.0 °C was observed on 19 May at Phalodi, the highest temperature on record for India.

Record or near-record temperatures occurred in parts of the Middle East and north Africa. The highest temperature observed was 54.0 °C at Mitribah (Kuwait) on 21 July which (subject to ratification) will be the highest temperature on record for Asia. Other extremely high temperatures included 53.9 °C at Basra (Iraq) and 53.0 °C at Delhoran (Islamic Republic of Iran – a national record), both on 22 July, whilst significant high temperatures were also reported in Morocco, Tunisia, Libya and the United Arab Emirates.

A late-season heatwave affected many parts of western and central Europe in the first half of September. In southern Spain, 45.4 °C was recorded at Cordoba on 6 September.

ABOUT WMO
WMO is a specialized agency of the United Nations (UN) with 191 Member States and Territories. It is the UN system’s authoritative voice on the state and behaviour of the Earth’s atmosphere, its interaction with the land and oceans, the weather and climate it produces and the resulting distribution of water resources.

Additional References
Guide To Climate Change
The Human Induced Climate Change Experiment

bookmark_borderAtlantic City Going Under

by Daniel Brouse

Atlantic City, NJ / Sea Level Rising

For decades businesses located on the island of Atlantic City have been scenario planning for climate change and rising sea levels. At the turn of the century, the casinos devised a plan to float their businesses and ferry gamblers in. Now, the rising waters are no longer a scenario.

So-called “nuisance flooding” — which causes public inconveniences such as frequent road closures, overwhelmed storm drains, and compromised infrastructure — has increased on all three U.S. coasts, between 300 and 925 percent since the 1960s, according to a 2014 NOAA report

“As relative sea level increases, it no longer takes a strong storm or a hurricane to cause flooding,” said William Sweet, Ph.D., oceanographer at NOAA’s Center for Operational Oceanographic Products and Services (CO-OPS) and the report’s lead author. “Flooding now occurs with high tides in many locations due to climate-related sea level rise, land subsidence and the loss of natural barriers. The effects of rising sea levels along most of the continental U.S. coastline are only going to become more noticeable and much more severe in the coming decades, probably more so than any other climate-change related factor.”

Atlantic City, N.J. ranked third in the top ten U.S. areas that experience nuisance flooding with a 682% surge since 1957.

“It started with a thunderstorm — high tide, heavy rain — and suddenly we had 6 inches of water in the entire office,” said Yellow Cab owner Paul Rosenberg. “We thought it was a freak thing and we had to submit insurance claims for drywall.” But, it keeps happening.

“It’s these smaller events where the accumulated toll begins chipping away at infrastructure,” says William Sweet, a NOAA oceanographer who has studied nuisance flooding. “The way the public will notice the impacts of sea level rise will be through nuisance tidal flooding. What this sea level rise does is it increases everything: the mean (sea level), the height of high tides and the water levels during severe events.”

“Sandy, as devastating as it was, isn’t the greatest barometer because we have flash floods,” said Cathy Burke, who has run the Irish Pub since 1973. We can have floods at the drop of a hat. Without even realizing we’re going to have them. It’ll be raining and within seconds you’ll see flooding in the street. You don’t read about it in the paper. You don’t hear about it on the radio or television. You just have water that just comes up and if you don’t have warning and move your car, you have water in the car.”

“There is no central place that makes all the decisions, so you get one town building a pump station to push water out and another town pumping the water back to the same place,” said Rouzbeh Nazari, an environmental engineering expert at Rowan University. “It kind of feels like we’ve just given up, that we can’t do anything about it. I’m less worried about a Sandy-like event than nuisance flooding. They are losing 20 cars a month to nuisance flooding on Absecon Island. We need a regional solution but New Jersey has no specific plan to deal with it

“The Native Americans were a lot smarter than the European settlers,” said James Whalen, a former Atlantic City mayor and now state senator. “The barrier islands up and down the coast really should not have been built on, but here we are.”

A spokesman for Chris Christie said: “I don’t know what you want me to do, you want me to go down there with a mop?”

Sources: NOAA, The Guardian, The Press of Atlantic City

Climate Change

Rising Sea Level

Flood Insurance

Extreme Weather Events

bookmark_borderAir Pollution: Getting All Choked Up

By Daniel Brouse

Air pollution may be the largest problem facing the world. Emissions of CO2, methane and other greenhouse gases are causing irreversible climate change. Since the effects of global warming take years to become apparent, many people don’t even notice the change; however, air pollution is already the leading cause of death worldwide. Again, since the pollution can’t be seen with the naked eye, many people are in denial of the dire consequences. 92% of the world’s population lives where outdoor air quality fails to meet the World Health Organization (WHO) guidelines.

In March of 2017, Dr. Margaret Chan, director general of the World Health Organization, said air pollution is “one of the most pernicious threats” facing global public health today and is on a much bigger scale than HIV or Ebola. Dr. Chan attributed the deaths of 600,000 children per year to indoor and outdoor air pollution.

UNICEF Executive Director Anthony Lake said, “Pollutants don’t only harm children’s developing lungs, they can actually cross the blood-brain barrier and permanently damage their developing brains, and, thus, their futures. No society can afford to ignore air pollution.”

“Protecting children from air pollution is not only in their best interests; it is also in the best interests of their societies — a benefit realized in reduced health costs, in increased productivity, in a cleaner, safer environment, and thus, in more sustainable development,” Lake said.

It is estimated that 5-7 million people are dying prematurely every year as a result of air pollution.

The American Lung Association says, “Two types of air pollution dominate in the U.S.: ozone and particle pollution. These two pollutants threaten the health and the lives of millions of Americans. Thanks to the Clean Air Act, the U.S. has far less of both pollutants now than in the past. Ozone pollution is the most widespread pollutant in the U.S. and is also one of the most dangerous.”

Ozone Action Alert Days are a frequent occurrence throughout the United States. During an Ozone Alert, you should not breath outside. During any days near metropolitan areas, you should limit outdoor physical activities as deep breathing causes more severe damage. The young and old are at greater risk at all times.

Particle pollution comes from small particles in exhaust and increase the risk of heart disease, lung cancer and asthma attacks. Particulates can interfere with the growth and work of the lungs.

The Environ Health Perspect Study states, “First and foremost, short-term exposure to particle pollution can kill. Peaks or spikes in particle pollution can last for hours to days. Deaths can occur on the very day that particle levels are high, or within one to two months afterward. Particle pollution does not just make people die a few days earlier than they might otherwise—these are deaths that would not have occurred if the air were cleaner.”

In February of 2017, the EPA released an update on air quality in the U.S.:

Today, pollution levels in many areas of the United States exceed national air quality standards for at least one of the six common pollutants:

  • Although levels of particle pollution and ground-level ozone pollution are substantially lower than in the past, levels are unhealthy in numerous areas of the country. Both pollutants are the result of emissions from diverse sources, and travel long distances and across state lines.

    An extensive body of scientific evidence shows that long- and short-term exposures to fine particle pollution, also known as fine particulate matter (PM2.5), can cause premature death and harmful effects on the cardiovascular system, including increased hospital admissions and emergency department visits for heart attacks and strokes. Scientific evidence also links PM to harmful respiratory effects, including asthma attacks.

    Ozone can increase the frequency of asthma attacks, cause shortness of breath, aggravate lung diseases, and cause permanent damage to lungs through long-term exposure. Elevated ozone levels are linked to increases in hospitalizations, emergency room visits and premature death.

    Both pollutants cause environmental damage, and fine particles impair visibility.

    Fine particles can be emitted directly or formed from gaseous emissions including sulfur dioxide or nitrogen oxides. Ozone, a colorless gas, is created when emissions of nitrogen oxides and volatile organic compounds react.

  • For unhealthy peak levels of sulfur dioxide and nitrogen dioxide, EPA is working with states and others on ways to determine where and how often unhealthy peaks occur. Both pollutants cause multiple adverse respiratory effects including increased asthma symptoms, and are associated with increased emergency department visits and hospital admissions for respiratory illness. Both pollutants cause environmental damage, and are byproducts of fossil fuel combustion.
  • Airborne lead pollution, a nationwide health concern before EPA phased out lead in motor vehicle gasoline under Clean Air Act authority, now meets national air quality standards except in areas near certain large lead-emitting industrial facilities. Lead is associated with neurological effects in children, such as behavioral problems, learning deficits and lowered IQ, and high blood pressure and heart disease in adults.
  • The entire nation meets the carbon monoxide air quality standards, largely because of emissions standards for new motor vehicles under the Clean Air Act.

MORE REFERENCES
Health And Air Quality
Air Pollution Deaths
Air Pollution Killing Millions
Largest Health Risk

bookmark_borderAntarctica And Rising Sea Level

by Daniel Brouse and Sidd Mukherjee

The U.N. weather agency said the Antarctic peninsula has set a heat record of 63.5° Fahrenheit (17.5 degrees Celsius) on March 24, 2015. In March of 2017, there is about 10% less sea ice in Antarctica than the previous record minimum. “One would probably say that the old record was obliterated,” said Jan Lieser, a sea ice scientist at the Hobart-based Antarctic Climate and Ecosystems Co-operative Research Centre.

Antarctica contains 90% of the world’s fresh water as ice. If all the ice melts, sea levels will rise by 60 meters (200 feet). The sea ice melting doesn’t raise the sea level as the ice is already floating. The ice that is above land is a different story.

The problem with the ice in Antarctica is that much of the ice is on land. As the land ice melts or falls into the ocean the sea level rises. Compounding the problem is the elevation of the land. Over the centuries the weight of the ice has caused the land to sink. As the ocean temperature warms, water is starting to seep in under the ice. The warm water under the ice sheet is accelerating the destabilization of the sheet.

“There was a physicist called John Mercer at the Byrd polar research center here at Ohio State, who was warning of WAIS collapse as early as 1968,” said Sidd Mukherjee research physicist at Ohio State University.

Then in 1978 Mercer wrote:
“One warning sign that a dangerous warming is beginning in Antarctica, will be a breakup of ice shelves in the Antarctic Peninsula just south of the recent January 0C isotherm; the ice shelf in the Prince Gustav Channel on the east side of the peninsula, and the Wordie Ice Shelf; the ice shelf in George VI Sound, and the ice shelf in Wilkins Sound on the west side. ”

Each of these shelves is in retreat or gone. Mercer was more correct than he knew. Recent work by Bassis et al. shows that ice shelves collapse shortly after the temperature of the top surface exceeds the 0C melting point through a process called hydrofracture, where water filled crevasses penetrate all the way to the bottom of the shelf. Bassis et al. also pointed out that a cliff of ice higher than 100m (300 ft) is unstable against collapse. These cliff heights are attained where the bedrock is more than 1Km below sea level, as in large parts of WAIS. When the shelves melt leaving cliffs behind which directly face the ocean they will collapse along large sections of WAIS. The more frightening estimates for WAIS deglaciation are on the order of centuries, rather than millennia, indeed decadal time scales cannot be entirely ruled out. We know from past records that sea level can rise as fast as a foot a decade and maintain that rate for five hundred years. Such rates of sea level rise will destroy most coastal cities of the world, since coastal infrastructure cannot be moved inland or protected by seawalls quickly enough.

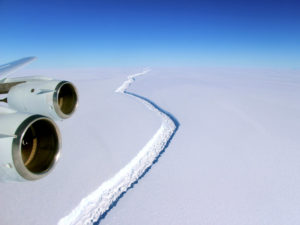
Antarctica Larsen C Ice Crack

In January of 2017, a UK research team discovered a huge increase in a massive 90-mile crack running through the Larsen C shelf (pictured to the right). The crack might soon split off a chunk of ice the size of Delaware. Larson C is part of Eastern Antarctic. Larson A and Larson B have already collapsed.

The Western Antarctic Ice Sheet (WAIS) is the segment of the continental ice sheet that covers West Antarctica. The melting of the West Antarctic ice sheet alone would raise global sea levels by more than 20 feet, according to researchers from the British Antarctic Survey. Over the last several years, WAIS has become unstable. A 2016 study by Khazendar, Rignot, and others adds to the mounting evidence that the threshold for an irreversible disintegration has begun.

“It’s generally accepted that it’s no longer a question of whether the West Antarctic Ice Sheet will melt, it’s a question of when,” said leader Ian Howat, associate professor of earth sciences at Ohio State in a 2016 study published in the journal Geophysical Research Letters. “This kind of rifting behavior provides another mechanism for rapid retreat of these glaciers, adding to the probability that we may see significant collapse of West Antarctica in our lifetimes.”

Ice calving is the breaking of ice chunks from the edge of a glacier. Calving causes mini-tsunamis daily in Antarctica.

The Thwaites Glacier is of great concern. Thwaites Glacier is an unusually broad and fast Antarctic glacier flowing into Pine Island Bay. As the warming temperature of sea water melts the bottom of the glacier, it allows water to enter underneath the ice. A University of Washington study determined that the Thwaites Glacier will gradually melt, leading to an irreversible collapse over the next 200 to 1000 years.

bookmark_borderFlood Insurance and Rising Sea Levels

by Daniel Brouse

Q: Who pays for flood insurance?
A: The United States government, FEMA, covers losses for people that pay flood insurance premiums.

Q: Does your homeowners insurance policy cover you in the event of flooding?
A: No.

Flood insurance coverage is very limited. For instance, basements and belonging in a basement are not covered. Life-time coverage is also limited. If a property has a pay-out in the past, it will be applied to the maximum coverage of the life-time coverage.

As climate change causes extreme weather events and the sea level to rise, houses that are prone to flooding will find it harder and harder to get flood insurance. Without flood insurance, properties located in a flood plain become almost impossible to sell.

For years, the casinos in Atlantic City, NJ have had a plan to float the casinos and move them westward as the sea level rises. Shipping ports face a similar problem, but how can you move a port inland? Coastal areas will need to start a constant and progressive movement to higher ground.

Freddie Mac mortgage says, “Insurance is an essential component of real estate transactions, and flood insurance currently makes it possible to obtain loans for homes in areas of identified flood risk. However, some of the varied impacts of climate change—rising sea levels, changing rainfall and flooding patterns, increasing temperatures—may not be insurable. As a result, some important features of housing finance may have to change. The potential impact of these systemic changes on the financial system is difficult to visualize today.” (More from this article.)

Flood Insurance Index
Global Warming Index

bookmark_borderBottom Of The Ocean Trashed

by Daniel Brouse

EARTH — How much of the Earth have humans polluted? Scientists sent robots to the bottom of the ocean… deeper than man has ever explored. The findings are disturbing.

“We often think deep-sea trenches are remote and pristine, untouched by humans,” says Alan Jamieson, a deep-ocean researcher at the University of Aberdeen, UK. “It’s even higher than in the estuaries of two of the most polluted rivers — the Pearl River and the Liao River — in China.”

“Crustaceans at depths of 10,000 metres contain higher concentrations of chemicals than do some animals in coastal waters.”

The small animals retrieved from the ocean’s bottom contained PCB’s (polychlorinated biphenyls used to make plastics and as anti-fouling agents to stop barnacles from growing on ships’ hulls), as well as, flame retardants (polybrominated diphenyl ethers, PBDEs).

“It’s really surprising to find pollutants so deep in the ocean at such high concentrations,” said Jeffrey Drazen, a marine ecologist at the University of Hawaii.

The findings raise concern about how microbial activities are adversely affected, the impact on the carbon cycle and climate change.

bookmark_borderThe Demise Of The USA: Will China Takeover?

By Daniel Brouse

UNITED STATES — President Trump has done more to damage the environment in his first days of office than any President in history. He has pledged to withdraw from the Paris treaty. The Paris Treaty was the most extensive agreement to address climate change and the first time China and India joined-in. Also, in the first hour of his administration all references to global warming and climate change were removed from WhiteHouse.gov. In addition, the website promoted the increased use of fossil fuels. Then on his first full day in office, Trump signed an executive order to withdraw from the The Trans-Pacific Partnership Agreement (TPP).

The TPP was a trade agreement negotiated by twelve countries: Australia, Canada, Japan, Malaysia, Mexico, Peru, United States, Vietnam, Chile, Brunei, Singapore, and New Zealand.

One of the largest benefits of the TPP would have been protecting the environment. Participating countries will need to adopt tougher pollution standards similar to the USA. “TPP includes the most robust enforceable environment commitments of any trade agreement in history,” according the United States. “TPP requires countries to play by fair environmental rules if they want to send their goods to the United States, and upgrades NAFTA by putting fully enforceable environment obligations at the core of the agreement.” In addition, TPP helps improve conditions on the ground in TPP countries by requiring them to:
* Fulfill their obligations under the Convention on International Trade in Endangered Species of Wild Fauna and Flora (CITES) to protect and conserve iconic species, such as rhinos and elephants.
* For the first time in any trade agreement, prohibit harmful fisheries subsidies, including those that contribute to overfishing, and work to restrain new subsidy programs or enhancements to existing subsidy programs.
* Combat illegal fishing, promote sustainable fisheries management practices, and protect wetlands and important natural areas.
* Promote the long-term conservation of whales, dolphins, sharks, sea turtles, and other marine species at risk.
* Combat wildlife trafficking, illegal logging, and illegal fishing through enhanced national and regional actions.
* Protect the marine environment from ship pollution, including by implementing their obligations under MARPOL (an international agreement to prevent marine pollution).

Now that the USA is pulling out, world leaders are considering China to replace the USA — a move that would backfire in Trump’s face.

bookmark_borderHottest Year

By Daniel Brouse
For The Human Induced Climate Change Experiment

2016 was Earth’s warmest year in at least the last 125,000 years. It marks the third record year in a row.

NOAA reported, “The globally averaged temperature over land and ocean surfaces for 2016 was the highest among all years since record keeping began in 1880. During the final month, the December combined global land and ocean average surface temperature was the third highest for December in the 137-year record . During 2016, the globally-averaged land surface temperature was 2.57°F (1.43°C) above the 20th century average. This was the highest among all years in the 1880–2016 record, surpassing the previous record of 2015 by 0.18°F (0.10°C).”

Experts believe that a 1.5°C to 2°C increase is a tipping point that could make global warming irreversible. The 1.43°C increase is of grave concern.

Arctic ice also reached a record low. “Recent trends in the decline of Arctic polar sea ice extent continued in 2016.” The estimated average annual sea ice extent in the Arctic was approximately 3.92 million square miles. The smallest annual average on record.

bookmark_borderLosing 10 Billion Trees Per Year

Part of the study Foliage Spoilage & the Trees’ Canopy Collapse

Thomas Crowther is a Yale Climate & Energy Institute postdoctoral fellow at the Yale School of Forestry & Environmental Studies (F&ES) and led a study and census of the world’s trees (2015). The study determined there are 3 trillion trees on Earth; however, the study also estimates we are losing 10 billion trees per year.