bookmark_borderUnderstanding Urban Heat Islands: Causes, Data, and Climate Context

by Daniel Brouse
August 7, 2025

Urban heat islands (UHIs) are a well-documented phenomenon in which cities and densely developed areas experience significantly higher temperatures than surrounding rural environments. This temperature disparity is not the result of long-term climate change, but rather of localized factors that alter how heat is absorbed, stored, and released.

The Albedo Effect and Surface Materials

At the core of the UHI effect is the albedo effect—the ability of a surface to reflect or absorb solar energy. Natural landscapes, such as forests and grassy fields, typically reflect more sunlight and also benefit from evaporative cooling due to moisture in the soil and vegetation. In contrast, urban environments are dominated by low-albedo surfaces such as asphalt, concrete, and dark rooftops, which absorb large amounts of solar radiation during the day and slowly release that heat at night.

This shift in surface composition dramatically alters local energy balances. Measuring direct solar irradiance and surface reflectivity (albedo) is essential for assessing how much thermal energy is being retained in a given environment.

Traffic and Heat Pollution from Vehicles

Another often-overlooked contributor to urban heating is thermal pollution from internal combustion engine (ICE) vehicles. Cars, trucks, and buses release significant heat as a byproduct of fuel combustion—only about 25–30% of the fuel’s energy is converted into mechanical power, while the rest is dissipated as waste heat. In areas with dense traffic and limited airflow, this heat can accumulate, compounding the effects of surface absorption.

As cities continue to struggle with traffic congestion, this vehicular heat output becomes a growing contributor to localized temperature increases, especially in poorly ventilated areas like urban canyons or below-grade roadways.

The Role of Wind in Heat Distribution

Wind patterns are equally important in shaping the urban thermal landscape. Wind speed and direction influence how heat and pollutants are dispersed or trapped. In calm or low-wind conditions, heat can become confined, especially in dense cityscapes where tall buildings disrupt natural air circulation. This can lead to pockets of intense warmth, poor air quality, and discomfort for residents.

On the other hand, steady wind flow can help moderate temperatures by promoting convective cooling and enhancing the evaporation of surface moisture. Therefore, including real-time wind data is vital for any comprehensive study of urban temperature dynamics.

Humidity and Evaporation

Humidity and evaporation play a crucial role in regulating local temperatures, especially in the context of urban heat islands (UHIs). Here’s a detailed explanation of why these processes matter—and just how powerful evaporative cooling is compared to surfaces that don’t evaporate moisture:

Why Evaporation and Humidity Matter

Evaporation is a phase-change process that absorbs large amounts of energy from the environment. When water evaporates from soil, vegetation, or water bodies, it draws heat from the surrounding air and surfaces, thereby cooling them down. This is known as latent heat flux—the energy absorbed during evaporation is stored in the water vapor as “latent heat” and removed from the surface without raising its temperature.

Humidity, or the amount of water vapor in the air, affects the potential for further evaporation. In dry environments, evaporation happens rapidly, enhancing cooling. In contrast, when humidity is high, the air is closer to saturation and evaporation slows, reducing this cooling effect.

How Much Energy Does Evaporation Use? (Compared to Non-Evaporative Surfaces)

To understand the power of evaporation, consider this key fact:

 It takes about 2,260 kJ (or 540 kcal) to evaporate 1 kilogram (1 liter) of water at 100°C.

This is five times more energy than what’s needed to heat that same amount of water from 0°C to 100°C (which takes only 418 kJ or 100 kcal).

Let’s compare:

Process Energy Dissipated
Heating 1 kg of water by 1°C 4.18 kJ
Heating 1 kg from 0°C to 100°C 418 kJ
Evaporating 1 kg of water 2,260 kJ (5.4× more)

Now compare this to non-evaporative surfaces like asphalt or metal roofs, which do not use energy to evaporate water. Instead, nearly all the incoming solar radiation is converted to sensible heat, which raises the surface and ambient air temperature.

This means that in green or moist landscapes (lawns, trees, wetlands), much of the solar energy goes into evaporation rather than heating, while in dry, impervious urban areas, it goes directly into warming the environment.

The Urban Green Advantage

  • Vegetated areas (lawns, trees, wetlands) act like natural air conditioners.

  • On a hot summer day, a single large tree can evaporate over 100 liters of water, dissipating over 225,000 kJ of heat—enough to offset the heat output of several cars.

  • Green roofs and permeable surfaces further enhance evaporation, providing localized cooling benefits.

Bottom Line

Evaporation is an energy-intensive process that removes heat from surfaces and air, dramatically reducing urban temperatures. In contrast, dry, impermeable surfaces only reflect or absorb heat, contributing to the intensity of the urban heat island effect.

Incorporating more water-retaining surfaces, vegetation, and green infrastructure into urban planning is one of the most effective ways to dissipate solar energy through evaporation rather than allowing it to accumulate as heat.

Integrating Data for Smarter Models

To fully understand and predict UHI behavior, researchers must integrate a variety of environmental data sources, including:

  • Solar radiation and surface reflectivity

  • Traffic patterns and vehicle density

  • Wind speed and direction

  • Surface temperature and humidity levels

  • Vegetative cover and soil moisture

Such an integrated approach allows for more accurate modeling of localized weather effects and offers insights into how city design, land use, and transportation infrastructure influence microclimates.

Urban Heat Islands vs. Climate Change

It’s critical to differentiate between urban heat islands and global climate change. While UHIs are driven by local factors and fluctuate with development patterns, climate change is a planetary-scale phenomenon linked to rising greenhouse gas concentrations, oceanic and atmospheric changes, and long-term warming trends.

UHIs do not cause global warming—but they do amplify its effects locally, making cities more vulnerable to heatwaves, public health crises, and increased energy demand for cooling.

Toward Resilient Urban Design

Understanding UHIs is not just a scientific exercise—it has practical implications for city planners, architects, and policymakers. Mitigation strategies include:

  • Using high-albedo roofing and paving materials

  • Expanding urban tree canopies and green spaces

  • Installing green roofs and reflective surfaces

  • Reducing ICE vehicle traffic through public transit and electrification

  • Designing cities that facilitate natural airflow

By incorporating environmental data into planning and design, we can build cities that are not only cooler and more comfortable but also more resilient to the larger threats posed by climate change.

Solar Powered Climate Control: Energy Transfer Through Evaporation

The Human Induced Climate Change Experiment

bookmark_borderBreathing in Danger: The Health Crisis of Air Pollution and How to Protect Yourself

by Daniel Brouse
August 6, 2025

Over the past several years, extreme air pollution events have become alarmingly common across the United States and beyond. If you’ve been noticing hazy skies, itchy eyes, or difficulty breathing, you’re not alone—and you’re not imagining things. With increasingly frequent wildfires, industrial emissions, and fossil fuel combustion, the air we breathe is becoming more dangerous by the day.

In these conditions, checking your home’s air purification systems is not just advisable—it’s essential. The list of diseases and health disorders linked to poor air quality is long and alarming. According to the World Health Organization, the following have all been directly associated with exposure to airborne pollutants:

  • Respiratory and cardiovascular diseases: asthma, bronchitis, COPD, emphysema, pneumonia, strokes, and heart attacks

  • Neurological and developmental impacts: Alzheimer’s disease, dementia, impaired brain development in children, cognitive decline

  • Cancers and systemic illnesses: lung cancer, liver disease, kidney disease, gastrointestinal disorders, and reproductive harm

  • Skin and eye damage: cataracts, dry eyes, corneal inflammation, permanent vision damage, and various skin diseases

  • Immune system dysfunction: increased susceptibility to infections and autoimmune disorders

  • Premature death: due to heart, lung, and systemic organ failure

Eye Irritation and Vision Loss

One of the most immediate effects of poor air quality is eye irritation. Short-term symptoms include burning, itching, dryness, blurred vision, watery eyes, and sensitivity to light. Long-term exposure to airborne particulates—especially PM2.5 and ozone—has been linked to chronic inflammation of the eyes, conjunctivitis, corneal abrasion, and even degenerative conditions such as cataracts and macular degeneration, which can lead to irreversible vision loss.

Particulate matter and chemical pollutants can accumulate in the tear film and on the surface of the eye, leading to persistent inflammation and oxidative stress. These conditions are especially dangerous for those with preexisting eye issues or contact lens wearers.

Eye Protection During Pollution Events

To reduce your risk:

  • Avoid going outside during high AQI events, especially when AQI is above 100.

  • Wear wraparound protective eyewear or sealed goggles if you’re outdoors for extended periods.

  • Use lubricating eye drops (artificial tears) to flush out irritants and relieve dryness.

  • Avoid rubbing your eyes, which can worsen inflammation and increase the risk of infection.

  • Indoors, maintain good air filtration to reduce indoor pollutants that can irritate your eyes.

Air Quality Maintenance and Indoor Protection

To protect your lungs and heart, clean or change your HVAC and air conditioner filters every two weeks, especially during high-pollution events. Better yet, use air purification units with HEPA filters or build your own Corsi-Rosenthal Box for a low-cost, high-efficiency solution.

What Is Particulate Matter?

The U.S. Environmental Protection Agency (EPA) defines particulate matter (PM) as a mixture of solid particles and liquid droplets suspended in the air. These particles range in size from visible dust and soot to microscopic toxins that can only be seen with an electron microscope. PM2.5—the finest and most dangerous type—can penetrate deep into your lungs, bloodstream, and even your eyes.

Breathing particle-laden air is comparable to smoking cigarettes. On days with an Air Quality Index (AQI) in the “Unhealthy” range, simply breathing can be as harmful as smoking a half-pack of cigarettes per day. Engaging in physical activity outdoors can magnify this damage, potentially reaching the equivalent of two packs a day.

The Cumulative Effect

The more particulate matter you inhale—or absorb through the eyes or skin—the greater your risk. Vulnerable populations—such as children, the elderly, and those with preexisting conditions—face an even higher danger. Long-term exposure increases the odds of strokes, heart disease, cancer, dementia, and chronic lung damage.

However, there’s hope. Just like quitting smoking reduces health risks over time, limiting your exposure to pollution can significantly lower your chance of developing serious complications.

Prevention: The Best Medicine

Here are key steps to take:

  • Avoid outdoor exercise on days with an AQI over 50.

  • On moderate to poor air quality days, wear an N95 mask and protective eyewear when outside.

  • Indoors, use HEPA purifiers or build a Corsi-Rosenthal Box—a DIY air purifier made from a box fan and high-efficiency filters. It is more affordable and, in many cases, more effective than commercial air purifiers.

How to Build a Corsi-Rosenthal Box

The Corsi-Rosenthal Box is an innovative, community-designed air filter that uses MERV-13 filters arranged in a cube with a box fan mounted on top. It’s a highly effective and inexpensive way to reduce indoor particle pollution. You can build one at home for under $100 with simple materials available at most hardware stores.

Build and run a Corsi-Rosenthal Box filter.

Final Thoughts

Air pollution is not just a distant environmental concern—it is an active and worsening public health emergency. From vision loss to heart failure, its reach is systemic and deadly. In the absence of meaningful political leadership on air quality, it is crucial for individuals and families to take personal protective action.

If you’re breathing—or seeing—today, you have a reason to act.

Health Impacts of Air Pollution
Build a Corsi-Rosenthal Box filter
Indoor Air Pollution: How to Purify the Air, Aromatic Plants, and Phytoncides

The Human Induced Climate Change Experiment

bookmark_borderInvisible Crisis: How Air Pollution Is Quietly Shortening American Lives

by Daniel Brouse
July 29 , 2025

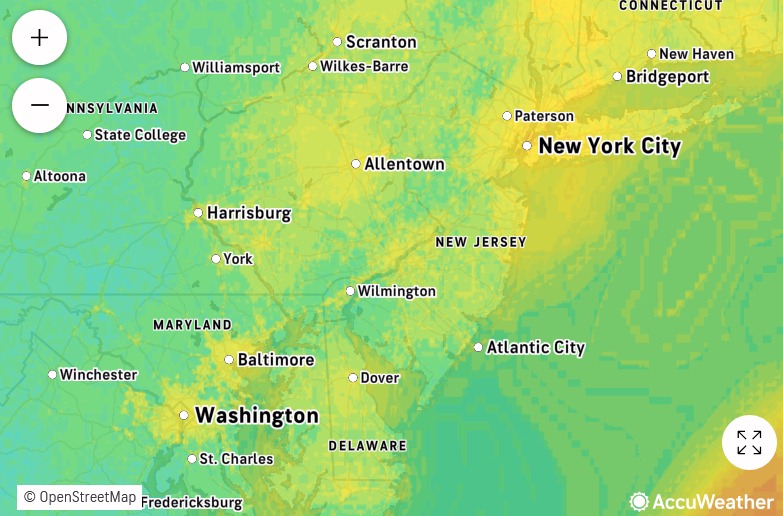
Today’s air quality map tells a story most people still fail to fully grasp: air pollution is not just a big-city problem. While it’s true that Philadelphia’s air quality is once again rated “unhealthy” today, the issue is far more widespread. Regions across Pennsylvania and surrounding states are also suffering—State College, Harrisburg, and even the Jersey Shore are experiencing poor air quality. Morgantown, West Virginia, consistently ranks among the worst in the nation, highlighting how rural and small-town America are not exempt from the invisible threat.

Air pollution is now the leading environmental cause of death in the United States. Fine particulate matter (PM2.5), ozone, nitrogen dioxide, and other airborne toxins contribute to heart disease, stroke, lung cancer, asthma, diabetes, and neurodegenerative disorders. These pollutants infiltrate the lungs, enter the bloodstream, and trigger systemic damage.

But what often gets overlooked is how air pollution initiates a health feedback loop. Exposure to chronic air pollution weakens the immune system, making the body more susceptible to both infectious and non-infectious diseases. It also causes epigenetic changes—altering how genes are expressed without changing the DNA itself—which can lead to lifelong health effects and be passed on to future generations. These changes reduce not just life expectancy, but the quality of life across one’s lifespan.

Worse still, this health feedback loop doesn’t exist in isolation—it interacts with climate-related feedback loops. For instance, warmer temperatures increase the formation of ground-level ozone and worsen wildfires, which dump more particulate pollution into the atmosphere. Simultaneously, climate-driven disruptions in agriculture and ecosystems compound the toll on human health through food insecurity and new disease vectors. The result is an accelerating cycle of harm that is exponentially shortening human lives.

What’s happening today on the air quality map is not a one-off event—it’s part of a long-term systemic crisis. The air we breathe is silently but powerfully eroding public health, disproportionately impacting children, the elderly, and frontline communities. Unless serious interventions are made at every level—from fossil fuel phase-outs to public health reforms—we are headed toward a future where the simple act of breathing becomes a daily health risk for millions.

Conclusion
Health feedback loops, violent rain, and deadly humid heat are fueling an exponential rise in climate-related deaths. This lethal triad — disease, extreme heat, and intense rainfall — demonstrates that climate change is not a distant threat but a rapidly accelerating public health emergency. These stressors interact and amplify one another, creating a cascade of compounding impacts that demand urgent intervention.

All 50 U.S. states — including Alaska — are already experiencing deadly humid heat advisories. Large regions of the country are becoming uninhabitable for weeks or even months each year due to extreme heat. Wet-bulb temperatures are approaching 31°C (87.8°F) in multiple states — a physiological threshold beyond which sustained outdoor survival is impossible, even with water and shade. Meanwhile, violent rain events are killing hundreds and causing billions in annual damage. Climate-driven health feedback loops have become the leading cause of mortality in the United States — fueled by systemic interactions between temperature extremes, air quality degradation, disease vectors, and infrastructure collapse. Addressing climate change is no longer just an environmental imperative — it is a public health necessity.

Our climate model — which incorporates complex socio-economic and ecological feedback loops within a dynamic, nonlinear system — projects that global temperatures could rise by up to 9°C (16.2°F) within this century. This far exceeds earlier estimates of a 4°C rise over the next thousand years, highlighting a dramatic acceleration in global warming. We are now entering a phase of compound, cascading collapse, where climate, ecological, and societal systems destabilize through interlinked, self-reinforcing feedback loops.

We examine how human activities — such as deforestation, fossil fuel combustion, mass consumption, industrial agriculture, and land development — interact with ecological processes like thermal energy redistribution, carbon cycling, hydrological flow, biodiversity loss, and the spread of disease vectors. These interactions do not follow linear cause-and-effect patterns. Instead, they form complex, self-reinforcing feedback loops that can trigger rapid, system-wide transformations — often abruptly and without warning. Grasping these dynamics is crucial for accurately assessing global risks and developing effective strategies for long-term survival.


The Human Induced Climate Change Experiment

bookmark_borderDual Wildfires and Climate Change Push Philly Air to ‘Hazardous’ Levels

by Daniel Brouse
June 14, 2025

The Air Quality Index (AQI) categorizes anything above 300 as “hazardous”—the highest and most dangerous level of pollution. Today, Philadelphia has surged to an AQI of 372, while parts of Delaware have exceeded 440, signaling extremely unhealthy conditions for the entire population, not just those with pre-existing health conditions. These levels are rarely seen outside major environmental disasters.

This unprecedented spike is due to a rare convergence of wildfire smoke from both distant and local sources, with the crisis intensified by climate change. Massive wildfires burning across Canada—particularly in British Columbia, Alberta, and the Prairie provinces—have sent thick plumes of smoke drifting southward under a stalled high-pressure system. This upper-atmosphere smoke has blanketed much of the U.S. Northeast in fine particulate pollution (PM2.5).

Simultaneously, the Mines Spung wildfire in Burlington County, New Jersey, has been tearing through over 3,250 acres of Wharton State Forest. The fire remains only partially contained, and its smoke is pouring into the region at ground level, compounding the already critical pollution levels from the Canadian fires.

This dual-smoke event is pushing PM2.5 concentrations into the most dangerous range of the Air Quality Index. These microscopic particles can penetrate deep into the lungs and bloodstream, triggering respiratory distress, cardiovascular problems, and other serious health effects—even in otherwise healthy individuals. Children, seniors, and people with asthma or heart disease are especially vulnerable, but no one is safe at these levels.

Scientists increasingly link the intensity, frequency, and geographic spread of wildfires to climate change. Rising global temperatures, driven by greenhouse gas emissions, are creating hotter, drier, and longer fire seasons—a trend that is turning what were once rare pollution emergencies into a recurring public health crisis.

Residents are urged to stay indoors, limit physical activity, and run HEPA-rated air purifiers if available. If venturing outside is unavoidable, N95 or P100 masks are recommended. With wildfires expected to worsen in the coming decades, events like today are not outliers—they are a warning of what the future will hold if global emissions are not urgently curbed.

Trumpenomics: The Decline of the US

The Human Induced Climate Change Experiment

bookmark_borderSmoke Haze Over Philadelphia

A thick haze continues to linger over Philadelphia, driven by smoke from persistent Canadian wildfires. The region is currently under a Code Orange air quality alert, signaling unhealthy conditions for sensitive groups such as children, the elderly, and those with respiratory or heart issues. While the smoke largely remains in the upper atmosphere, it occasionally dips closer to the ground, creating eerie sunsets and raising pollution levels throughout the day. Morning air quality tends to be better, but levels worsen as the day progresses.

These hazy skies are a direct consequence of a record-breaking wildfire season unfolding across Canada. As of June 10, over 7.8 million acres (or about 3.38 million hectares) have already burned—surpassing the 25-year average and coming close to 2023’s catastrophic levels. More than 1,800 fires are currently active across the country, with over 200 considered out of control. Fires are most intense in the Prairie provinces (Manitoba, Saskatchewan, Alberta), but significant activity is also occurring in British Columbia, Ontario, Quebec, and Newfoundland & Labrador. Sparked by both lightning and human activity, these fires have forced the evacuation of more than 32,000 people and led to at least two confirmed deaths. Manitoba and Saskatchewan have declared states of emergency in response to the scale and intensity of the destruction.

Looking ahead, the outlook remains grim. Meteorologists expect hot and dry conditions to persist across much of western and central Canada through June and July, elevating the risk of further ignition and spread. This means the U.S. Northeast, including Philadelphia, will likely continue to experience bouts of poor air quality as the smoke travels south with prevailing winds. Residents are advised to monitor real-time air quality updates through local sources like AirNow or 6abc and to take precautions such as limiting outdoor activity and using indoor air purifiers with HEPA or MERV-rated filters.

In short, the smoky skies over Philadelphia are not just an aesthetic or fleeting phenomenon—they are a direct and visible consequence of worsening climate conditions. With Canada’s wildfire crisis showing no signs of abating, the haze may come and go, but the underlying threat remains firmly in place.

RESOURCES

The best lifestyle is to avoid particulate matter. Exercise outside only on days with a “Good” AQI under 50. If you must go out on days with an AQI over 50, wear an N95 mask. Indoors build and run a Corsi-Rosenthal Box filter.

Health Impacts of Air Pollution
and Indoor Air Pollution: How to Purify the Air


Death By Ozone
Pollution And Health: 9 Million Deaths Per Year
Health And Air Quality
Air Pollution Deaths
Air Pollution Killing Millions
Largest Health Risk

The Human Induced Climate Change Experiment

bookmark_borderToxic Skies: Ozone, Wildfires, and Saharan Dust Collide Across the U.S.

by Daniel Brouse
June 4, 2025

Air Quality Today: A Triple Threat

Across the United States today, millions are facing a dangerous cocktail of air pollution events driven by both human activity and climate disruption. From Canadian wildfires and Saharan dust storms to toxic ground-level ozone, Americans are increasingly breathing air that threatens their health, safety, and long-term well-being.

Wildfire Smoke: A Growing Hazard from the North

In the Midwest, massive wildfires burning across Canada are triggering air quality alerts, making outdoor activity risky for vulnerable populations. While the jet stream is currently carrying much of the smoke high in the atmosphere and sparing the U.S. East Coast—for now—this circulation pattern can shift quickly. The fires remain out of control, fueled by rising temperatures and prolonged drought conditions. As the wildfire season grows longer and more intense, no part of the U.S. is safe from the haze and health effects that follow.

Saharan Dust: A Transatlantic Health Crisis

At the same time, unusually severe Saharan dust storms are sweeping across the Atlantic, blanketing the Caribbean and southeastern United States in fine particulate matter. Florida, in particular, is experiencing air quality alerts as dust-laden air raises the risk of respiratory distress, especially for those with asthma, COPD, or other pre-existing health conditions. These dust plumes, once rare or moderate in strength, are becoming stronger and more frequent as climate conditions intensify desertification across North Africa.

Ozone Pollution: A Silent Killer in U.S. Cities

In urban areas like the Philadelphia region, ground-level ozone is adding to the danger. Unlike the protective ozone layer high above the Earth, low-level ozone is a toxic byproduct of fossil fuel combustion—emitted by vehicles, power plants, and industrial processes. It forms when pollutants react in sunlight, especially during hot, stagnant weather.

Not only does ozone damage human lungs and cardiovascular systems—ranking as one of the leading causes of air pollution-related deaths—it also harms plant life. By impairing the ability of plants to absorb carbon dioxide, ozone pollution creates a feedback loop that further accelerates climate change.

Climate Change: The Unifying Force Behind the Crisis

Each of these events—wildfire smoke, transcontinental dust, and ground-level ozone—might once have been considered separate environmental issues. But today, they are all symptoms of the same underlying crisis: a rapidly destabilizing climate. Human-induced global warming is not only intensifying these phenomena but also increasing their frequency and geographic spread.

Pollutants are no longer just local problems. The air in your lungs may carry particles from a fire hundreds of miles away, or dust that traveled thousands of miles across the ocean. And with every passing year, the boundaries that once separated natural disasters are eroding, replaced by a continuous global threat to air quality, public health, and ecological balance.

Looking Ahead

Until aggressive action is taken to reduce greenhouse gas emissions and transition away from fossil fuels, Americans can expect these dangerous air quality events to become more common, more severe, and more interconnected. The skies may be hazy, but the message is clear: climate change is already here—and we are breathing it.

The Human Induced Climate Change Experiment

bookmark_borderUnseen Borders: How Climate Change, Wildfires, and Saharan Dust Are Choking U.S. Skies

by Daniel Brouse
June 3, 2025

Climate change is rapidly transforming the quality of the air we breathe—and its effects are neither local nor contained. As global temperatures rise, so too do the intensity and frequency of wildfires, droughts, and dust storms, with far-reaching consequences that extend across continents and oceans. Air pollution has become one of the most visible and harmful symptoms of our changing climate, and it increasingly ignores the boundaries we rely on to manage environmental threats.

This week, the United States faces a convergence of atmospheric threats that underscore the global nature of the crisis. A massive plume of Saharan dust is sweeping across the Atlantic and is expected to reach Florida, bringing hazy skies and worsening air quality across the southeastern U.S. Though common during the summer months, this year’s dust cloud is especially large and could have broad effects on respiratory health, especially for children, the elderly, and people with asthma or other preexisting conditions.

At the same time, smoke from ongoing Canadian wildfires is drifting southward toward the U.S. East Coast. Satellite maps and air quality forecasts show large swaths of smoke making their way into the Mid-Atlantic and Northeast, threatening to trigger another wave of “code orange” or worse air quality alerts. Cities from Washington D.C. to New York and Boston may experience hazy skies, reduced visibility, and increased pollution levels.

The dual impact of transcontinental dust and wildfire smoke reveals a grim truth: climate change-induced air hazards are now a regular part of the atmospheric system. Wildfires in boreal forests and desertification in North Africa—once considered remote or seasonal events—are now directly impacting millions of Americans on a near-constant basis.

Air quality maps now resemble climate change threat maps: dynamic, unpredictable, and dangerously expansive. And while mitigation efforts often focus on emissions from vehicles or industry, these transboundary air events show that we are also facing a feedback loop. Hotter temperatures dry out landscapes, which fuel more fires and increase dust activity. In turn, these pollutants contribute to even more warming and exacerbate human health risks.

There is no local fix for a global problem. From the deserts of the Sahara to the forests of Alberta, climate change is linking ecosystems and weather patterns in new, often dangerous ways. It’s no longer just a matter of local environmental management—it’s a matter of international coordination, climate adaptation, and rapid decarbonization.

Until we act comprehensively and globally, the air we breathe will continue to deteriorate, crossing borders and boundaries just as fast as the climate crisis accelerates.

The Human Induced Climate Change Experiment

bookmark_borderHealth Impacts of Air Pollution

By Daniel Brouse
June 30, 2023

The health impacts of air pollution are both cumulative and irreversible. The more polluted the air, the more severe the effects. The more polluted air you breathe over time, the more severe the effects. That is to say breathing “Moderate” quality air for 3 days might be similar to breathing “Unhealthy for Sensitive Group” quality air for 1 day. In both cases, your respiratory, circulatory, neurological, and immune systems have been damaged. A partial list of ailments include:
Alzheimer’s Disease, asthma, bronchitis, cancer, cataracts, chronic obstructive pulmonary disease (COPD), dementia, developmental damage, emphysema, gastrointestinal disorders, heart ailments, heart attacks, immune system dysfunction (including susceptibility to infections), ischaemic heart disease, impaired brain development in children, kidney disease, liver disease, lung disease, premature death, pneumonia, nasal and upper respiratory tract health problems, neurological disorders, respiratory system failure, skin diseases, strokes

You can (and should) check your local air quality several times a day at AirNow.gov. The air quality index (AQI) goes from 0 to 500. An AQI value of 50 or below represents good air quality, while an AQI value over 300 represents hazardous air quality.

EPA establishes an AQI for five major air pollutants regulated by the Clean Air Act. Each of these pollutants has a national air quality standard set by EPA to protect public health:

  • ground-level ozone
  • particle pollution (also known as particulate matter, including PM2.5 and PM10)
  • carbon monoxide
  • sulfur dioxide
  • nitrogen dioxide

Following is an explanation of two of these pollutants — particle pollution and ground-level ozone.

Particulate Matter (PM)

The EPA defines particulate matter (also called particle pollution): the term for a mixture of solid particles and liquid droplets found in the air. Some particles, such as dust, dirt, soot, or smoke, are large or dark enough to be seen with the naked eye. Others are so small they can only be detected using an electron microscope.

Particle pollution is similar to smoking cigarettes. The more you inhale, the worse it is for you. Also, the more particles in the air you breath, the worse it is for you. Breathing air on a day with an AQI that is unhealthy is similar to smoking a half-pack of cigarettes. If you go running instead of walking, it might be equivalent to smoking 2 packs of cigarettes.

The more particulate matter you breathe in over time, the greater the cumulative effect. The impact on your health will depend on your predisposition. In all cases your risk increases for nasal and upper respiratory tract health problems, heart attacks, strokes, asthma, and bronchitis, as well as premature death from heart ailments, lung disease, and cancer. Studies show that exposure can impair brain development in children and are significantly associated with the development of dementia and Alzheimer’s disease.

Some of the impacts of particle pollution may be reversed overtime if further exposure to particle pollution is eliminated. After five years of quitting smoking, the risk of developing complications decreases by up to 50%.

The best lifestyle is to avoid particulate matter. Exercise outside only on days with a “Good” AQI under 50. If you must go out on days with an AQI over 50, wear an N95 mask. Indoors build and run a Corsi-Rosenthal Box filter.

Ground-level Ozone

Tropospheric ozone is low level ozone caused by humans. Tropospheric ozone is “bad ozone” that causes health problems in humans, plants to die and other destructive results. (Stratospheric ozone, the good ozone, is the ozone layer in the stratosphere that keeps 95-99% of the suns ultraviolet radiation from striking the earth.)

“Tropospheric ozone is formed by the interaction of sunlight, particularly ultraviolet light, with hydrocarbons and nitrogen oxides, which are emitted by automobiles, gasoline vapors, fossil fuel power plants, refineries, and certain other industries.” — National Center for Atmospheric Research

Ozone primarily affects the respiratory and immune systems. The damage is permanent, untreatable and often results in death. The Santa Barbara County Air Pollution Control District reports, “Roughly one out of three people in the U.S. is at risk of experiencing ozone-related health effects.”

The best lifestyle is to avoid ozone exposure. Since heat and ultraviolet light are needed to create ozone, staying indoors offers the best protection. Neither masks nor air purifiers protect from ozone exposure. (Ozone is O3 and almost the same size as Oxygen O2)

REFERENCES
Death by Ozone
COVID-19 and Air Pollution
Ozone Know Zone
Air Pollution Kills
Indoor Air Pollution: How to Purify the Air, Aromatic Plants, and Phytoncides
Corsi-Rosenthal Box filter
The Human Induced Climate Change Experiment

bookmark_borderHealth and Climate Change: Health at the Mercy of Fossil Fuels

The Lancet released the report The 2022 report of the Lancet Countdown on health and climate change: health at the mercy of fossil fuels.

Q: Are millions of people already dying as a result of human induced climate change?
A: Yes.

Q: Can millions of people’s lives still be saved?
A: Yes, “a health-centred response can still deliver a thriving future if immediate action is taken.”
“The health impacts of multiple crises are being exacerbated by persistent fossil fuel dependence and putting additional strain on health systems. This is resulting in increased risk of food insecurity, infectious disease transmission, heat-related disease, energy poverty, and deaths from exposure to air pollution.”

A call to action
After 30 years of UNFCCC negotiations, the Lancet Countdown indicators show that countries and companies continue to make choices that threaten the health and survival of people in every part of the world. As countries devise ways to recover from the coexisting crises, the evidence is unequivocal. At this critical juncture, an immediate, health-centred response can still secure a future in which world populations can not only survive, but thrive.

Key findings of the 2022 report of the Lancet Countdown

  • • Climate change is undermining every dimension of global health monitored, increasing the fragility of the global systems that health depends on, and increasing the vulnerability of populations to the coexisting geopolitical, energy, and cost-of-living crises.
  • • Climate change is increasingly undermining global food security, exacerbating the effects of the COVID-19, geopolitical, energy, and cost-of-living crises. New analysis of 103 countries shows that days of extreme heat, increasing in frequency and intensity due to climate change, accounted for an estimated 98 million more people reporting moderate to severe food insecurity in 2020 than the average in 1981–2010 (indicator 1.4).
  • • Well-prepared health systems are essential to protect populations from the health impacts of climate change. However, global health systems have been drastically weakened by the effects of the COVID-19 pandemic, and the funds available for climate action decreased in 239 (30%) of 798 cities (indicator 2.1.3), with health systems increasingly being affected by extreme weather events and supply chain disruptions too.
  • • Insufficient climate change adaptation efforts have left health systems vulnerable to climate change-related health hazards. Only 48 of 95 countries have assessed their climate change adaptation needs (indicator 2.1.1) and only 63% of countries reported high to very high implementation status for health emergency management in 2021 (indicator 2.2.4). Increasing adaptation to climate change has the potential to simultaneously improve the capacity of health systems to manage both future infectious disease outbreaks and other health emergencies (indicator 2.3.1).
  • • Mitigation of the energy sector is crucial to keep the rise in global mean surface temperatures within the 1·5°C target set in the Paris Agreement. However, the energy sector is still heavily reliant on fossil fuels. Its carbon intensity decreased by less than 1% since the year the UNFCCC was signed, and a simultaneous increase in energy demand of 59% has increased total energy sector emissions to record high levels in 2021 (indicator 3.1). Now, as countries seek alternatives to Russian fossil fuels, many are backsliding to coal, and shifts in global energy supplies risk a net increase in fossil fuel production and consumption.
  • • The slow adoption of renewable energies, which contribute to only 2.2% of total global energy supply (indicator 3.1), means households remain vulnerable to highly volatile international fossil fuel markets, and millions lack access to reliable, clean sources of fuel. Traditional biomass accounts for 31% of the energy consumed in the domestic sector globally, and for 96% of that in low HDI countries (indicator 3.2). New analysis shows that the air in people’s homes in 62 countries analysed exceeded WHO guidelines for safe concentrations of small particulate air pollution (PM2·5) in 2020, by 30-fold on average (indicator 3.2). The current energy and cost-of-living crises, now threatens to worsen enery poverty.
  • • A new indicator this year reveals that, on the basis of their existing production strategies and market shares, 15 of the largest oil and gas companies would exceed their share of greenhouse gas emissions compatible with the 1·5°C climate target by an average of 87% (publicly-listed international companies) and 111% (state-owned national companies) in 2040 making the goals of the Paris Agreement unattainable (indicator 4.2.6).
  • • In 2019, 69 (80%) of 86 countries reviewed had net-negative carbon prices (ie, provided a net subsidy to fossil fuels) for a net total of US$400 billion. These subsidies exceeded 10% of national health spending in 31 countries and exceeded 100% in 5 countries (indicator 4.2.4). Meanwhile, climate efforts are being undercut by a profound scarcity of funding (indicator 2.1.1).
  • • A health-centred response to the coexisting climate, energy, and cost-of-living crises provides an opportunity to deliver a healthy, low-carbon future. Transitioning to clean energy and improved energy efficiency can avert the most catastrophic climate change impacts, while also improving energy security, supporting economic recovery, preventing the 1·2 million annual deaths resulting from exposure to fossil fuel-derived ambient PM2·5 (indicator 3.3), and improving health outcomes by promoting active forms of travel for greener cities. The associated reduction in the burden of disease will in turn reduce the strain on overwhelmed healthcare providers, and enable better care.
  • • The media, the scientific community, corporations, and country leaders are increasingly engaging in health and climate change (indicators 5.1–5.5), and new analysis shows that 86% of updated or new Nationally Determined Contributions now reference health (indicator 5.4).
  • • Countries are attempting to cut their dependence on international oil and gas supplies in response to the war in Ukraine and energy crisis, with some focusing on increasing renewable energy generation, raising hopes that a health-centred response could be emerging. However, the increased engagement and commitments must be urgently translated into action for hope to turn into reality.

Executive summary

The 2022 report of the Lancet Countdown is published as the world confronts profound and concurrent systemic shocks. Countries and health systems continue to contend with the health, social, and economic impacts of the COVID-19 pandemic, while Russia’s invasion of Ukraine and a persistent fossil fuel overdependence has pushed the world into global energy and cost-of-living crises. As these crises unfold, climate change escalates unabated. Its worsening impacts are increasingly affecting the foundations of human health and wellbeing, exacerbating the vulnerability of the world’s populations to concurrent health threats.

During 2021 and 2022, extreme weather events caused devastation across every continent, adding further pressure to health services already grappling with the impacts of the COVID-19 pandemic. Floods in Australia, Brazil, China, western Europe, Malaysia, Pakistan, South Africa, and South Sudan caused thousands of deaths, displaced hundreds of thousands of people, and caused billions of dollars in economic losses. Wildfires caused devastation in Canada, the USA, Greece, Algeria, Italy, Spain, and Türkiye, and record temperatures were recorded in many countries, including Australia, Canada, India, Italy, Oman, Türkiye, Pakistan, and the UK. With advancements in the science of detection and attribution studies, the influence of climate change over many events has now been quantified.

Because of the rapidly increasing temperatures, vulnerable populations (adults older than 65 years, and children younger than one year of age) were exposed to 3·7 billion more heatwave days in 2021 than annually in 1986–2005 (indicator 1.1.2), and heat-related deaths increased by 68% between 2000–04 and 2017–21 (indicator 1.1.5), a death toll that was significantly exacerbated by the confluence of the COVID-19 pandemic.

Simultaneously, the changing climate is affecting the spread of infectious diseases, putting populations at higher risk of emerging diseases and co-epidemics. Coastal waters are becoming more suitable for the transmission of Vibrio pathogens; the number of months suitable for malaria transmission increased by 31·3% in the highland areas of the Americas and 13·8% in the highland areas of Africa from 1951–60 to 2012–21, and the likelihood of dengue transmission rose by 12% in the same period (indicator 1.3.1). The coexistence of dengue outbreaks with the COVID-19 pandemic led to aggravated pressure on health systems, misdiagnosis, and difficulties in management of both diseases in many regions of South America, Asia, and Africa.

The economic losses associated with climate change impacts are also increasing pressure on families and economies already challenged with the synergistic effects of the COVID-19 pandemic and the international cost-of-living and energy crises, further undermining the socioeconomic determinants that good health depends on. Heat exposure led to 470 billion potential labour hours lost globally in 2021 (indicator 1.1.4), with potential income losses equivalent to 0·72% of the global economic output, increasing to 5·6% of the GDP in low Human Development Index (HDI) countries, where workers are most vulnerable to the effects of financial fluctuations (indicator 4.1.3). Meanwhile, extreme weather events caused damage worth US$253 billion in 2021, particularly burdening people in low HDI countries in which almost none of the losses were insured (indicator 4.1.1).

Through multiple and interconnected pathways, every dimension of food security is being affected by climate change, aggravating the impacts of other coexisting crises. The higher temperatures threaten crop yields directly, with the growth seasons of maize on average 9 days shorter in 2020, and the growth seasons of winter wheat and spring wheat 6 days shorter than for 1981–2010 globally (indicator 1.4). The threat to crop yields adds to the rising impact of extreme weather on supply chains, socioeconomic pressures, and the risk of infectious disease transmission, undermining food availability, access, stability, and utilisation. New analysis suggests that extreme heat was associated with 98 million more people reporting moderate to severe food insecurity in 2020 than annually in 1981–2010, in 103 countries analysed (indicator 1.4). The increasingly extreme weather worsens the stability of global food systems, acting in synergy with other concurrent crises to reverse progress towards hunger eradication. Indeed, the prevalence of undernourishment increased during the COVID-19 pandemic, and up to 161 million more people faced hunger during the COVID-19 pandemic in 2020 than in 2019. This situation is now worsened by Russia’s invasion of Ukraine and the energy and cost-of-living crises, with impacts on international agricultural production and supply chains threatening to result in 13 million additional people facing undernutrition in 2022.

A debilitated first line of defence

With the worsening health impacts of climate change compounding other coexisting crises, populations worldwide increasingly rely on health systems as their first line of defence. However, just as the need for healthcare rises, health systems worldwide are debilitated by the effects of the COVID-19 pandemic and the energy and cost-of-living crises. Urgent action is therefore needed to strengthen health-system resilience and to prevent a rapidly escalating loss of lives and to prevent suffering in a changing climate. However, only 48 (51%) of 95 countries reported having assessed their climate change adaptation needs (indicator 2.1.1) and, even after the profound impacts of COVID-19, only 60 (63%) countries reported a high to very high implementation status for health emergency management in 2021 (indicator 2.2.4).

The scarcity of proactive adaptation is shown in the response to extreme heat. Despite the local cooling and overall health benefits of urban greenspaces, only 277 (27%) of 1038 global urban centres were at least moderately green in 2021 (indicator 2.2.3), and the number of households with air conditioning increased by 66% from 2000 to 2020, a maladaptive response that worsens the energy crisis and further increases urban heat, air pollution, and greenhouse gas emissions.

As converging crises further threaten the world’s life-supporting systems, rapid, decisive, and coherent intersectoral action is essential to protect human health from the hazards of the rapidly changing climate.

Health at the mercy of fossil fuels

The year 2022 marks the 30th anniversary of the signing of the UN Framework Convention on Climate Change, in which countries agreed to prevent dangerous anthropogenic climate change and its deleterious effects on human health and welfare. However, little meaningful action has since followed. The carbon intensity of the global energy system has decreased by less than 1% since the UNFCCC was established, and global electricity generation is still dominated by fossil fuels, with renewable energy contributing to only 8·2% of the global total (indicator 3.1). Simultaneously, the total energy demand has risen by 59%, increasing energy-related emissions to a historical high in 2021. Current policies put the world on track to a catastrophic 2·7°C increase by the end of the century. Even with the commitments that countries set in the Nationally Determined Contributions (NDCs) updated up until November 2021, global emissions could be 13·7% above 2010 levels by 2030—far from the 43% decrease from current levels required to meet Paris Agreement goals and keep temperatures within the limits of adaptation.

Fossil fuel dependence is not only undermining global health through increased climate change impacts, but also affects human health and wellbeing directly, through volatile and unpredictable fossil fuel markets, frail supply chains, and geopolitical conflicts. As a result, millions of people do not have access to the energy needed to keep their homes at healthy temperatures, preserve food and medication, and meet the seventh Sustainable Development Goal (to ensure access to affordable, reliable, sustainable, and modern energy for all). Without sufficient support, access to clean energy has been particularly slow in low HDI countries, and only 1·4% of their electricity came from modern renewables (mostly wind and solar power) in 2020 (indicator 3.1). An estimated 59% of health-care facilities in low and middle-income countries still do not have access to the reliable electricity needed to provide basic care. Meanwhile, biomass accounts for as much as 31% of the energy consumed in the domestic sector globally, mostly from traditional sources—a proportion that increases to 96% in low HDI countries (indicator 3.2). The associated burden of disease is substantial, with the air in people’s homes exceeding WHO guidelines for safe concentrations of small particulate air pollution (PM2·5) in 2020 by 30-fold on average in the 62 countries assessed (indicator 3.2). After 6 years of improvement, the number of people without access to electricity increased in 2020 as a result of the socioeconomic pressures of the COVID-19 pandemic. The current energy and cost-of-living crises now threaten to reverse progress toward affordable, reliable, and sustainable energy, further undermining the socioeconomic determinants of health.

Simultaneously, oil and gas companies are registering record profits, while their production strategies continue to undermine people’s lives and wellbeing. An analysis of the production strategies of 15 of the world’s largest oil and gas companies, as of February 2022, revealed they exceed their share of emissions consistent with 1·5°C of global heating (indicator 4.2.6) by 37% in 2030 and 103% in 2040, continuing to undermine efforts to deliver a low carbon, healthy, liveable future. Aggravating this situation even further, governments continue to incentivise fossil fuel production and consumption: 69 (80%) of 86 countries reviewed had net-negative carbon prices (ie, provided a net subsidy to fossil fuels) for a net total of US$400 billion in 2019, allocating amounts often comparable with or even exceeding their total health budgets (indicator 4.2.4). Simultaneously, wealthier countries failed to meet their commitment of mobilising the considerably lower sum of $100 billion annually by 2020 as agreed at the 2009 Copenhagen Accord to support climate action in “developing countries”, and climate efforts are being undercut by a profound scarcity of funding (indicator 2.1.1). The impacts of climate change on global economies, together with the recession triggered by COVID-19 and worsened by geopolitical instability, could paradoxically further reduce the willingness of countries to allocate the funds needed to enable a just climate transition.

A health-centred response for a thriving future

The world is at a critical juncture. With countries facing concurrent crises, the implementation of long-term emissions-reduction policies risks being deflected or defeated by challenges wrongly perceived as more immediate. Addressing each of the concurrent crises in isolation risks alleviating one, while worsening another. Such a situation is emerging from the response to COVID-19, which has so far has not delivered the green recovery that the health community proposed, and, on the contrary, is aggravating climate change-related health risks. Less than one third of $3·11 trillion allocated to COVID-19 economic recovery is likely to reduce greenhouse gas emissions or air pollution, with the net effect likely to increase emissions. The COVID-19 pandemic affected climate action at the city level, and 239 (30%) of 798 cities reported that COVID-19 reduced financing available for climate action (indicator 2.1.3).

As countries search for alternatives to Russian oil and gas, many continue to favour the burning of fossil fuels, with some even turning back to coal. Shifts in global energy supplies threaten to increase fossil fuel production. Even if implemented as a temporary transition, these responses could reverse progress on air quality improvement, irreversibly push the world off track from meeting the commitments set out in the Paris Agreement, and guarantee a future of accelerated climate change that threatens human survival.

On the contrary, in this pivotal moment, a health-centred response to the current crises would still provide the opportunity for a low-carbon, resilient future, which not only avoids the health harms of accelerated climate change, but also delivers improved health and wellbeing through the associated co-benefits of climate action. Such response would see countries promptly shifting away from fossil fuels, reducing their dependence on fragile international oil and gas markets, and accelerating a just transition to clean energy sources. A health-centred response would reduce the likelihood of the most catastrophic climate change impacts, while improving energy security, creating an opportunity for economic recovery, and offering immediate health benefits. Improvements in air quality would help to prevent the 1·2 million deaths resulting from exposure to fossil fuel-derived ambient PM2·5 in 2020 alone (indicator 3.3), and a health-centred energy transition would enhance low-carbon travel and increase urban green spaces, promoting physical activity, and improving physical and mental health. In the food sector, an accelerated transition to balanced and more plant-based diets would not only help reduce the 55% of agricultural sector emissions coming from red meat and milk production (indicator 3.5.1), but also prevent up to 11·5 million diet-related deaths annually (indicator 3.5.2), and substantially reduce the risk of zoonotic diseases. These health-focused shifts would reduce the burden of communicable and non-communicable diseases, reducing the strain on overwhelmed health-care providers. Importantly, accelerating climate change adaptation would lead to more robust health systems, minimising the negative impacts of future infectious disease outbreaks and geopolitical conflicts, and restoring the first line of defence of global populations.

Emerging glimmers of hope

Despite decades of insufficient action, emerging, albeit few, signs of change provide some hope that a health-centred response might be starting to emerge. Individual engagement with the health dimensions of climate change, essential to drive and enable an accelerated response, increased from 2020 to 2021 (indicator 5.2), and coverage of health and climate change in the media reached a new record high in 2021, with a 27% increase from 2020 (indicator 5.1). This engagement is also reflected by country leaders, with a record 60% of 194 countries focusing their attention on the links between climate change and health in the 2021 UN General Debate, and with 86% of national updated or new NDCs making references to health (indicator 5.4). At the city level, local authorities are progressively identifying risks of climate change on the health of their populations (indicator 2.1.3), a first step to delivering a tailored response that strengthens local health systems. Although the health sector is responsible for 5·2% of all global emissions (indicator 3.6), it has shown impressive climate leadership, and 60 countries had committed to transitioning to climate-resilient and/or low-carbon or net-zero carbon health systems as part of the COP26 Health Programme, as of July, 2022.

Signs of change are also emerging in the energy sector. Although total clean energy generation remains grossly insufficient, record high levels were reached in 2020 (indicator 3.1). Zero-carbon sources accounted for 80% of investment in electricity generation in 2021 (indicator 4.2.1), and renewable energies have reached cost parity with fossil fuel energies. As some of the highest emitting countries attempt to cut their dependence on oil and gas in response to the war in Ukraine and soaring energy prices, many are focusing on increasing renewable energy generation, raising hopes for a health-centred response. However, increased awareness and commitments should be urgently translated into action for hope to turn into reality.

A call to action

After 30 years of UNFCCC negotiations, the Lancet Countdown indicators show that countries and companies continue to make choices that threaten the health and survival of people in every part of the world. As countries devise ways to recover from the coexisting crises, the evidence is unequivocal. At this critical juncture, an immediate, health-centred response can still secure a future in which world populations can not only survive, but thrive.

More articles on Climate Change and Health and Global Warming.
bookmark_borderAir Pollution and Cognitive Decline, Dementia

In a UK study, a causal relationship has been established between air pollution and cognitive decline / dementia. The primary cause is a decline in blood flow to the brain.

Cognitive decline, dementia and air pollution

COMEAP reviewed nearly 70 studies in human populations (epidemiological studies) which looked at possible links between air pollution and a decline in mental ability and dementia in older people. They also considered studies which investigated how air pollution might affect the brain.

From this review, it can be concluded that it is likely that air pollution does contribute to these effects. The most likely way this occurs is through effects on the circulation. It is known that air pollutants, particularly small particles, can affect the heart and blood vessels, including to the brain.

POLLUTION OVERVIEW
Morgantown, Philadelphia-Reading-Camden, PA, New York/Newark, Pittsburgh-New Castle-Weirton, PA rank in the worst pollution for the Northeastern USA.

The worst in Pennsylvania include Emsworth, Forest Hills, Freedom, Ben Avon, Edgewood, Braddock, Millvale, Carnegie, North Braddock, Sewickley, McKeesport, Bristol, Chester, Norristown, Harrisburg, Hershey, Lancaster, Kutztown, York, Allentown, Freemansburg, Swiftwater, Wilkes-Barre, Altoona, Montoursville, State College, Tioga, Kittanning, Farrel, and Erie.

WORST CITIES FOR OZONE POLLUTION
#1: Los Angeles-Long Beach, CA
#2: Bakersfield, CA
#3: Visalia, CA
#4: Fresno-Madera-Hanford, CA
#5: Phoenix-Mesa, AZ
#6: San Diego-Chula Vista-Carlsbad, CA
#7: Denver-Aurora, CO
#8: Houston-The Woodlands, TX
#9: Sacramento-Roseville, CA
#10: Salt Lake City-Provo-Orem, UT
#11: Las Vegas-Henderson, NV
#12: El Paso-Las Cruces, TX-NM
#13: San Jose-San Francisco-Oakland, CA
#14: New York-Newark, NY-NJ-CT-PA
#15: El Centro, CA
#16: Chicago-Naperville, IL-IN-WI
#16: Dallas-Fort Worth, TX-OK
#18: Fort Collins, CO
#19: San Luis Obispo-Paso Robles, CA
#20: Chico, CA
#21: Reno-Carson City-Fernley, NV
#22: Albuquerque-Santa Fe-Las Vegas, NM
#23: Redding-Red Bluff, CA
#24: Detroit-Warren-Ann Arbor, MI
#25: San Antonio-New Braunfels-Pearsall, TX

WORST CITIES FOR PARTICLE POLLUTION
#1: Bakersfield, CA
#2: Fresno-Madera-Hanford, CA
#2: Visalia, CA
#4: San Jose-San Francisco-Oakland, CA
#5: Los Angeles-Long Beach, CA
#6: Medford-Grants Pass, OR
#7: Fairbanks, AK
#8: Phoenix-Mesa, AZ
#9: Chico, CA
#10: El Centro, CA
#11: Sacramento-Roseville, CA
#12: Cincinnati-Wilmington-Maysville, OH-KY-IN
#13: Indianapolis-Carmel-Muncie, IN
#14: Pittsburgh-New Castle-Weirton, PA-OH-WV
#15: Bend-Prineville, OR
#16: Detroit-Warren-Ann Arbor, MI
#16: Redding-Red Bluff, CA
#18: McAllen-Edinburg, TX
#18: Philadelphia-Reading-Camden, PA-NJ-DE-MD
#18: Eugene-Springfield, OR
#21: Yakima, WA
#22: Chicago-Naperville, IL-IN-WI
#22: Houston-The Woodlands, TX
#24: St. Louis-St. Charles-Farmington, MO-IL
#25: Augusta-Richmond County, GA-SC
#25: Shreveport-Bossier City-Minden, LA