bookmark_borderMethane Emissions Soar to Record High

Methane is one of the most dangerous greenhouse gases… and, is part of an exponential negative feedback loop:
Methane in the atmosphere causes the climate to warm
A warmer climate causes permafrost to melt…
Releasing more methane and CO2…
Making the climate warmer…
Melting more permafrost…
Releasing more methane and CO2…
Melting, more permafrost, etc., etc., etc

“And is there a tipping point that could trigger rapid thaw? Scientists estimate that there is about twice as much carbon stored in permafrost as circulating in the atmosphere. … Once the organic matter within permafrost decomposes and releases CO2 and methane, there is no getting it back,” said Dr Christina Schädel.

In a report for Stanford University, Josie Garthwaite states:

lobal emissions of methane have reached the highest levels on record. Increases are being driven primarily by growth of emissions from coal mining, oil and natural gas production, cattle and sheep ranching, and landfills.

Between 2000 and 2017, levels of the potent greenhouse gas barreled up toward pathways that climate models suggest will lead to 3-4 degrees Celsius of warming before the end of this century. This is a dangerous temperature threshold at which scientists warn that natural disasters, including wildfires, droughts and floods, and social disruptions such as famines and mass migrations become almost commonplace. The findings are outlined in two papers published July 14 in Earth System Science Data and Environmental Research Letters by researchers with the Global Carbon Project, an initiative led by Stanford University scientist Rob Jackson.

Globally, fossil fuel sources and cows are twin engines powering methane’s upward climb. “Emissions from cattle and other ruminants are almost as large as those from the fossil fuel industry for methane,” Jackson said. “People joke about burping cows without realizing how big the source really is.”

Throughout the study period, agriculture accounted for roughly two-thirds of all methane emissions related to human activities; fossil fuels contributed most of the remaining third. However, those two sources have contributed in roughly equal measure to the increases seen since the early 2000s.

Methane emissions from agriculture rose to 227 million tons of methane in 2017, up nearly 11 percent from the 2000–2006 average. Methane from fossil fuel production and use reached 108 million tons in 2017, up nearly 15 percent from the earlier period.

Amid the coronavirus pandemic, carbon emissions plummeted as manufacturing and transportation ground to a halt. “There’s no chance that methane emissions dropped as much as carbon dioxide emissions because of the virus,” Jackson said. “We’re still heating our homes and buildings, and agriculture keeps growing.”

The Human Induced Climate Change Experiment

bookmark_borderClimate Change 2020

Our Infrastructure Is Being Built for a Climate That’s Already Gone
Our drain pipes, reservoirs, power lines, roads, sewage systems, and more are all designed based on past climate data. But with the climate crisis comes the uncomfortable realization that the past can’t predict what we’ll need in the future.
by Shayla Love
Jun 2 2020, 1:05pm

In 1979, the Army Corps of Engineers predicted that by 2014, Optima Lake, in the panhandle of Oklahoma, would have 600,000 visitors a year camping, fishing, boating, and swimming. Instead, the lake sat empty, a dry expanse of land about three miles long. Today, it is still abandoned.

The Optima Lake and Dam was originally intended to control flooding from Beaver Creek and the North Canadian River. After $45 million was spent on its construction, though, the lake never filled up, and it has never reached more than 5 percent of its capacity.

Ed Rossman, a planning branch chief for the Corps of Engineers’ Tulsa District, told a local NPR station in 2013 that the project had been led astray because planners used historical climate data to pick the spot where the dam would be built. That data was wrong by the time construction was completed, and the water no longer flowed there. “We know that the historic record may not be a good snapshot for the future,” Rossman said.

In other parts of the world, the opposite problem has occurred. A flooding barrier put up in the 1990s in the Netherlands to protect Rotterdam will likely fail 25 years sooner than was predicted when it was first built in the 1990s. Replacing the barrier will cost around a billion euros, 10 million of which would be just the cost for taking it down.

The issue here, in its different guises, is one that engineers and city planners continue to face, and which reveals an inherent problem with how we’ve planned, designed, built, and made predictions around all of our infrastructure. At its core, this problem revolves around a concept called stationarity.

The tropics lost 11.9 million hectares (46,000 square miles) of tree cover, the study found, 3.8 million in older, primary forest areas – the third highest loss of primary trees since 2000 and a slight increase on 2018.

“The level of forest loss that we saw in 2019 is unacceptable,” Frances Seymour, from the World Resources Institute, said.

“And one of the reasons that it’s unacceptable is that we actually already know how to turn it around.

“If governments put into place good policies and enforce the law, forest loss goes down.

“But if governments relax restrictions on burning, or [are] signalling that they intend to open up indigenous territories for commercial exploration, forest loss goes up.”


Miami’s fight against rising seas
By Amanda Ruggeri
22nd May 2020

Just down the coast from Donald Trump’s weekend retreat, the residents and businesses of south Florida are experiencing regular episodes of water in the streets. In the battle against rising seas, the region – which has more to lose than almost anywhere else in the world – is becoming ground zero.

Stationarity is the idea that, statistically, the past can help you predict and plan for the future—that the variations in climate, water flow, temperature, and storm severity have remained and will remain stationary, or constant.

Nearly all the infrastructure decisions with which we live have been made with the assumption of stationarity. Engineers make choices about stormwater drainage pipes based on past data of inches of rain. Bridge engineers design foundations that can withstand a certain intensity of water flow based on the severity a certain location has experienced in the past. Reservoirs are designed to hold water based on historical information about water flow, and the historical water needs of a community.


Climate change: older trees loss continue around the world
By Matt McGrath Environment correspondent

In 2019, an area of primary forest the size of a football pitch was lost every six seconds, the University of Maryland study of trees more than 5 metres says.

Brazil accounted for a third of it, its worst loss in 13 years apart from huge spikes in 2016 and 2017 from fires.

However, Indonesia and the Democratic Republic of Congo both managed to reduce tree loss.

Meanwhile, Australia saw a sixfold rise in total tree loss, following dramatic wildfires late in 2019, .

As well as storing massive amounts of carbon, primary, tropical rainforests, where trees can be hundreds or even thousands of years old, are home to species such as orangutans and tigers.

The first time my father’s basement flooded, it was shortly after he moved in. The building was an ocean-front high-rise in a small city north of Miami called Sunny Isles Beach. The marble lobby had a waterfall that never stopped running; crisp-shirted valets parked your car for you. For the residents who lived in the more lavish flats, these cars were often BMWs and Mercedes. But no matter their value, the cars all wound up in the same place: the basement.

When I called, I’d ask my dad how the building was doing. “The basement flooded again a couple weeks ago,” he’d sometimes say. Or: “It’s getting worse.” It’s not only his building: he’s also driven through a foot of water on a main road a couple of towns over and is used to tiptoeing around pools in the local supermarket’s car park.

Ask nearly anyone in the Miami area about flooding and they’ll have an anecdote to share. Many will also tell you that it’s happening more and more frequently. The data backs them up.

It’s easy to think that the only communities suffering from sea level rise are far-flung and remote. And while places like the Solomon Islands and Kiribati are indeed facing particularly dramatic challenges, they aren’t the only ones being forced to grapple with the issue. Sea levels are rising around the world, and in the US, south Florida is ground zero – as much for the adaptation strategies it is attempting as for the risk that it bears.

Florida State Road A1A runs the entire length of Florida along the ocean, making it vulnerable to flooding – as shown here in Fort Lauderdale in 2013 (Credit: Alamy)

Florida State Road A1A runs the entire length of Florida along the ocean, making it vulnerable to flooding – as shown here in Fort Lauderdale in 2013 (Credit: Alamy)

One reason is that water levels here are rising especially quickly. The most frequently-used range of estimates puts the likely range between 15-25cm (6-10in) above 1992 levels by 2030, and 79-155cm (31-61in) by 2100. With tides higher than they have been in decades – and far higher than when this swampy, tropical corner of the US began to be drained and built on a century ago – many of south Florida’s drainage systems and seawalls are no longer enough. That means not only more flooding, but challenges for the infrastructure that residents depend on every day, from septic tanks to wells. “The consequences of sea level rise are going to occur way before the high tide reaches your doorstep,” says William Sweet, an oceanographer at the National Oceanic and Atmospheric Administration (NOAA).

The flooding would be a challenge for any community, but it poses particular risks here. One recent report estimated that Miami has the most to lose in terms of financial assets of any coastal city in the world, just above Guangzhou, China and New York City. This 120-mile (193km) corridor running up the coast from Homestead to Jupiter – taking in major cities like Miami, Fort Lauderdale and West Palm Beach – is the eighth most populous metropolitan area in the US. It’s also booming. In 2015, the US Census Bureau found that the population of all three counties here was growing – along with the rest of Florida – at around 8%, roughly twice the pace of the US average. Recent studies have shown that Florida has more residents at risk from climate change than any other US state.

* extreme weather events
* flood insurance
* feedback loops
* tree deaths and deforestation
* The Human Induced Climate Change Experiment

bookmark_borderNeed to Prepare for Millions of Climate Change Refugees

World needs to prepare for ‘millions’ of climate displaced: U.N.
January 21, 2020

Reuters reported:
DAVOS, Switzerland (Reuters) – The world needs to prepare for millions of people being driven from their homes by the impact of climate change, the United Nations High Commissioner for Refugees.

Speaking to Reuters at the World Economic Forum, Filippo Grandi said a U.N. ruling this week meant those fleeing as a result of climate change deserved international protection, and that it had broad implications for governments.

The U.N. Human Rights Committee made the landmark ruling on Monday in relation to Ioane Teitiota, from the Pacific nation of Kiribati, who brought a case against New Zealand after authorities denied his claim of asylum.

“The ruling says if you have an immediate threat to your life due to climate change, due to the climate emergency, and if you cross the border and go to another country, you should not be sent back, because you would be at risk of your life, just like in a war or in a situation of persecution,” Grandi said.

“We must be prepared for a large surge of people moving against their will,” he said. “I wouldn’t venture to talk about specific numbers, it’s too speculative, but certainly we’re talking about millions here.”

Potential drivers include wildfires like those seen in Australia, rising sea levels affecting low-lying islands, the destruction of crops and livestock in sub-Saharan Africa and floods worldwide, not least in parts of the developed world.

Whereas for most of its 70 years UNHCR, the UN’s refugee agency, has worked to assist those fleeing poorer countries as a result of conflict, climate change is more indiscriminate.

“It is further proof that refugee movements and the broader issue of migration of populations … is a global challenge that cannot be confined to a few countries,” said Grandi.
70 MILLION DISPLACED

Yet the convention relating to the status of refugees, signed in 1951, made no provision for climate change as a reason for people to flee their country and seek asylum elsewhere. As climate impacts grow, legal questions become more complicated.

UNHCR, whose budget has risen from $1 billion a year in the early 1990s to $8.6 billion in 2019 as conflicts in Iraq, Afghanistan and Syria have forced civilians to flee, now assists more than 70 million forcibly displaced people.

Turkey is the largest recipient, with more than 4 million refugees and asylum seekers, the vast majority from Syria. That has strained Turkey’s public finances and led President Tayyip Erdogan to demand more assistance from Europe.

Last November, Erdogan threatened to open the door for Syrian refugees to head to Europe unless the European Union stepped up, and he is now calling for the “resettlement” of up to 1 million Syrians in the north of their homeland.
Slideshow (12 Images)

Grandi said European governments needed to think hard about solutions to the migrant crisis, which has affected them since 2015, but also show more understanding of Turkey’s situation.

“We must recognise that, for the past several years (Turkey)has been hosting the largest refugee population in the world,” he said. “There’s a lot of political talk. I concentrate on the substance of this, which is ‘let’s strengthen Turkey’s ability to host refugees until they can go back safely, voluntarily to their countries’.”

More on Climate Change Refugees

More on Climate Change

bookmark_borderThe True Costs (and Benefitlessness) of a Trump Economy

January 23, 2020

What are the costs and benefits to the United States under a Trump economy?

Financial Analysis: Current State of Affairs
First, start with a financial analysis — a snapshot of the current economic health of the nation. What would a financial analysis that is similar to an individual applying for a bank loan, or a married couple visiting a financial planner for their retirement plan, look like? What are the assets and liabilities? What type of assets and liabilities are in your portfolio? What are your saving patterns? Did you get a large gift from your parents or have you been showing a strong pattern of saving over time? What is your income? Have you made dubious loans to yourself? Where does your income come from? What is your credit history?

A financial analysis of the U.S.A. results in a failing grade.

Impacts of Fiscal and Monetary Policy
After examining the current state of affairs, examine the fiscal policies of the Executive Branch and the monetary policies pushed onto the Federal Reserve. The Trump administration has taken extremely negative positions with free-trade, as well as, jeopardized the standing of the world reserve currency.

Tariffs
The Trump administration has destroyed the United States leadership in free-trade. Huge taxes were placed upon the American public through the use of tariffs. The tariffs were put on goods and services from around the world and paid for by the American consumer. The placement of tariffs have circumvented congress’ oversight and consumer protection considerations. Not only do tariffs introduce new taxes on the population, they also destroy trade relationships with other countries. That is to say, tariffs and retaliatory tariffs cause foreign countries to look elsewhere for their imports. For example, China’s retaliatory tariffs on agriculture resulted in China developing new trade partnerships that do not include the USA.

Here is a partial list of Trump Tariffs:
Solar panels: 15 – 30%
Washing machines: 16 – 50%
Steel and aluminum: 10 – 25%
Chinese products: 15 – 50%
South Korean products: 25%

More tariffs were placed on India, Canada, Mexico, the European Union and others.

Tariffs not only have a direct impact on U.S. current affairs, but they will leave everlasting damage.

Inflation
The overall Trump economic policy has put the economy at risk of high inflation and interest rates.

Inflation Update: Immigration and the Wage Inflation Spiral (June 12, 2022)
An important factor in the 2022 record inflation situation can be traced back to the Trump immigration policy.

The US has stagnant population growth (as does the UK, EU, etc. Japan has a declining population.)

During the Trump administration, the US drastically curtailed immigration. The Biden administration continues to do so today.

The result has been wage inflation. The wage inflation that started in 2018 began the overall inflation spiral that continues today. A wage inflation spiral happens when the initial wage inflation is canceled out by the price inflation requiring further wage inflation to keep up with the price inflation… the increase prices require more wage inflation for employees to keep pace with the cost of living… the subsequent rise in wages results in the need to raise prices to pay the workers… and round and round we go.

The solutions are to either increase our population (through immigration) and/or increase our productivity by eliminating the need for humans.

How the Inflation Spiral Started: Immigration
The Trump administration’s policy on immigration and building The Wall have a devastating impact on the economy. The U.S. economy is a capitalistic system based on population growth. The birth rate in America is close to zero percent. In order to maintain the standard of living, the country needs to gain millions of people through immigration. The Trump policies have attempted to eliminate immigration.
— Daniel Brouse (2020)

* “Over the course of four years, the Trump administration set an unprecedented pace for executive action on immigration, enacting 472 administrative changes that dismantled and reconstructed many elements of the U.S. immigration system. Humanitarian protections were severely diminished. The U.S.-Mexico border became more closed off. Immigration enforcement appeared more random. And legal immigration became out of reach for many. All of this was accomplished nearly exclusively by the executive branch, with sweeping presidential proclamations and executive orders, departmental policy guidance, and hundreds of small, technical adjustments.” — Migration Policy Institute’s Four Years of Profound Change (2022>

* “After years of wage stagnation, we are finally seeing rising wages,” Donald Trump (State of the Union 2018)
“The Employment Cost Index, a measure of salary and benefit costs, registered a 2.6 percent gain for the full year, tied for the best since 2007.” — CNBC (January 31, 2018)

* From December of 2020 through January of 2022, nominal wages and salaries were up 4.5 percent, the fastest increase since 1983. — Bureau of Labor Statistics (BLS)

World Reserve Currency
“A nation that prints its own currency, and that currency is the world reserve currency, is not threatened by deficits. Until that currency stops being the reserve currency,” said Sidd Mukherjee.

The U.S. dollar as the world reserve currency has given the United States an unfair economic advantage. The U.S. has been able to “print” and borrow money in ways that break the rules of economics; however, the Trump administration has jeopardized the standing of the dollar as the world reserve currency.

The major economic powers of the world entered into a nuclear arms deal with Iran called the Joint Comprehensive Plan of Action (JCPOA). In October of 2017, Trump began pulling out of the agreement. On May 8, 2018, Trump announced the United States withdrawal from JCPOA and declared economic warfare on Iran. The warfare included “tough new sanctions” on Iran. The other countries to the treaty attempted to maintain the JCPOA by developing a new system to by-pass the world reserve currency.

Germany, France and Britain officially set up a European mechanism to facilitate non-dollar trade with Iran, the Instrument in Support of Trade Exchanges (Instex). Russia and other countries have since joined Instex.

Risk Management
The future of the nation is dependent on current risk management. “On the High Risk List; the fragmentation, overlap, and duplication annual report; natural disasters and climate change; and other topics,” reports the General Accounting Office of the USA. Pollution, in particular air pollution, is also a substantial risk. CO2, methane and other greenhouse gases have all increased under the Trump plan. Trump has withdrawn from the Paris Agreement and has consistently called climate change a hoax.

It’s never a good idea to say “never”… but, risk-management-denial always increases the probability of a worse case scenario.

Not only is our nation’s current cash-flow severely hemorrhaging due to extreme weather events (and other costs associated with climate change), but this is just the tip of the iceberg. Climate change denial is risk-management-denial.

Pollution and Climate Change Costs Unsustainable

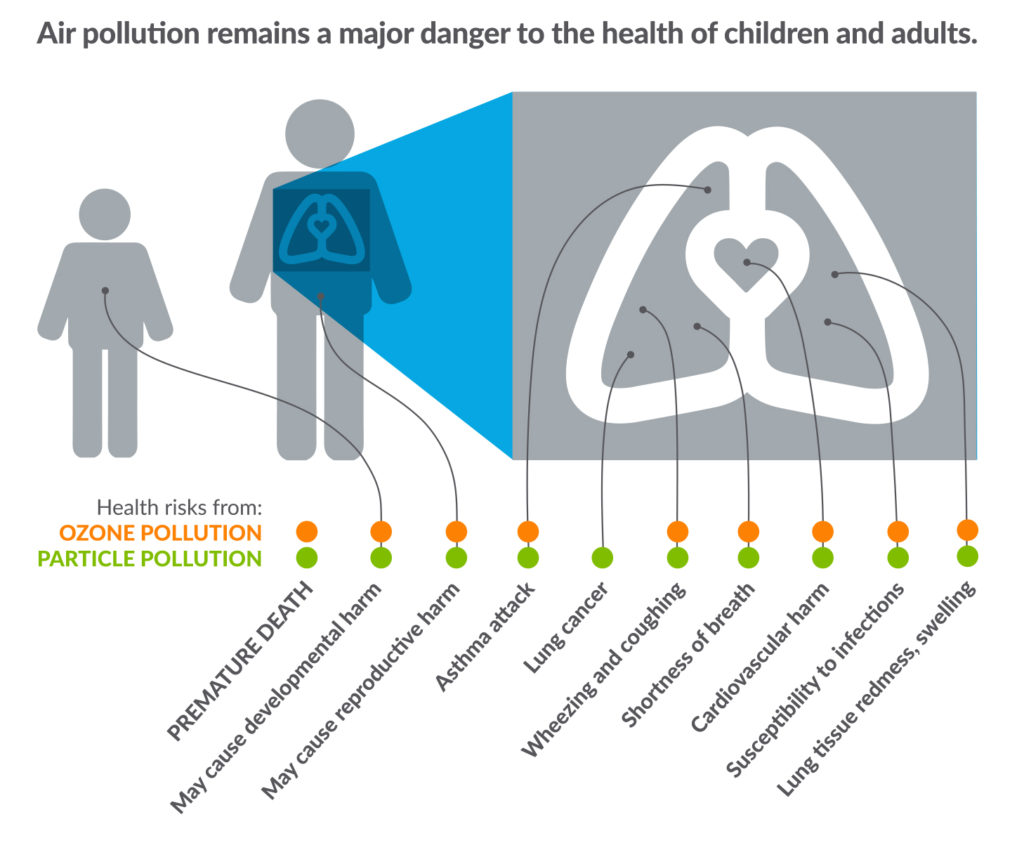
Trump recently stated, “We have the cleanest air.” This is a boldfaced lie. Air pollution in the form of particulates and ozone are a severe health emergency in the United States.

“According to a 2009 report, around ’60 percent of Americans live in areas where air pollution has reached unhealthy levels that can make people sick.’ Air pollution can cause a variety of health problems including, but not limited to infections, behavioral changes, cancer, organ failure, and even premature death.” (Wikipedia) Air pollution is the number one cause of illness in the world and the second leading cause of death. The cost of air pollution can not be contained by one country — pollution knows no borders. It is estimated 8 million people a year die from air pollution.

A report by Stanford and Carnegie Mellon University states, “Air pollution negatively impacts the U.S. economy, costing the U.S. roughly 5 percent of its yearly gross domestic product (GDP) in damages ($790 billion in 2014). The highest costs come from early deaths, attributable to exposure to fine particulate matter (PM2.5).” The number had been falling up to 2016, but Trump has dramatically undermined clean air laws. As of December 2019, Trump had rolled back 95 environmental protection laws.

Air pollution also contributes to the climate change crisis, and in an exponential feedback loop, climate change contributes to air pollution. For instance, the wildfires in California and Australia were made more severe due to human induced climate change. The wildfires resulted in air pollution that costs billions of dollars in damages, illness and death. The wildfires also contributed to greenhouse gases and climate change that will result in more wildfires.

Though a huge cost, the climate change / air pollution feedback loop is just a small cost of climate change. Not only has the Trump administration not properly assessed the risk of climate change, the administration has undermined efforts to mitigate climate change. Even more brazen, the administration has enacted policies that hasten the devastation of global warming.

The costs of climate change are huge. The Hamilton Project and the Stanford Institute for Economic Policy Research reports, “Damages to the U.S. economy grow with temperature change at an increasing rate.” The Washington Post reports, “Climate change could cost the U.S. economy up to 10.5% of GDP by 2100.” The cost of not adapting to climate change will likely cripple the American economy.

The current costs, the costs of not adapting, and the costs of not preventing climate change are overwhelming to calculate. Take flood insurance as an example. Sea level rise and extreme weather events have redrawn floodmaps and bankrupted the National Flood Insurance Program. What flood insurance that is still available has started a series of exponential increases in premiums. Real estate along the coasts and flood prone areas will become worthless in the coming years.

The other costs associated with the Trump administration’s climate change policy is too long to list.  Fossil fuel elimination and climate change mitigation our essential for risk management.

Immigration and the Acquisition Of Private Property
The Trump administration’s policy on immigration and building The Wall have a devastating impact on the economy. First, the U.S. economy is a capitalistic system based on population growth. The birth rate in America is close to zero percent. In order to maintain the standard of living, the country needs to gain millions of people through immigration. The Trump policies have attempted to eliminate immigration.

Also of a long-term negative impact is the building of The Wall. Funds to build the wall were diverted against the will of congress. The funds were then used to seize private land. The land seizures and The Wall have had a major impact on nature preserves and indigenous sacred grounds. Just as detrimental are the eminent domain acquisitions of individuals’ land. Socialization of private property is an attack on the economic system. The costs to the economy and freedom are not quantifiable.

Income Inequality
The Trump administration’s policies have widened the economic divide and income inequality in the United States.  Trump said, “inequality is down.” The next day federal data was released and the Washington Post reported, “The separation between rich and poor from 2017 and 2018 was greater than it has ever been.”

“Wages are up, and inequality is down. Something that people don’t like writing about.” Trump said during a press conference following the United Nations General Assembly meeting in New York. Again, this is not true. The Economic Policy Institute reports, “Slow wage growth is a key sign of how far the U.S. economy remains from a full recovery. Nominal wage growth since the recovery officially began in mid-2009 has been low and flat.”

BENEFITS
There have not been any real benefits from Trump policies. Some people try to point to employment and tax cuts.

Employment
Employment and unemployment numbers became irrelevant as an economic indicator in the 1990’s. The internet and the worldwide web transformed the definition of employment. In addition, you would need to deduct all the jobs lost through the elimination of most temporary work visas. Many of these jobs have not been filled, especially in agriculture, horticulture and hospitality. Billions of dollars in wages and taxes have been eliminated through the Trump immigration policy. These numbers are not included in employment figures.

During the fourth quarter of 2016, 7.6 million people were unemployed. At the end of 2018, 9.0 million people remained unemployed. Yet, Trump claims to have created 5 million new jobs. Do the math.

In January 2020, Trump boasted at a campaign rally in Wildwood, NJ that “factory jobs were the best ever in the history of the United States.” Reuters reported, U.S. factory sector in deepest slump in more than 10 years. “The U.S. manufacturing sector fell into its deepest slump in more than a decade in December as the U.S.-China trade war kept a lid on factory output, orders and employment…. The Institute for Supply Management (ISM) said its index of national factory activity fell to 47.2 last month from 48.1 in November. It was the lowest reading since June 2009 and, coupled with readings for both new orders and factory employment at multi-year lows, thwarted expectations for a leveling off in the pace of decline in a sector buffeted by trade tensions. ”

Tax Cuts
The only beneficial tax cut that has been made by the administration was to lower corporate taxes. Corporate profits are already taxed as income to shareholders. The corporate tax is double taxation. A fair tax policy would not have corporate taxation. However, the other Trump trade and tax policies’ negative impacts far outweigh the positive impact of a reduction in corporate tax rates.

But, What About Obama?
Obama increased the national debt by about $1 trillion/year. Trump is increasing the national debt by about $1 trillion/year. What makes Trump worse than Obama — Trump is suppose to be a fiscally conservative Republican. Obama wasn’t suppose to be. So, for that reason, Trump’s deceit makes it worse than Obama. Trump is not stopping the problem. Worse yet, he is contributing to the problem at the same rate as Obama, as well as, putting the future economy at risk through bad trade and environmental policies. Trump is trying to con the American public into a false narrative on the economy.  In fact, this is not “the best economy ever. Rather, it is the worst economy ever.

Morning Brew reported, U.S. Budget Deficit to Exceed $1 Trillion in 2020. “The U.S. budget deficit will top $1 trillion this year, according to a new report from the nonpartisan Congressional Budget Office (CBO). What that means: The government will spend $1.02 trillion more than it collects in 2020. The widening deficit is a result of the 2017 tax cuts and an increase in spending on federal programs.”

By 2020, the debt to GDP ratio hit its highest level ever at 125%.

Conclusion
The national debt is unsustainable. The debt, risk-management-denial, deceit, nationalism, and greed will sink our ship.


ABOUT THE AUTHOR
The responsibility an economist accepts is to determine the “costs and benefits of our actions on society.” Then, attempt to convert the difference into dollars. Is economics opinion? That depends on your value of the costs and benefits of your actions on society.
bookmark_borderThe Horror World will Face from Climate Change

, explains:

“I said it was the new normal a few years ago,’’ Brown said in an exclusive interview with POLITICO. “This is serious …. but this is only the beginning. This is only a taste of the horror and the terror that will occur in decades.’’

“And it will occur in various spots: in America, in Africa, in Canada,’’ said Brown, who will travel to Washington this week to speak on climate change issues. “It’s unpredictable, other than the fact that it will get worse in present trajectory. Washington, under Trump, is doing very little — and even the Congress has been unable to mobilize under Washington.’’

“It’s a real threat, but it has to be managed. This is the world we live in. And it will get more dangerous.”

bookmark_borderPollution Kills

by Daniel Brouse and Sidd Mukherjee

Pollution will kill you. Usually, it is a slow, painful death.

For the last 20 years, the American Lung Association has analyzed data from official air quality monitors to compile the “State of the Air” report. The most recent report found the United States recorded more days with hazardous air quality than ever. “Hazardous” as air that reaches “emergency conditions” on the government’s air quality index. “More than 4 in 10 people live where pollution levels are too often dangerous to breathe.”

Philadelphia-Reading-Camden, PA-NJ-DE-MD rank as the 21st worst city for ozone and the 18th worst for “Year Round Particle Pollution”. Pittsburgh-New Castle-Weirton, PA-OH-WV ranked 7th worst for year round particle pollution. Lancaster, PA ranked 15th worst for particle pollution.

“Two types of air pollution dominate in the U.S.: ozone and particle pollution1. These two pollutants threaten the health and the lives of millions of Americans. Thanks to the Clean Air Act, the U.S. has far less of both pollutants now than in the past. Still, nearly 141.1 million people live in counties where monitors show unhealthy levels of one or both—meaning the air a family breathes could shorten life or cause lung cancer and other harmful effects. It may be hard to imagine that pollution could be invisible, but ozone is. It is currently one of the least-well-controlled pollutants in the United States. And, it is also one of the most dangerous” the Association reports.

Air Pollution, Health and Wellness

The Institute of Health Metrics and Evaluation at the University of Washington that 5 million deaths per year could be attributed to stroke, heat attack, diabetes, lung cancer and chronic lung disease that resulted from air pollution.

The journal Lancet Planetary Health found air pollution is linked to diabetes.

The National Academy of Sciences published a study that found a significant impact from exposure to air pollution on cognitive performance.

“Today it feels like the future of our kids and our country is at stake,” said former Obama EPA chief Gina McCarthy, now director of the Center for Climate, Health and the Global Environment at the Harvard School of Public Health. “We do not have the cleanest air and we have not crossed the finish line when it comes to pollution.”

Vote for parks. Trees and plants help abate pollution.
If you can, move away from the traffic.
Consider wearing masks.

bookmark_borderClimate Change: Suspension Of Belief

by Daniel Brouse

In the 1990’s, a team of real estate professionals, property management specialists, and climate change scientists starting working on a plan to mitigate the effects of global warming on residential real estate.

There are two major problems with developing a plan:
1) Unintended Consequences
The impact of climate change is wide reaching and compounded by feedback loops. For instance, it is easy to forecast rising sea levels will impact coastal communities; however, it is less obvious that wildfires in California will render the air quality unfit for breathing. If coastal homeowners relocate to areas affected by air quality, their pollution will only exacerbate the air quality and wildfire problems.

2) Suspension Of Belief
People don’t want to believe climate change will ruin their lives. Because they don’t want to believe it, they do not prepare nor take action to prevent global warming. The result is — by the time people believe it, their property has become a liability instead of an asset. How can you sell your property at a loss and afford to move? The answer is you cannot. Instead, you will become a climate refugee.

Florida could be the “wake-up call” for the U.S. population. In 2017, Zillow published a research report entitled, “Climate Change and Housing: Will a Rising Tide Sink All Homes?“. The report forecasts that by 2100, “one in eight Florida homes would be under water.” There are already people who can not afford to pay taxes on submerged land where they can no longer live.

The most immediate threat to property values is flood insurance. Did you know flood insurance and flood insurance risk has been a burden on the federal government since 1950? Flood insurance has become an unsustainable FEMA program. Many of the private partners of the program, such as State Farm and Nationwide, have stopped underwriting flood insurance policies. The National Flood Insurance Program was $24 billion in debt at the beginning of 2014. According to the National Flood Insurance Program (NFIP) Borrowing Authority, “On September 22, 2017, FEMA borrowed the remaining $5.825 billion from the Treasury, reaching the NFIP’s authorized borrowing limit of $30.425 billion. On October 26, 2017, $16 billion of NFIP debt was cancelled to make it possible for the program to pay claims for Hurricanes Harvey, Irma, and Maria.”

NFIP offers two types of coverage for homeowners: building property coverage up to $250,000 and contents coverage up to $100,000. Many people in Florida have already found out their flood insurance didn’t cover their losses. Now, many are finding they can not obtain any insurance.

Rob DePiazza, a St. Augustine artist, is re-building his home out of shipping containers after Hurricane Irma destroyed his property. He said, “We actually stayed in the house for Irma because I felt comfortable with the tree not coming down, and then, at like five in the morning, it fell. My biggest problem was insurance. I didn’t have enough coverage because the thing that you don’t anticipate is when you have storms like two hurricanes back to back. Make sure your insurance is up-to-date and enough to cover rebuilding in this kind of climate.” Now, he is unable to obtain any insurance.

If a property is uninsurable, it is likely worthless.

More About Flood Insurance

bookmark_borderThe Collapse Of Nature

Worldwide insect populations are in decline by as much as 80%. Insects are in a downward spiral threatening a “catastrophic collapse of nature’s ecosystems”, as reported by a global scientific review.

“Unless we change our ways of producing food, insects as a whole will go down the path of extinction in a few decades. The repercussions this will have for the planet’s ecosystems are catastrophic to say the least.”

The review was published in the journal Science Direct is entitled, “Worldwide decline of the entomofauna: A review of its drivers” by Francisco Sánchez-Bayo, Kris A.G.Wyckhuys, etal.

Highlights

• Over 40% of insect species are threatened with extinction.
• Lepidoptera, Hymenoptera and dung beetles (Coleoptera) are the taxa most affected.
• Four aquatic taxa are imperiled and have already lost a large proportion of species.
• Habitat loss by conversion to intensive agriculture is the main driver of the declines.
• Agro-chemical pollutants, invasive species and climate change are additional causes.

“If insect species losses cannot be halted, this will have catastrophic consequences for both the planet’s ecosystems and for the survival of mankind,” said Francisco Sánchez-Bayo.

“The main cause of the decline is agricultural intensification,” Sánchez-Bayo said. “That means the elimination of all trees and shrubs that normally surround the fields, so there are plain, bare fields that are treated with synthetic fertilisers and pesticides.”The demise of insects appears to have started at the beginning of the 20th century, accelerated during the 1950’s and 1960’s and reached “alarming proportions” over the last twenty years.

“If insect species losses cannot be halted, this will have catastrophic consequences for both the planet’s ecosystems and for the survival of mankind”

The Human Induced Climate Change Experiment

bookmark_borderTurn out the lights… the fossil fuel party’s over.

October 15, 2018:
To: Sidd
RE: Energy and Climate Change
I’ve been thinking about a famous Sidd quote… and wonder if it still holds true?

Back in the day (2001), you recommended one of the best things to do was to turn off the lights!
“Turn out the lights… the fossil fuel party’s over.”
http://membrane.com/oil/

Since that time, some things have changed… sort-of… and I wonder if your thoughts have changed?

1) there is some evidence that light may be beneficial to plants and humans (perhaps other animals, too) … such as, sleep cycle, jet lag, depression, light effects on circadian rhythm, etc.

2) LED, compact fluorescent bulbs, etc. appear to be much less energy intense.

Is it ok to leave on some lights now?

Sidd replied:
heeehee, ya LED is much more energy efficient … but the light it provides is far from daylight. Nevertheless, LED electric consumption is much better.

But best of all is to frolic in the light of the sun.

Next turn off the AC and the heat. Deep eaves for shade and deciduous trees that shed their leaves in winter. And insulation, lots and lots of insulation.

The party’s definitely over tho. Hangover is gonna get worse.

sidd

The Human Induced Climate Change Experiment

bookmark_borderExtreme Weather Events Getting More Extreme

The U.N. has released a report entitled, “Extreme Weather Continues in 2018 – a Continuing Call to Climate Action”.

Addressing the dangers associated with extreme weather conditions, the Executive Secretary of the UN Climate Change Patricia Espinosa said: “We must keep an eye on the future. As the superstorms and monsoon flooding of last year and the extreme heat and extreme cold of this year show – we still have a long way to go to deliver on the promise of the Paris Climate Change Agreement”.

This year, record warmth was observed across parts of North America, Europe and Asia, as well as the Atlantic, Pacific and Indian Oceans. Record cold May temperatures were limited to northeastern Canada and the northern Atlantic Ocean, off the southern coast of Greenland.

The study published in the journal Nature showed that ice losses from Antarctica are causing sea levels to rise faster today than at any time in the past 25 years. Results of the Ice Sheet Mass Balance Inter-Comparison Exercise (IMBIE).

According to NASA, “Antarctica’s potential contribution to global sea level rise from its land-held ice is almost 7.5 times greater than all other sources of land-held ice in the world combined. The continent stores enough frozen water to raise global sea levels by 190 feet (58 meters), if it were to melt entirely. Knowing how much ice it’s losing is key to understanding the impacts of climate change now and its pace in the future.”

NOAA points to climate change as part of the problem causing the largest wildfires in California.

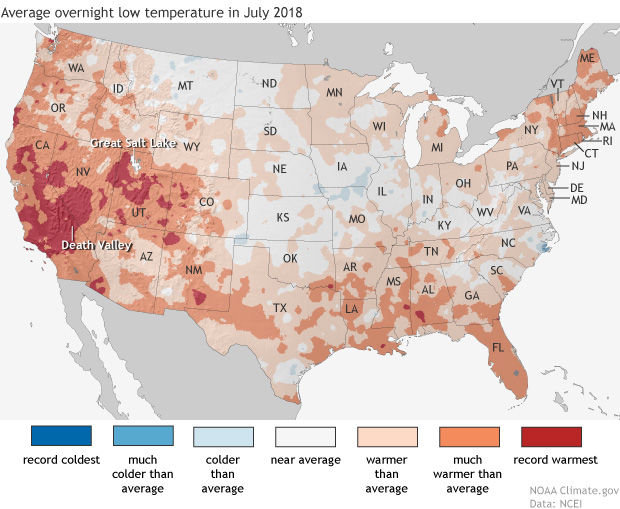
Daytime high temperatures were well above average across much of the western United States in July, but it was overnight low temperatures that were really extreme in large areas of California—where firefighters are battling multiple wildfires—and the Great Basin, and in isolated pockets of Colorado and the Southwest.

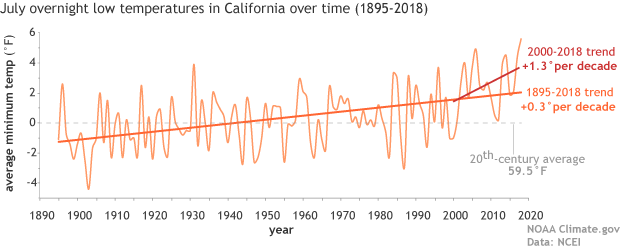
Map of the contiguous United States showing July 2018 overnight low temperature ranksAs the NCEI’s Deke Arndt has blogged about before, nighttime low temperatures are increasing faster than daytime high temperatures across most of the contiguous United States. For much of the West and Southwest, July’s record-breaking nighttime heat is a new highpoint in a long-term trend—one that has rapidly accelerated in recent decades. In California, average overnight low temperature in July rose by 0.3°F per decade over the historical record (1895-2018), but since 2000, the pace of warming has accelerated to 1.3°F per decade.

graph of July minimum temperature 1895–2018 with long-term trend and trend since 2000 shown

Average July minimum temperatures (overnight lows) in California  (light orange line) from 1895–2018. The trend over the historical record is shown in dark orange, and the recent trend (2000-2018) is shown in red. The twentieth-century average is shown with a gray line. NOAA Climate.gov graph, based on data from NCEI’s Climate at a Glance.

According to Tim Brown, director of NOAA’s Western Region Climate Center (WRCC), it’s a pattern that has serious consequences for wildfires and those who combat them. When temperatures cool off overnight, it’s not just a physical relief for firefighters who may be working in conditions that push the limits of human endurance; fire behavior itself relaxes as temperatures drop, winds grow calmer, and relative humidity rises. He explained via email,

Moisture in dead vegetation continuously tries to reach equilibrium with atmospheric moisture. So if nighttime temperature is staying warmer, then the humidity is lower, and the fuels stay drier. A dead fuel moisture reduction of a few percent can increase flammability, flame length, and subsequent overall fire behavior.

When fires remain active at night, it can increase both the time to containment and total burned area, while also affecting public health and safety through more smoke production and lower air quality.  Brown says that qualitatively, there seems to be an increase in firefighters’ reports of active nighttime fire behavior since around 2000.  He and other researchers are currently investigating whether that relationship can be confirmed quantitatively.

satellite image of fires and smoke near Clear Lake, California on August 6, 2018

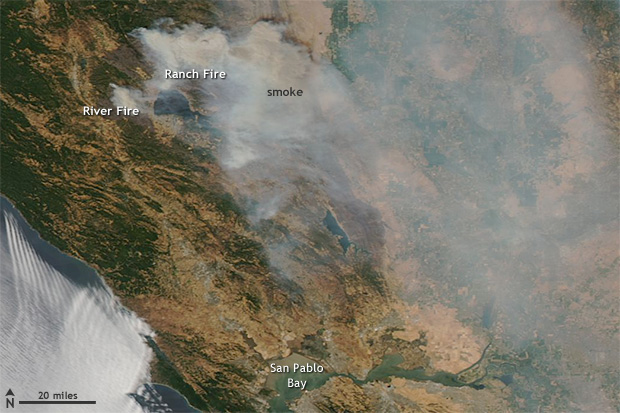
NASA Aqua satellite image of the Ranch and River Fires in Northern California on August 6, 2018, with a pall of smoke spreading to the east.  These fires are part of the Mendocino Complex  Fire, which has become the largest fire in California history.  Extreme fire activity in the state was exacerbated by record-warm overnight low temperatures in July. Image from NASA Worldview website.

Nighttime warming has consequences for other aspects of public health. WRCC climatologist Nina Oakley pointed out via email that the South Coast region of California is experiencing the largest warming trends in nighttime temperatures, according to an environmental health hazard report from the California Environmental Protection Agency. In many communities in the region, air conditioning—rarely needed in the past—is uncommon. In addition, since 2000, heat waves in California have become more humid. In the report, experts offered a warning about the change:

People, animals, and plants that are adapted to California’s traditionally dry daytime heat and nighttime cooling are unable to recover from extreme heat, especially when humidity is high at night. The increase in nighttime heat waves presents an additional risk factor for vulnerable populations.

The rapid increase in the rate of warming in California and other parts of the U.S. West since the start of the new century is a sharp reminder that we can’t necessarily count on the future changing as slowly as the past. Asked about the July nighttime heat in California, California state climatologist Mike Anderson answered via email, “As for the past decade or two, we have noticed observations have looked different than the rest of the historical record. We are consistently sampling at the warm edge of the historical distribution now, and expectations are for that to continue, with new records being set with increasing frequency in the coming years.”

Parts of Pennsylvania recorded record rainfall during the summer of 2018 with frequent “tropical downpours” delivering thirteen or more inches of rain in a 5 day period. The Penn Environment Organization released a report entitled, “Hitting Close to Home | Global Warming is Fueling Extreme Weather Across the U.S.”

Weather-related disasters affect millions

  • Since September 2010, counties housing 84 percent of the total Pennsylvania population (over 10 million residents) were affected by federally-declared weather disasters.
  • Pennsylvania experienced five weather-related disasters, including severe storms, tornadoes, floods, and tropical storms since September 2010.

Extreme weather causes widespread destruction

  • In February 2015 a large winter storm and associated cold wave impacted many central, eastern and northeastern states, including Pennsylvania. The storm and cold wave caused at least 30 deaths and the total estimated costs were over $1 billion in the affected region.
  • In October 2012 Hurricane Sandy caused extensive damage to several states, including Pennsylvania from wind, rain, and heavy snow. Hurricane Sandy caused at least 159 deaths and the total estimated costs were $67.6 billion in the affected regions.
  • Since 2010, extreme weather events have caused at least 30 power outages in Pennsylvania, including one outage that lasted 10 days in 2012 during Hurricane Sandy. [3]


Weather extremes are becoming more common 

Globally, 2015 was Earth’s hottest year on record, surpassing 2014. [4] Many types of extreme weather are expected to become more frequent or severe in a warming world, which could lead to more weather-related disasters.

  • Tropical Storms and Hurricanes: Global warming has the potential to make tropical storms more destructive. Hurricanes and other coastal storms are likely to be more powerful [5] and rainier, [6] while storm surges could be more destructive as sea levels rise. [7]
  • Heavy Rain and Snow: Extreme precipitation is already increasing; continued trends could increase the risk of intense downpours, heavy snowstorms and severe flooding. [8]
  • Droughts and Wildfires: While global warming is anticipated to bring more rain to some areas, it will also likely elevate temperatures and extend dry spells. The potential for stronger drought—and greater area burned by wildfires—will increase, particularly in the West and Southwest.

Every year the World Economic Forum publishes the Global Risks Report. This year’s report suggests that experts anticipate another year of heightened risk. From the approximately 1000 respondents of the annual Global Risks Perception Survey, 59% expect an intensified risk, compared to 7% pointing to declining risks.

Environmental risks have grown in prominence over the 13-year history of the Global Risks Report. This trend continues in the 2018 report. All five risks in the environmental category are ranked higher than average in both likelihood and impact over a 10-year horizon.

“Extreme weather events” and “Natural disasters” rank among the top three risks in terms of likelihood and impact. “Failure of climate-change mitigation and adaptation” ranks among the top five.


The Human Induced Climate Change Experiment (Global Warming Research and Educational Materials)