By Daniel Brouse, scientist and statistician
July 7, 2020
The Mortality Rate for COVID-19 in the State of Pennyslvania is 13.68%.
I grew weary of people trying to argue the mortality rate in the state of PA. I was being conservative and lazy… estimating it around 7.5% (deaths / cases = mortality rate). The science deniers were still telling me it is no worse than the flu. So, this is what I had to do.
I contacted the State of Pennsylvania and asked:
Can you tell me how PA is counting “cases” — 91,299 cases. Technically, traditionally… the mortality rate = deaths / cases.
A case: symptomatic individual that presents themselves to a healthcare facility/hospital. I can not find a definition of a “COVID case” on the PA website. It looks like we are counting all the asymptomatic people that are being tested? That is not how the mortality rate for the flu, nor any other disease, is calculated. Normally, with the flu and all other diseases, the infected are counted as “symptomatic presenting as a case in a healthcare facility.” It is a doctor’s “case”. That is not how the COVID mortality rate is being calculated. This is important because, if we deviate toward counting others as “infected”, we can never get an accurate accounting. We can never know the number of asymptomatic infected. That is why only symptomatic patients are, or should be, counted.
The State replied: “Positive viral lab tests = confirmed cases. They have also included 634 patients in the count who have a positive serology test and either COVID-19 symptoms or a high-risk exposure.”
So, to calculate an accurate mortality rate to compare to a mortality rate for the flu, I need to subtract out how many of the positive tests were from asymptomatic individuals, and then I need to estimate the time from “testing positive” to death.
The second part is easier. Average time from testing to death for most deaths is about 45 days, but some are hospitalized for 100 days after being symptomatic for days (like Nick Cordero at age 41). In an effort to pacify the conservatives, I’ll go with around 45 days.
45 days ago there was a total of 62,000 people testing positive.
Now, I’ll be even more conservative and say 80% of those tested were symptomatic.
62,000 x .8 = 49,600
The reported deaths as of today is 6,787.
6,787 deaths / 49,600 cases = 13.68% mortality rate for COVID-19 in the state of PA on 7/7/2020
The mortality rate for COIVD is between 7-8% in PA. (* The actual mortality rate is closer to 14%) It has been since the pandemic started, and still is. An estimated additional 15% of the recovered have permanent disabilities. What is the cost of life and health on the economy? The benefit-cost analysis of a human life is generally accepted as US$10 million/dead person. [It is also referred to as the cost of life, value of preventing a fatality (VPF) and implied cost of averting a fatality (ICAF).]
But, what is the cost of lifelong disability? (COD/cost of a disability) That cost is much more difficult to calculate. How much does it cost to keep me alive? How much pain and suffering must I endure? And, how widely does the cost vary from disability to disability? If I need O2 the rest of my life… or if my leg is amputated… or neurological damage, etc.?
So, if the economy benefits by X amount by reopening early… what is the offsetting cost (X-VPF-COD)?
It seems to me this is a no-brainer. Without a doubt, it will be a negative number: X < VPF+COD
Answer: Stop the spread. Stop the dead. Make the bread.
Nature Accelerated Article Preview
The effect of large-scale anti-contagion-policies on the COVID-19 pandemic
Governments around the world are responding to the novel coronavirus (COVID-19) pandemic1 with unprecedented policies designed to slow the growth rate of infections. Many actions, such as closing schools and restricting populations to their homes, impose large and visible costs on society, but their benefits cannot be directly observed and are currently understood only through process-based simulations2–4. Here, we compile new data on 1,717 local, regional, and national non-pharmaceutical interventions deployed in the ongoing pandemic across localities in China, South Korea, Italy, Iran, France, and the United States (US). We then apply reduced-form econometric methods, commonly used to measure the effect of policies on economic growth5,6, to empirically evaluate the effect that these anti-contagion policies have had on the growth rate of infections. In the absence of policy actions, we estimate that early infections of COVID-19 exhibit exponential growth rates of roughly 38% per day. We find that anti-contagion policies have significantly and substantially slowed this growth. Some policies have different impacts on different populations, but we obtain consistent evidence that the policy packages now deployed are achieving large, beneficial, and measurable health outcomes. We estimate that across these six countries, interventions prevented or delayed on the order of 62 million confirmed cases, corresponding to averting roughly 530 million total infections. These findings may help inform whether or when these policies should be deployed, intensified, or lifted, and they can support decision-making in the other 180+ countries where COVID-19 has been reported7.
Our Infrastructure Is Being Built for a Climate That’s Already Gone
Our drain pipes, reservoirs, power lines, roads, sewage systems, and more are all designed based on past climate data. But with the climate crisis comes the uncomfortable realization that the past can’t predict what we’ll need in the future.
by Shayla Love
Jun 2 2020, 1:05pm
In 1979, the Army Corps of Engineers predicted that by 2014, Optima Lake, in the panhandle of Oklahoma, would have 600,000 visitors a year camping, fishing, boating, and swimming. Instead, the lake sat empty, a dry expanse of land about three miles long. Today, it is still abandoned.
The Optima Lake and Dam was originally intended to control flooding from Beaver Creek and the North Canadian River. After $45 million was spent on its construction, though, the lake never filled up, and it has never reached more than 5 percent of its capacity.
Ed Rossman, a planning branch chief for the Corps of Engineers’ Tulsa District, told a local NPR station in 2013 that the project had been led astray because planners used historical climate data to pick the spot where the dam would be built. That data was wrong by the time construction was completed, and the water no longer flowed there. “We know that the historic record may not be a good snapshot for the future,” Rossman said.
In other parts of the world, the opposite problem has occurred. A flooding barrier put up in the 1990s in the Netherlands to protect Rotterdam will likely fail 25 years sooner than was predicted when it was first built in the 1990s. Replacing the barrier will cost around a billion euros, 10 million of which would be just the cost for taking it down.
The issue here, in its different guises, is one that engineers and city planners continue to face, and which reveals an inherent problem with how we’ve planned, designed, built, and made predictions around all of our infrastructure. At its core, this problem revolves around a concept called stationarity.
The tropics lost 11.9 million hectares (46,000 square miles) of tree cover, the study found, 3.8 million in older, primary forest areas – the third highest loss of primary trees since 2000 and a slight increase on 2018.
“The level of forest loss that we saw in 2019 is unacceptable,” Frances Seymour, from the World Resources Institute, said.
“And one of the reasons that it’s unacceptable is that we actually already know how to turn it around.
“If governments put into place good policies and enforce the law, forest loss goes down.
“But if governments relax restrictions on burning, or [are] signalling that they intend to open up indigenous territories for commercial exploration, forest loss goes up.”
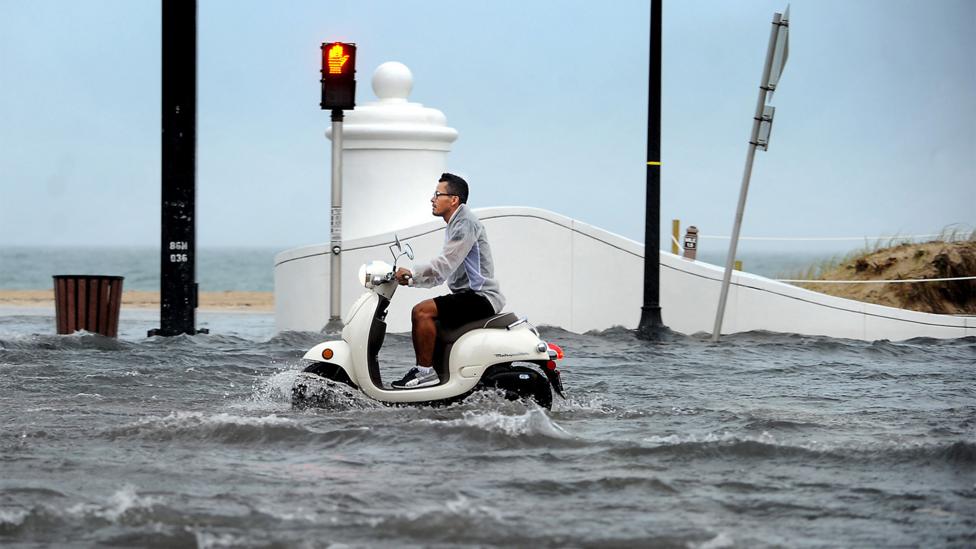
Just down the coast from Donald Trump’s weekend retreat, the residents and businesses of south Florida are experiencing regular episodes of water in the streets. In the battle against rising seas, the region – which has more to lose than almost anywhere else in the world – is becoming ground zero.
Stationarity is the idea that, statistically, the past can help you predict and plan for the future—that the variations in climate, water flow, temperature, and storm severity have remained and will remain stationary, or constant.
Nearly all the infrastructure decisions with which we live have been made with the assumption of stationarity. Engineers make choices about stormwater drainage pipes based on past data of inches of rain. Bridge engineers design foundations that can withstand a certain intensity of water flow based on the severity a certain location has experienced in the past. Reservoirs are designed to hold water based on historical information about water flow, and the historical water needs of a community.
Brazil accounted for a third of it, its worst loss in 13 years apart from huge spikes in 2016 and 2017 from fires.
However, Indonesia and the Democratic Republic of Congo both managed to reduce tree loss.
Meanwhile, Australia saw a sixfold rise in total tree loss, following dramatic wildfires late in 2019, .
As well as storing massive amounts of carbon, primary, tropical rainforests, where trees can be hundreds or even thousands of years old, are home to species such as orangutans and tigers.
The first time my father’s basement flooded, it was shortly after he moved in. The building was an ocean-front high-rise in a small city north of Miami called Sunny Isles Beach. The marble lobby had a waterfall that never stopped running; crisp-shirted valets parked your car for you. For the residents who lived in the more lavish flats, these cars were often BMWs and Mercedes. But no matter their value, the cars all wound up in the same place: the basement.
When I called, I’d ask my dad how the building was doing. “The basement flooded again a couple weeks ago,” he’d sometimes say. Or: “It’s getting worse.” It’s not only his building: he’s also driven through a foot of water on a main road a couple of towns over and is used to tiptoeing around pools in the local supermarket’s car park.
Ask nearly anyone in the Miami area about flooding and they’ll have an anecdote to share. Many will also tell you that it’s happening more and more frequently. The data backs them up.
It’s easy to think that the only communities suffering from sea level rise are far-flung and remote. And while places like the Solomon Islands and Kiribati are indeed facing particularly dramatic challenges, they aren’t the only ones being forced to grapple with the issue. Sea levels are rising around the world, and in the US, south Florida is ground zero – as much for the adaptation strategies it is attempting as for the risk that it bears.
Florida State Road A1A runs the entire length of Florida along the ocean, making it vulnerable to flooding – as shown here in Fort Lauderdale in 2013 (Credit: Alamy)
One reason is that water levels here are rising especially quickly. The most frequently-used range of estimates puts the likely range between 15-25cm (6-10in) above 1992 levels by 2030, and 79-155cm (31-61in) by 2100. With tides higher than they have been in decades – and far higher than when this swampy, tropical corner of the US began to be drained and built on a century ago – many of south Florida’s drainage systems and seawalls are no longer enough. That means not only more flooding, but challenges for the infrastructure that residents depend on every day, from septic tanks to wells. “The consequences of sea level rise are going to occur way before the high tide reaches your doorstep,” says William Sweet, an oceanographer at the National Oceanic and Atmospheric Administration (NOAA).
The flooding would be a challenge for any community, but it poses particular risks here. One recent report estimated that Miami has the most to lose in terms of financial assets of any coastal city in the world, just above Guangzhou, China and New York City. This 120-mile (193km) corridor running up the coast from Homestead to Jupiter – taking in major cities like Miami, Fort Lauderdale and West Palm Beach – is the eighth most populous metropolitan area in the US. It’s also booming. In 2015, the US Census Bureau found that the population of all three counties here was growing – along with the rest of Florida – at around 8%, roughly twice the pace of the US average. Recent studies have shown that Florida has more residents at risk from climate change than any other US state.
by Daniel Brouse
March 25, 2020
Email: help@membrane.com
Abstract: Many compromised respiratory and immune systems are a result of air pollution. COVID-19 is having a larger impact on the population due to underlying compromised respiratory and immune systems caused by air pollution.
Hypothesis:
Large portions of the world are susceptible to particulate and ozone pollution. In this study, the focus is on particulate pollution. Though tropospheric ozone pollution is thought to be more detrimental to the respiratory and immune systems, current technology makes it too difficult to measure. Tropospheric ozone and particulate pollution are common in urban and industrial areas. Ozone is created when the ultraviolet light, temperature, and chemicals in the air create a chemical reaction. The result is millions of micro-explosions in the lungs. Hot summer days are optimal for ozone creation. Particulate pollution is a result of fine particles suspended in the atmosphere. Particulate pollution is easier to be aware of because you can see it as haze or smog in the air. Exposure to ozone and particulate pollution results in permanent lung damage and chronic immune system disorders. Exercising in the out-of-doors during days with high pollution amplifies the damage to the respiratory and immune systems. The larger the pollution intake, the more severe the damage.
Exposure to air pollution and COVID-19 mortality
The Harvard study Fine particulate matter and COVID-19 mortality in the United States found, “A small increase in long-term exposure to PM2.5 leads to a large increase in COVID-19 death rate, with the magnitude of increase 20 times that observed for PM2.5 and all-cause mortality. The study results underscore the importance of continuing to enforce existing air pollution regulations to protect human health both during and after the COVID-19 crisis. The data and code are publicly available.” [1]
A study from Oxford found, “Our results suggest that air pollution is an important cofactor increasing the risk of mortality from COVID-19. This provides extra motivation for combining ambitious policies to reduce air pollution with measures to control the transmission of COVID-19.” [2]
“The study estimated that about 15% of deaths worldwide from COVID-19 could be attributed to long-term exposure to air pollution. In Europe the proportion was about 19%, in North America it was 17%, and in East Asia about 27%,” reports the European Society of Cardiology. [3]
The research showed that airborne pollen on average accounts for 44% of the variation in infection rates in addition to humidity and air temperature. Pollen exposure weakens the immunity by diminishing the antiviral interferon response.
“The presence of wildfire smoke last year during the pandemic may have been responsible for at least 19,000 additional cases of COVID-19 on the West Coast, and 700 subsequent deaths.”
“The year 2020 brought unimaginable challenges in public health, with the confluence of the COVID-19 pandemic and wildfires across the western United States. Wildfires produce high levels of fine particulate matter (PM2.5). Recent studies reported that short-term exposure to PM2.5 is associated with increased risk of COVID-19 cases and deaths. We acquired and linked publicly available daily data on PM2.5, the number of COVID-19 cases and deaths, and other confounders for 92 western U.S. counties that were affected by the 2020 wildfires. We estimated the association between short-term exposure to PM2.5 during the wildfires and the epidemiological dynamics of COVID-19 cases and deaths. We adjusted for several time-varying confounding factors (e.g., weather, seasonality, long-term trends, mobility, and population size). We found strong evidence that wildfires amplified the effect of short-term exposure to PM2.5 on COVID-19 cases and deaths, although with substantial heterogeneity across counties.”
Negative Feedback Loops
Long term exposure to air pollution causes COVID co-morbidities including respiratory disease, cardiovascular disease, and a compromised immune system. Contracting COVID exacerbates the preexisting co-morbidities. Post-COVID exposure to air pollution further compromises the co-morbidities. The negative feedback loop repeats until failure.
* The evidence shows that reinfection further increases risks of death, hospitalization and damage to multiple organ systems
* COVID exacerbates underlying conditions including pulmonary, cardiovascular, hematological, diabetes, gastrointestinal, kidney, mental health, musculoskeletal and neurological disorders
First infection with severe acute respiratory syndrome coronavirus 2 (SARS-CoV-2) is associated with increased risk of acute and postacute death and sequelae in various organ systems. Compared to no reinfection, reinfection contributed additional risks of death, hospitalization, and sequelae including pulmonary, cardiovascular, hematological, diabetes, gastrointestinal, kidney, mental health, musculoskeletal and neurological disorders. The risks were evident regardless of vaccination status. The risks were most pronounced in the acute phase but persisted in the postacute phase at 6 months. Compared to noninfected controls, cumulative risks and burdens of repeat infection increased according to the number of infections. Limitations included a cohort of mostly white males. The evidence shows that reinfection further increases risks of death, hospitalization and sequelae in multiple organ systems in the acute and postacute phase. Reducing overall burden of death and disease due to SARS-CoV-2 will require strategies for reinfection prevention.
Minimize Your Risk
1) Minimize your exposure to air pollution by checking the air quality conditions in your location. (Get air quality data where you live.)
2) People at high risk of COVID mortality due to co-morbidities, such as, aged, obese and type2 diabetics, combined with long term exposure to air pollution should take preventative measures. A deficiency of nicotinamide adenine dinucleotide (NAD+) may be the primary factor related to the SARS-Cov-2 disease spectrum and the risk for mortality, as subclinical nutritional deficiencies may be unmasked by any significant increase in oxidative stress. [4]
Air pollution is responsible for nearly half of all childhood asthma cases in Barcelona, according to research published by the Barcelona Institute of Global Health (ISGlobal).
Asthma is the most common chronic childhood disease, and although it is known to be linked to air pollution, this is the first study to assess the link between asthma and the three pollutants: nitrogen dioxide (NO2), particulate matter (PM2.5) and black carbon (BC).
‘Barcelona urgently needs interventions to reduce the amount of motor-vehicle traffic, which has a negative impact on the health of the city’s children.
‘Reducing traffic does not only reduce air pollution but also reduce noise and heat island effects and increases physical activity which is all beneficial to health.’
“Their results suggest that coastal regions will be far from the only ones affected by sea-level rise. A huge number of counties far from the coast—some deep in the US interior—will see dramatic changes in the number of people relocating there.”
The United States is rich enough, industrialized enough, and far enough from the tropics that the rising temperatures of our changing climate aren’t going to make any place uninhabitable. But a side effect of those rising temperatures—rising oceans—most certainly will. Already, an ever-growing list of places is facing what’s called “nuisance flooding,” in which even a high tide can leave streets underwater. Major storms just make matters worse. And, by the end of this century, the expected rise of the oceans may be over five times what we saw last century.
As a result of this, many areas of the country will simply become uninhabitable, lost to the sea. Well over a third of the United States’ population lives in counties that are currently on the coast, and over 10 million currently live on land that will be lost to a sea-level rise of 1.8 meters. They’ll have to go somewhere—and people who might otherwise move to the coast will have to find some place else to relocate. All of which will change the dynamics of the typical relocation of people within the US.
A new study released in PLOS ONE tries to estimate what that will mean for the rest of the country. Their results suggest that coastal regions will be far from the only ones affected by sea-level rise. A huge number of counties far from the coast—some deep in the US interior—will see dramatic changes in the number of people relocating there.”
PLOS ONE reports, Modeling migration patterns in the USA under sea level rise. “Sea level rise in the United States will lead to large scale migration in the future. We propose a framework to examine future climate migration patterns using models of human migration. Our framework requires that we distinguish between historical versus climate driven migration and recognizes how the impacts of climate change can extend beyond the affected area. We apply our framework to simulate how migration, driven by sea level rise, differs from baseline migration patterns. Specifically, we couple a sea level rise model with a data-driven model of human migration and future population projections, creating a generalized joint model of climate driven migration that can be used to simulate population distributions under potential future sea level rise scenarios. The results of our case study suggest that the effects of sea level rise are pervasive, expanding beyond coastal areas via increased migration, and disproportionately affecting some areas of the United States.”
Flood insurance is obtained through the government’s flood insurance program
Flood insurance does not cover the basement of a house
Flood insurance covers a lifetime maximum of $250,000 in coverage
This means if you make a claim for $150,000 the maximum coverage for the life of the property drops to $100,000.
Reuters reported:
DAVOS, Switzerland (Reuters) – The world needs to prepare for millions of people being driven from their homes by the impact of climate change, the United Nations High Commissioner for Refugees.
Speaking to Reuters at the World Economic Forum, Filippo Grandi said a U.N. ruling this week meant those fleeing as a result of climate change deserved international protection, and that it had broad implications for governments.
The U.N. Human Rights Committee made the landmark ruling on Monday in relation to Ioane Teitiota, from the Pacific nation of Kiribati, who brought a case against New Zealand after authorities denied his claim of asylum.
“The ruling says if you have an immediate threat to your life due to climate change, due to the climate emergency, and if you cross the border and go to another country, you should not be sent back, because you would be at risk of your life, just like in a war or in a situation of persecution,” Grandi said.
“We must be prepared for a large surge of people moving against their will,” he said. “I wouldn’t venture to talk about specific numbers, it’s too speculative, but certainly we’re talking about millions here.”
Potential drivers include wildfires like those seen in Australia, rising sea levels affecting low-lying islands, the destruction of crops and livestock in sub-Saharan Africa and floods worldwide, not least in parts of the developed world.
Whereas for most of its 70 years UNHCR, the UN’s refugee agency, has worked to assist those fleeing poorer countries as a result of conflict, climate change is more indiscriminate.
“It is further proof that refugee movements and the broader issue of migration of populations … is a global challenge that cannot be confined to a few countries,” said Grandi.
70 MILLION DISPLACED
Yet the convention relating to the status of refugees, signed in 1951, made no provision for climate change as a reason for people to flee their country and seek asylum elsewhere. As climate impacts grow, legal questions become more complicated.
UNHCR, whose budget has risen from $1 billion a year in the early 1990s to $8.6 billion in 2019 as conflicts in Iraq, Afghanistan and Syria have forced civilians to flee, now assists more than 70 million forcibly displaced people.
Turkey is the largest recipient, with more than 4 million refugees and asylum seekers, the vast majority from Syria. That has strained Turkey’s public finances and led President Tayyip Erdogan to demand more assistance from Europe.
Last November, Erdogan threatened to open the door for Syrian refugees to head to Europe unless the European Union stepped up, and he is now calling for the “resettlement” of up to 1 million Syrians in the north of their homeland.
Slideshow (12 Images)
Grandi said European governments needed to think hard about solutions to the migrant crisis, which has affected them since 2015, but also show more understanding of Turkey’s situation.
“We must recognise that, for the past several years (Turkey)has been hosting the largest refugee population in the world,” he said. “There’s a lot of political talk. I concentrate on the substance of this, which is ‘let’s strengthen Turkey’s ability to host refugees until they can go back safely, voluntarily to their countries’.”
Q: Is hemp a good solution for carbon sequestration (carbon sinks) and/or beneficial to the environment?
A: No, not really. In general, hemp only acts as a carbon sink while it is growing and left unharvested. The harvesting usually negates any net-negative carbon sink. (ie more CO2 is released in the harvesting than is being sequestered.) In addition, production of oil, pulp, fibers, or other products usually results in a large carbon footprint. Hemp is not known to be more efficient in the production of anything. It’s also important to note, plant based oils and alcohols result in more low level ozone than petroleum, not to mention, any carbon that is combusted is converted to CO2. Ozone is killing many trees and humans (Death By Ozone, 2016).
Q: Remember the awful hole in the ozone layer in the 80-90’s? Don’t we want more ozone?
A: No. Ozone is a volatile gas and changes form rapidly. In general, there are 2 types of ozone — Tropospheric and Stratospheric. Tropospheric is low level ozone and deadly to life on earth. Stratospheric is in the upper level atmosphere (stratosphere) that protects life on earth (The Ozone Know Zone, 2005).
Q: Won’t the carbon be sequestered in the fiber and stay there until it rots (and hemp is resistant to rotting)?
A: Saying the carbon will stay in the fiber is partially correct… it will also stay in the leaves and the roots. The leaves and roots will decay faster. But, as for the fibers, to harvest them takes more carbon than the carbon that is sequestered. In all cases of plants as carbon sinks, it does nothing to solve the problem of the CO2 in the atmosphere that was released by fossil fuels. Plants are just a temporary store for their own carbon. Trees absorb and release about the same amount of carbon over a 100-year cycle (with many shorter time cycles for the leaves — about 1-2 years.) Comparatively, hemp’s cycle is only a few years. Another important factor in calculating the length of time of a carbon sink with plants is that plants also breath: “Plants release up to 30 per cent more CO2 than previously thought.” During daylight and night there is the process of plant respiration in which plants breath in O2 and breath out CO2. This is different than during daylight hours when a separate process called photosynthesis takes in carbon dioxide and releases oxygen. Plants release up to 30 per cent more CO2 than previously thought, 2017)
Q: Would it is better to have tarmac than grow hemp? Even though hemp can replace petroleum-based plastic with biodegradable products?
A: No, not at all. We should plant as many plants with the longest sink-cycle (trees). Most importantly we should stop releasing CO2 that has been sequestered for millions of years. Then, we should figure how to re-sequester CO2 for millions of years.
Hemp has far more benefits and significantly less costs than petroleum products; however, agriculture in general has many costs (in fact, the invention of flooded rice paddy agriculture thousands of years ago in China was one of the first major human causes of climate change.” The origins of human-influenced climate change may be traced back 5,000 years“, 2004) Monoculture of hemp, corn, and other bio-fuels release all the CO2, create more ozone and require vast areas of land. Having a single crop produced in large scale has a devastating effect on biodiversity. Bio-plastics and other petroleum substitutes create the same sort of environmental problems. They don’t instantly bio-degrade. They initially breakdown into micro-bio-plastics.
The little live creatures on this planet have evolved for a couple billion years to eat what plants make — like carbohydrates. So, they eat carbohydrates much faster than they can eat hydrocarbons from fossil fuels. (But they are working on it, we already see evolution in that direction.)
Unfortunately, there are no good carbon sinks known to Man (other than petroleum / hydrocarbons.) The best solution is to stop human Green House Gas emissions. A study published in the Journal Nature, The contribution of insects to global forest deadwood decomposition found, “Worldwide, dead and decaying wood releases roughly 10.9 gigatons of carbon every year. This is roughly 115% of annual fossil fuel emissions.”
“We found both the rate of decomposition and the contribution of insects are highly dependent on the climate, and will increase as temperatures rise,” study co-author David Lindenmayer said.
At present, bio derived packaging is to be preferred to fossil derived packaging since the former made out of carbohydrate will break down faster than fossil derived hydrocarbon. More important, the bio derived packaging is only returning to the atmosphere recently obtained CO2, since the plants from where the packaging came would decay anyway. But, if fossil plastic decays, that’s dumping into the atmosphere fossil C which was buried hundreds of millions of years ago. Maybe it’s a good thing the little bugs haven’t yet found a widespread, efficient way to eat fossil plastic.
Relative to petroleum, plants are much more beneficial. Hydrocarbons have a much greater cost to the environment. Relative to trees, hemp is far more costly; however, the real solution is to cut down on packaging and consumption.
Scientists have a moral obligation to clearly warn humanity of any catastrophic threat and to “tell it like it is.” On the basis of this obligation and the graphical indicators presented below, we declare, with more than 11,000 scientist signatories from around the world, clearly and unequivocally that planet Earth is facing a climate emergency.
The climate crisis is closely linked to excessive consumption of the wealthy lifestyle. The most affluent countries are mainly responsible for the historical GHG emissions and generally have the greatest per capita emissions (table S1). In the present article, we show general patterns, mostly at the global scale, because there are many climate efforts that involve individual regions and countries. Our vital signs are designed to be useful to the public, policymakers, the business community, and those working to implement the Paris climate agreement, the United Nations’ Sustainable Development Goals, and the Aichi Biodiversity Targets.
Profoundly troubling signs from human activities include sustained increases in both human and ruminant livestock populations, per capita meat production, world gross domestic product, global tree cover loss, fossil fuel consumption, the number of air passengers carried, carbon dioxide (CO2) emissions, and per capita CO2 emissions since 2000 (figure 1, supplemental file S2). Encouraging signs include decreases in global fertility (birth) rates (figure 1b), decelerated forest loss in the Brazilian Amazon (figure 1g), increases in the consumption of solar and wind power (figure 1h), institutional fossil fuel divestment of more than US$7 trillion (figure 1j), and the proportion of GHG emissions covered by carbon pricing (figure 1m). However, the decline in human fertility rates has substantially slowed during the last 20 years (figure 1b), and the pace of forest loss in Brazil’s Amazon has now started to increase again (figure 1g). Consumption of solar and wind energy has increased 373% per decade, but in 2018, it was still 28 times smaller than fossil fuel consumption (combined gas, coal, oil; figure 1h). As of 2018, approximately 14.0% of global GHG emissions were covered by carbon pricing (figure 1m), but the global emissions-weighted average price per tonne of carbon dioxide was only around US$15.25 (figure 1n). A much higher carbon fee price is needed (IPCC 2018, section 2.5.2.1). Annual fossil fuel subsidies to energy companies have been fluctuating, and because of a recent spike, they were greater than US$400 billion in 2018 (figure 1o).