bookmark_borderA Coupled Framework for Compression of Climate Impact Doubling Times

Climate Jerk in Socio-Ecological Systems

By Daniel Brouse and Sidd Mukherjee

Abstract

Conventional climate-risk analysis often treats impacts as the downstream consequence of physical hazard
intensification alone. In this framing, rising losses, displacement, mortality, infrastructure disruption,
and systemic instability are interpreted primarily as a function of increasing temperature, precipitation
extremes, sea-level rise, or other physical forcing variables. While useful, that approach increasingly fails
to explain the observed acceleration of climate damages in the real world, where losses are shaped not only
by changing hazards, but by the interaction of hazards with exposure, governance capacity, adaptation limits,
and broader socio-economic fragility.

This paper proposes a revised socio-ecological framework for climate impact dynamics:

D(t) = H(t)E(t) − P(t) + S(t)

where:

  • D(t) represents realized climate damages or disruption
  • H(t) is hazard forcing
  • E(t) is exposure
  • P(t) is protection, governance, and adaptation capacity
  • S(t) is socio-economic stress amplification

We argue that climate impacts should be understood not as the output of a stationary hazard-loss relationship,
but as the emergent behavior of a non-stationary coupled system whose internal interactions increasingly amplify
the effects of physical climate forcing.

Within this framework, the relevant measure is not merely the rate of warming or the trend in a single physical
variable, but the compression of effective doubling times for climate impact indicators. We show
that a wide range of impact metrics—including insured losses, flood damages, infrastructure failures,
agricultural disruptions, heat mortality, displacement, and adaptation costs—can be interpreted as manifestations
of an accelerating effective growth constant generated by the coupling of H, E, P, and
S. Under this interpretation, the characteristic doubling time of major climate impacts appears to have
contracted from roughly century-scale behavior in the late nineteenth and early twentieth centuries to
decadal-scale behavior in the contemporary era.

We define this compression in effective timescales as a form of climate jerk: the acceleration
of the acceleration of realized climate damages within a socio-ecological system. Climate jerk is not a purely
meteorological quantity. It is the emergent signature of a civilization encountering intensifying hazards with
increasing exposure, uneven protection, and mounting systemic stress. This framework helps explain why climate
impacts now appear to accelerate faster than hazard-only models would predict, and why adaptation strategies that
focus narrowly on physical climate variables may systematically underestimate future risk.

1. Introduction

Climate change is often described through the language of physical forcing: rising temperatures, increasing
atmospheric moisture, shifting precipitation patterns, stronger heat extremes, sea-level rise, and intensifying
hydrologic and ecological disruption. These changes are real and well-established. Yet the most socially relevant
outcomes of climate change—flood losses, infrastructure failures, heat mortality, wildfire destruction, crop
losses, migration, insurance withdrawal, public-health crises, and governance strain—do not arise from hazard
forcing alone. They emerge from the interaction of physical hazards with where people live, how wealth and
infrastructure are distributed, how resilient institutions are, and how much stress a society can absorb before
nonlinear breakdown begins.

The prevailing hazard-centric framing tends to assume that damages are some relatively stable function of physical
forcing. In its simplest form, this can be represented as a loss function tied directly to hazard magnitude or to
a small set of physical indicators. That approach is increasingly inadequate. The observed growth of climate
damages over the past several decades cannot be fully understood without accounting for the rapid expansion of
exposed assets, the concentration of populations in high-risk geographies, the uneven performance of adaptation
and governance systems, and the feedback loops through which repeated shocks degrade social and economic
resilience.

A coastal flood in 1920 and a coastal flood of comparable meteorological character in 2025 do not produce
equivalent outcomes. The latter strikes a vastly larger and more interconnected system of homes, roads,
hospitals, ports, grids, insurance structures, supply chains, and politically stressed communities. Similarly,
a heat wave or wildfire event today unfolds in a world of denser urbanization, tighter agricultural margins,
aging infrastructure, more expensive real estate, higher debt burdens, and increasingly polarized governance
environments. The same physical perturbation therefore generates a larger and often more persistent social impact.

This paper proposes that climate damages should be modeled as the output of a coupled socio-ecological
system
rather than as a simple hazard response function. We define realized climate damages or disruption
D(t) as:

D(t) = H(t)E(t) − P(t) + S(t)

where:

  • H(t) = hazard forcing, including the frequency, intensity, persistence, and spatial extent of physical climate extremes
  • E(t) = exposure, including the distribution of people, infrastructure, agriculture, insured value, and economic assets in hazard-prone environments
  • P(t) = protection, governance, and adaptation capacity, including physical defenses, institutional competence, emergency response, social safety nets, and long-term planning
  • S(t) = socio-economic stress amplification, including fragility induced by inequality, debt, migration pressures, insurance retreat, infrastructure interdependence, public-health strain, political dysfunction, and cascading failures

The purpose of this formulation is not to claim that these terms are fully separable or universally measurable in
a single closed form. Rather, it is to establish a more realistic conceptual and analytical framework for
understanding why climate impacts are accelerating faster than hazard-only approaches imply.

The central claim of this paper is that the most important observable signature of this coupled system is the
compression of effective doubling times in climate impact indicators. A system whose losses double
every century behaves very differently from one whose losses double every decade. Even if the physical climate
signal evolves more gradually, the socio-ecological damage signal can accelerate much faster because the system
itself is changing: exposure grows, adaptation saturates, and stress amplification compounds each shock. The
result is a shortening of the effective timescale of damage growth.

We refer to this shortening—and the underlying increase in the rate of increase—as climate jerk.
In mechanics, jerk is the derivative of acceleration with respect to time. In climate socio-ecological systems,
climate jerk refers to the increasing acceleration of realized impacts as hazards, exposure, governance limits,
and systemic fragility interact. It is a way of naming the phenomenon in which the climate damage function itself
becomes more nonlinear over time.

The framework developed here does not replace physical climate science. Rather, it extends it into the domain
where climate change is actually experienced: not only in degrees Celsius, but in destroyed infrastructure,
uninsurable neighborhoods, repeated crop failures, overwhelmed emergency systems, migration pressure, and
cascading economic instability. If the aim of climate analysis is to understand the future trajectory of
real-world damages, then the hazard must be studied together with the system it strikes.

2. From Hazard-Centric Models to Coupled Damage Dynamics

2.1 The limitation of hazard-only framing

Traditional climate-impact discussions often begin from a hazard function of the form:

D(t) ≈ f(H(t))

D(t) ∝ H(t)

Such formulations are not inherently wrong. In many narrow contexts, hazard magnitude is indeed the dominant
explanatory variable. But as a general framework for long-horizon climate damages, it is incomplete because it
assumes that the relationship between hazard and impact is sufficiently stable to be described primarily through
physical forcing.

In reality, the same hazard can produce radically different outcomes depending on exposure and social conditions.
A floodplain with sparse settlement and minimal capital stock is not equivalent to a floodplain dense with
suburban development, industrial infrastructure, electrical substations, data centers, hospitals, and
transportation corridors. Nor is a society with strong public-health systems, ample fiscal reserves, and robust
evacuation capacity equivalent to one with weakened institutions, unaffordable insurance, and high preexisting
stress.

Thus, hazard-only models tend to understate the degree to which impacts can accelerate even if the underlying
climate forcing evolves more smoothly. The hazard may be the trigger, but the realized damage is produced by the
coupled system the hazard encounters.

2.2 The coupled socio-ecological formulation

We therefore define realized climate damages as:

D(t) = H(t)E(t) − P(t) + S(t)

This equation is best interpreted as a framework equation rather than a final calibrated model. It formalizes four intuitions:

  1. Hazard alone does not create damage; hazard must strike something.
    The term H(t)E(t) captures the multiplicative effect of physical extremes acting upon exposed
    populations, infrastructure, and assets.
  2. Protection and adaptation can suppress realized damage.
    The term P(t) represents all forms of buffering capacity: seawalls, drainage, building codes,
    early warning systems, evacuation logistics, crop switching, grid hardening, public-health systems, insurance
    mechanisms, and competent governance.
  3. Socio-economic stress can amplify damage independently of hazard magnitude.
    The term S(t) represents the extent to which existing fragility turns a severe event into a
    systemic crisis. A flood striking a financially stressed municipality, an uninsured household sector, or an
    already overloaded emergency system can generate much larger downstream disruption than the hazard alone would imply.
  4. The system is non-stationary.
    None of these terms is constant. Hazards intensify, exposure grows and relocates, protection improves unevenly
    and may saturate, and social stress can accumulate through repeated shocks. The relationship between forcing and
    damages is therefore not fixed.

3. The Four Components of the Framework

3.1 Hazard forcing: H(t)

H(t) represents the physical climate hazard environment. This includes, but is not limited to:

  • extreme precipitation intensity and persistence
  • flood frequency and compound flood risk
  • heat extremes and humidity stress
  • wildfire-conducive heat, drought, and wind regimes
  • drought persistence and agricultural water stress
  • tropical cyclone rainfall, storm surge, and wind damage potential
  • sea-level rise and tidal inundation
  • ecological destabilization affecting disease vectors, food systems, and fire regimes

In a warming world, H(t) is not simply a linear trend in average temperature. It is a changing
hazard field characterized by intensifying tails, altered persistence, compounding events, and growing background
conditions that make extremes more destructive.

3.2 Exposure: E(t)

E(t) represents the amount and distribution of people, infrastructure, assets, and economic activity located in harm’s way. Exposure includes:

  • population growth in coastal, fluvial, and wildland-urban interface zones
  • concentration of high-value property and infrastructure in risk-prone areas
  • growth of insured value and replacement costs
  • supply-chain dependence on vulnerable transport and logistics nodes
  • agricultural exposure to heat, drought, or flood-sensitive regions
  • urban heat exposure due to dense built environments

Exposure matters because climate losses are not driven solely by stronger hazards; they are also driven by the
increasing value and complexity of what those hazards strike.

3.3 Protection and governance: P(t)

P(t) represents the ability of societies to reduce or absorb impacts. It includes:

  • engineered defenses and resilient infrastructure
  • land-use planning and retreat from high-risk areas
  • emergency response and disaster preparedness
  • public-health capacity
  • insurance and financial backstops
  • social safety nets
  • institutional competence and long-term governance

P(t) can delay or reduce damages, but it does not necessarily scale in proportion to
H(t) and E(t). In many jurisdictions, adaptation is underfunded, politically
delayed, or structurally incapable of matching the speed of risk accumulation.

3.4 Socio-economic stress amplification: S(t)

S(t) is the term most often omitted from conventional climate-impact analysis. It captures the degree to which underlying social and economic fragility magnifies the consequences of hazard events. Examples include:

  • insurance withdrawal and rising underinsurance
  • household debt and inability to recover after repeated shocks
  • strained municipal finances
  • political dysfunction and delayed response
  • health-system overload during heat or smoke events
  • labor disruptions, supply-chain breakdowns, and cascading infrastructure failure
  • displacement, migration pressure, and social conflict
  • compounding disasters that strike before recovery from prior events is complete

S(t) is not merely a residual. It is a dynamic amplifier. A society repeatedly struck by
expensive disasters may become more fragile over time, which means later events produce disproportionately larger
damage even if hazard growth is modest.

4. Climate Jerk: The Compression of Impact Timescales

4.1 Why doubling time matters

If climate damages were growing at a constant proportional rate, we could write:

D(t) = D0ekt

Td = ln(2) / k

But the socio-ecological system described above implies that the effective growth rate k is
itself changing through time. Hazard forcing intensifies, exposure accumulates, protection struggles to keep pace,
and stress amplification rises. The relevant quantity is therefore the effective growth constant:

keff(t) = d/dt ln D(t)

Td(t) = ln(2) / keff(t)

The central empirical question is not simply whether climate damages are increasing. It is whether the
characteristic timescale of their increase is shrinking.

4.2 Defining climate jerk

In classical mechanics, jerk is the time derivative of acceleration. Translating that intuition into climate
socio-ecological dynamics, we define climate jerk as the tendency for the acceleration of
realized climate damages to increase over time because the system generating those damages is becoming more
strongly coupled and more fragile.

In practical terms, climate jerk is visible when:

  • major impact indicators begin doubling faster than they did in prior eras
  • damages rise faster than physical hazard trends alone would suggest
  • repeated shocks produce larger secondary and tertiary losses
  • the lag between hazard intensification and social disruption shortens
  • adaptation capacity falls progressively behind the combined growth of hazard, exposure, and stress

Climate jerk is therefore not a claim that every climate variable follows a smooth higher-order derivative. It is
a systems-level descriptor of accelerating impact dynamics.

5. Compression of Climate Impact Doubling Times Since 1890

5.1 A historical interpretation

Under the coupled framework, the long-run history of climate damages can be understood as a sequence of regimes:

Regime I: Low-coupling industrial climate risk (late 19th century to mid-20th century)

Hazards were increasing more slowly, exposed capital stocks were smaller, urban systems were less dense, and
although governance was often weak, the absolute scale of climate-linked losses relative to total societal
complexity was lower. Effective doubling times for aggregate climate damages were likely on the order of a century.

Regime II: Great acceleration and expanding exposure (mid-20th century to late 20th century)

Rapid urbanization, suburbanization, industrial growth, coastal development, and asset concentration increased
exposure dramatically. Hazards intensified in a warming world, but damages rose faster than hazards because the
target system grew denser and more expensive. Effective doubling times shortened substantially.

Regime III: Nonlinear coupled disruption (late 20th century to present)

In the contemporary era, exposure is deeply concentrated, infrastructure is highly interdependent, insured and
uninsured losses are enormous, adaptation is uneven, and repeated shocks feed social and economic fragility. The
result is a further compression in effective doubling times, with many impact indicators now behaving on decadal
rather than multi-decadal or century-scale horizons.

5.2 Approximate compression estimates

A conceptual reconstruction consistent with the coupled-system interpretation is:

Period Character of system Approximate effective doubling time of major climate-impact indicators
1890–1950 weakly coupled hazard-exposure system 100–120 years
1950–1990 accelerating exposure and hazard interaction 40–60 years
1990–2010 strongly coupled damage growth 20–30 years
2010–present nonlinear socio-ecological amplification regime 8–15 years

This implies that the effective doubling time of climate impact indicators has compressed by roughly
an order of magnitude since the late nineteenth century.

If the characteristic impact doubling time was approximately 110 years in the early industrial period and is now
on the order of 10–12 years, then the compression factor is approximately:

110 / 11 ≈ 10

This is the core result of the framework:

The characteristic doubling time of climate impact indicators has compressed by roughly 10× since 1890.

6. Why the Compression Occurs

6.1 Hazard forcing is striking a larger target

The term H(t)E(t) makes clear that damage growth is not proportional to hazard growth alone.
Even if hazard forcing were rising “only” steadily, the multiplication by rapidly expanding exposure would
accelerate realized losses.

6.2 Protection does not scale linearly with risk

Protection and adaptation do matter, but they often scale too slowly. Infrastructure upgrades, governance reform,
managed retreat, insurance restructuring, and social resilience investments are expensive, politically difficult,
and slow to implement. As a result, P(t) often grows more slowly than the combined growth of
H(t), E(t), and S(t).

6.3 Stress amplification turns disasters into systemic crises

The rise of S(t) explains why losses can accelerate faster than the hazard itself. When repeated
events weaken fiscal capacity, drive insurance retreat, deepen inequality, or overload emergency systems, the
system becomes more damage-sensitive. This means that each new event lands on a more fragile base.

6.4 Repeated shocks reduce recovery time

One of the defining features of the present regime is that new shocks increasingly arrive before recovery from
previous shocks is complete. This creates overlap between disasters, transforming what once would have been
isolated losses into rolling crises. In such a system, adaptation capacity is not merely insufficient; it is
continuously eroded by the cadence of events.

7. Implications for Climate Risk Assessment

7.1 Hazard-only projections may systematically understate future damages

If impact projections are anchored primarily to hazard trends, they may fail to capture the additional
acceleration generated by rising exposure and socio-economic fragility. This can lead to persistent
underestimation of flood losses, wildfire costs, heat mortality, migration pressures, and infrastructure
disruption.

7.2 Adaptation must be evaluated as a dynamic race, not a static buffer

In a coupled system, adaptation is not a one-time adjustment. It is an ongoing contest between the growth of
H(t)E(t) + S(t) and the ability of P(t) to keep pace. If protection lags, the
system can transition into a regime where damages accelerate despite nominal adaptation spending.

7.3 Insurance and finance become climate sensors

Insurance withdrawal, premium escalation, municipal credit stress, and repeated reconstruction costs are not
peripheral phenomena. They are indicators that S(t) is rising and that the socio-economic system
is amplifying climate damages faster than conventional models anticipate.

7.4 Climate policy must target the whole damage function

Mitigation remains essential because it constrains H(t) at the source. But adaptation policy must
also reduce exposure and fragility directly: retreat from high-risk zones, resilient infrastructure, public-health
strengthening, emergency governance, and economic systems capable of absorbing repeated shocks.

8. Methodological Implications

The framework presented here is intentionally synthetic. It is designed to reorganize how climate impacts are
interpreted rather than to claim a single universal calibrated model. Its value lies in the fact that it aligns
the analytical unit with the observed phenomenon. The object of concern is not hazard in isolation, but
realized socio-ecological damage.

Future work should therefore focus on:

  1. constructing empirical proxies for H(t), E(t), P(t), and S(t) across regions and sectors
  2. testing whether climate-loss indicators exhibit systematic shortening of effective doubling times
  3. identifying thresholds where protection saturation causes abrupt upward shifts in damage trajectories
  4. integrating climate-jerk metrics into adaptation planning, insurance modeling, and fiscal risk analysis
  5. evaluating whether certain regions are entering high-S(t) regimes where socio-economic fragility dominates hazard growth as the driver of realized losses

This framework is compatible with formal econometric, catastrophe-modeling, and systems-dynamics approaches. It
is not intended to replace them, but to provide a more realistic conceptual architecture for their integration.

9. Discussion

The language of climate change has long been dominated by warming trajectories, emissions scenarios, and physical
thresholds. Those remain indispensable. Yet the lived reality of climate change is increasingly a reality of
damage acceleration: faster-rising losses, faster-rising recovery costs, faster-rising insurance
stress, faster-rising displacement, and faster-rising governance overload.

A hazard-centric perspective struggles to explain why the social damage function can steepen so dramatically in
advance of any single “catastrophic” physical threshold. The coupled framework developed here explains that
steepening as the emergent product of hazard intensification, expanding exposure, lagging protection, and rising
socio-economic stress. The result is not simply more damage, but a compression in the timescale of damage
growth
.

This is why climate change can feel discontinuous even when some physical trends remain gradual. The discontinuity
lies not only in the hazard, but in the system it encounters. As the socio-ecological architecture of modern
civilization becomes more concentrated, more interconnected, more indebted, and more politically strained, the
same increment of physical warming can produce disproportionately larger social consequences.

The concept of climate jerk offers a language for that transition. It identifies the shift from a world in which
climate damages rise slowly enough to be treated as background risk, to a world in which damages accelerate
quickly enough to destabilize the institutions, markets, and governance systems meant to manage them.

10. Conclusion

Climate damages should no longer be modeled primarily as a direct and stable function of physical hazard forcing.
They are better understood as the emergent output of a non-stationary socio-ecological system:

D(t) = H(t)E(t) − P(t) + S(t)

In this framework, hazards matter enormously, but they do not act alone. They act upon a civilization
characterized by rapidly changing exposure, uneven adaptation, and mounting socio-economic fragility. The
resulting damage dynamics are nonlinear and increasingly compressed in time.

The key observable consequence is a shortening of the effective doubling times of climate impact indicators—from
roughly century-scale behavior in the late nineteenth and early twentieth centuries to decadal-scale behavior in
the present era. This order-of-magnitude contraction in impact timescales is the signature of what we call
climate jerk: the acceleration of the acceleration of realized climate damages in a coupled
socio-ecological system.

Recognizing climate jerk matters because it changes the policy problem. The challenge is not merely to reduce
emissions or to defend against isolated hazards. It is to manage a rapidly accelerating damage system in which
physical climate forcing, exposure, adaptation limits, and social fragility interact. In that system, delay is
not neutral. Delay allows the timescale of impacts to compress further, making future adaptation more expensive,
more difficult, and in some cases structurally impossible.

Suggested Figures

Figure 1.

Conceptual diagram of the coupled framework

D(t) = H(t)E(t) − P(t) + S(t)

with arrows showing hazard forcing and exposure multiplying damages, protection damping them, and socio-economic
stress amplifying them.

Figure 2.

Compression of effective doubling times for climate impact indicators, 1890–present

A curve or stepped bar chart showing the shift from ~100–120 years to ~8–15 years.

Figure 3.

Hazard-only model vs. coupled socio-ecological model

  • Panel A: D(t) ≈ f(H)
  • Panel B: D(t) = H(t)E(t) − P(t) + S(t) with nonlinear acceleration

Figure 4.

Climate jerk schematic

A graph showing hazard growth, impact growth, and the rising effective growth constant
keff(t), highlighting the shrinking doubling time
Td(t).

Short Author Summary

We argue that climate damages are not determined by hazards alone. They arise from the interaction of physical
extremes with exposure, adaptation capacity, and social fragility. Using the framework
D(t) = H(t)E(t) − P(t) + S(t), we show how the effective doubling time of climate impacts can
compress from century-scale behavior to decadal-scale behavior. We describe this shortening of impact timescales
as climate jerk: the increasing acceleration of realized climate damages in a coupled
socio-ecological system.
bookmark_borderThe Real Cost of Fossil Fuels: How Trump’s Policies Accelerate Economic Collapse

by Daniel Brouse
December 10, 2025

Fossil-fuel combustion isn’t just environmentally destructive — it is the single most expensive human activity in the global economy. The illusion of “affordable energy” collapses the moment you account for the actual economic costs: healthcare burdens, lost productivity, infrastructure damage, climate-driven disasters, agricultural losses, ecosystem collapse, and trillions in government subsidies that mask the true market price of oil, gas, and coal.

When you add these direct and indirect costs together, the losses outweigh the benefits by trillions of dollars every single year.

Yet Donald Trump continues to weaponize disinformation, promoting anti-economic, white-nationalist energy policies built entirely on propaganda—not reality. And the data proves it.

Energy Prices: What Actually Happened

Trump repeatedly claims he “made energy cheap” and “brought prices down.”
That is a lie.

Here are the actual numbers:

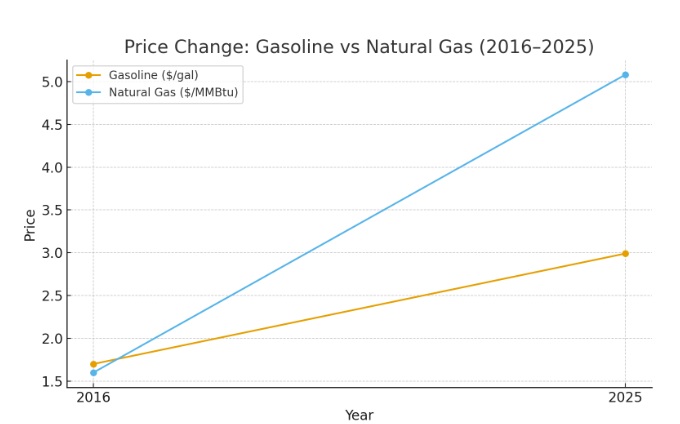
Gasoline

  • January 2016: $1.70/gallon
  • December 2025: ~$2.99/gallon
    ➡️ ↑ 76% increase

Natural Gas (Henry Hub Spot)

  • January 2016: ~$1.60 per MMBtu
  • December 2025: ~$5.08 per MMBtu
    ➡️ ↑ 217% increase

The truth is blunt:
Fuel prices are dramatically higher today than when Trump first took office—and that volatility is a direct consequence of policy choices, not some inevitable market swing. The biggest financial hit isn’t just at the gas pump, but on every electric bill in the country. Natural gas is still the backbone of U.S. power generation, so when its price spikes, electricity costs rise right along with it.

Trump made the situation dramatically worse by opening U.S. natural gas to heightened global demand, driving domestic prices even higher. And instead of strengthening the most affordable, stable, and sustainable energy sources—solar and wind—he’s actively undermined them. The result is a manufactured energy crisis that harms households, businesses, and the long-term health of the U.S. economy.

Trump’s Economic Agenda: A Blueprint for Collapse

Modern economic debates have been hijacked by emotional rhetoric and short-term political wins. But basic economics tells us:

  • Protectionism and tariffs shrink economies.
  • Nationalism and anti-immigration policies reduce labor supply, innovation, and GDP growth.
  • Populist attacks on institutions increase risk, weaken currency stability, and scare away investment.
  • Deregulation of fossil fuels amplifies long-term costs while accelerating climate-driven economic shocks.

These are not theoretical risks.
They are happening right now.

Capitalism Is Becoming Uninsurable

Perhaps the most alarming warning comes from Gunther Thallinger of Allianz SE, one of the world’s largest global insurers:

The pace and scale of climate-related destruction is beginning to exceed the insurance industry’s ability to function.

Insurance is the keystone stabilizer of capitalism.
If insurers can no longer price risk:

  • mortgages fail
  • banks collapse
  • property markets implode
  • businesses cannot operate
  • governments cannot finance disaster recovery
  • investment markets unravel

This is how capitalism collapses from within — not through ideology, but through mathematical certainty.

Climate Change: A Cascading, Nonlinear Health Crisis

Climate change is not just melting ice sheets.
It is unraveling the biological, ecological, and medical systems humans depend on.

Warming temperatures trigger reinforcing health feedback loops:

  • extreme heat → cardiovascular deaths → weakened population resilience
  • air pollution → chronic disease → higher mortality + healthcare costs
  • food system instability → malnutrition → reduced cognitive development
  • ecosystem collapse → infectious disease spread → rising pandemics
  • infrastructure failures → water contamination → chronic illness

These loops interact, amplify, and accelerate one another.
They are nonlinear, meaning each degree of warming creates exponentially greater harm.

This translates directly into:

  • shorter life expectancy
  • declining quality of life
  • skyrocketing healthcare costs
  • reduced labor productivity
  • shrinking economic output
  • destabilized communities
  • massive, permanent losses in human capital

The Bottom Line

Trump’s fossil-fuel agenda isn’t just anti-science.
It is anti-economic, anti-health, and anti-American.

By clinging to the most expensive and destructive energy system ever created, we are:

  • sabotaging our economy
  • accelerating financial collapse
  • undermining national security
  • destabilizing global markets
  • shortening human life
  • destroying the conditions necessary for civilization to function

A livable future — and a stable economy — requires recognizing that clean energy is not a cost.
It is the only economic path that ensures survival.

* Our probabilistic, ensemble-based climate model — which incorporates complex socio-economic and ecological feedback loops within a dynamic, nonlinear system — projects that global temperatures are becoming unsustainable this century. This far exceeds earlier estimates of a 4°C rise over the next thousand years, highlighting a dramatic acceleration in global warming. We are now entering a phase of compound, cascading collapse, where climate, ecological, and societal systems destabilize through interlinked, self-reinforcing feedback loops.

What Can I Do?
The single most important action you can take to help address the climate crisis is simple: stop burning fossil fuels. There are numerous actions you can take to contribute to saving the planet. Each person bears the responsibility to minimize pollution, discontinue the use of fossil fuels, reduce consumption, and foster a culture of love and care. The Butterfly Effect illustrates that a small change in one area can lead to significant alterations in conditions anywhere on the globe. Hence, the frequently heard statement that a fluttering butterfly in China can cause a hurricane in the Atlantic. Be a butterfly and affect the world.

→ “Solutions to the Fossil Fuel Economy and the Myths Accelerating Climate and Economic Collapse.“

The Climate Crisis: Violent Rain | Deadly Humid Heat | Health Collapse | Extreme Weather Events | Insurance | Trees and Deforestation | Soil | Rising Sea Level | Food and Water | Updates

Tipping points and feedback loops drive the acceleration of climate change. When one tipping point is toppled and triggers others, the cascading collapse is known as the Domino Effect.

The Human Induced Climate Change Experiment

Gasoline and Gas Prices 2016 to 2026

Trumpenomics

bookmark_borderClimate Disinformation 101: The CO₂ Coalition’s Dangerous Fantasy of ‘More CO₂ is Better’

by Daniel Brouse
September 13, 2025

The CO₂ Coalition isn’t doing science. It’s a fossil-fuel–funded propaganda group that pushes twisted half-truths. One of their most absurd and dangerous lies is the idea that “we need more CO₂” because it supposedly makes the Earth greener. That’s not science — that’s climate disinformation.

Here are the facts:

  1. Forests turning from sinks to sources – The Amazon, boreal forests, and other ecosystems have already shifted from being net carbon sinks to net carbon emitters in recent years. That’s not “greening,” that’s collapse.

  2. Pollution poisoning plants – Ground-level ozone is directly damaging vegetation, slashing net primary productivity (NPP) by 20–70% in many forests and croplands. Our own long-term field studies in Pennsylvania show old-growth trees have lost ~40% of foliage since 2003, with canopy height shrinking by a third. This mirrors global patterns of decline.

  3. The illusion of greening – Sure, you can get a temporary burst of vines and annuals when old trees die. But those species are carbon-neutral year to year. They don’t store long-term carbon, and in fact they speed the death of remaining trees.

  4. Feedbacks accelerating – Permafrost is no longer thawing slowly; it’s burning year-round, releasing greenhouse gases far faster than earlier models assumed. Add in water vapor amplification (7% more capacity per °C of warming, per Clausius-Clapeyron) and extreme rainfall physics, and we’re now seeing violent rain events with momentum and force scaling off the charts — tearing up soil, collapsing hillsides, and wrecking ecosystems.

Bottom line: the Earth isn’t “greening.” It’s browning and blackening — losing old growth, losing resilience, and spinning into feedback loops that accelerate warming and destruction.

ALSO SEE: The DOE Climate Working Group: Legal Violations, Ideological Networks, and Ecofascist Connections — Brouse (February 2026)

The Decline of Penn’s Sylvania Brouse (2024)

* Our probabilistic, ensemble-based climate model — which incorporates complex socio-economic and ecological feedback loops within a dynamic, nonlinear system — projects that global temperatures are becoming unsustainable this century. This far exceeds earlier estimates of a 4°C rise over the next thousand years, highlighting a dramatic acceleration in global warming. We are now entering a phase of compound, cascading collapse, where climate, ecological, and societal systems destabilize through interlinked, self-reinforcing feedback loops.

Tipping points and feedback loops drive the acceleration of climate change. When one tipping point is toppled and triggers others, the cascading collapse is known as the Domino Effect.

The Human Induced Climate Change Experiment

bookmark_borderHow Extreme Heat Accelerates Aging and Cuts Life Expectancy

by Daniel Brouse
July 25, 2025

Extreme heat doesn’t just make you uncomfortable—it makes you age faster. Prolonged exposure to high temperatures accelerates biological aging by damaging cells and tissues, undermining human health at the molecular level.

“An accelerated biological age is the ‘canary in the coal mine’ for future risk of earlier onset of diseases such as cancer, dementia, and diabetes, and early death,” explained Jennifer Ailshire, professor of gerontology and sociology at the University of Southern California Leonard Davis School of Gerontology.

Climate Change and Heat Waves Are Reducing Lifespans

As climate change drives increasingly severe and longer-lasting heat waves, life expectancy is likely to decrease. This is not a distant projection but a direct, ongoing reality. Extreme heat disrupts sleep, increases dehydration, and places chronic stress on the cardiovascular and respiratory systems, worsening preexisting conditions and triggering new ones.

This is just one example of how climate change is reducing both the quantity and quality of human life. The impacts of extreme heat are not evenly distributed: older adults, children, outdoor workers, and low-income communities face disproportionate risks due to limited access to cooling, healthcare, and adaptive infrastructure.

The Cellular Impact of Heat on Aging

Our DNA provides the blueprint for how our bodies function, and while the sequence of our DNA is set at birth, the expression of these genes—how that blueprint is carried out—can change in response to environmental factors.

Extreme heat can trigger epigenetic changes, chemical modifications that turn genes on or off like a light switch. These changes can activate high-risk genes associated with cancer, diabetes, cardiovascular disease, and neurological disorders, increasing susceptibility to these conditions later in life.

The recent USC study found that older adults exposed to extreme heat showed markers of accelerated biological aging. This cellular aging is a predictor of early disease onset and mortality, highlighting the hidden toll of rising temperatures.

A Vicious Feedback Loop

As temperatures rise, reliance on air conditioning increases, leading to higher energy demand, which—if powered by fossil fuels—further accelerates climate change and increases heat exposure. This creates a vicious cycle of heat, emissions, and health decline.

At the same time, heat waves often coincide with higher levels of ground-level ozone and particulate pollution, compounding cellular damage and inflammation, and worsening cardiovascular and respiratory health.

The Path Forward

Mitigating climate change is a public health imperative. Policies that rapidly transition energy systems away from fossil fuels, expand urban green spaces, and improve building designs to keep people cool without excessive energy use are critical.

At the individual level, strategies to reduce heat exposure, stay hydrated, and monitor health during heat waves can help, but systemic changes are necessary to address the accelerating threat of climate-driven aging and mortality.

Conclusion

Extreme heat is not just a discomfort or inconvenience; it is a biological stressor accelerating aging, reducing lifespans, and increasing the risk of chronic disease. As climate change continues to intensify heat waves, we can expect an increase in age-related health conditions occurring earlier in life, underscoring the urgency of climate action as a health intervention.

Climate Change and the Surging Threat of Pathogen Vectors Brouse (2025)

Tipping points and feedback loops drive the acceleration of climate change. When one tipping point is toppled and triggers others, the cascading collapse is known as the Domino Effect.

The Climate Crisis: Violent Rain | Deadly Humid Heat | Disease Vectors | Extreme Weather Events | Insurance | Trees and Deforestation | Rising Sea Level | Food and Water | Updates

The Human Induced Climate Change Experiment

bookmark_borderHow Risk Management Turns to Crisis Management

by Daniel Brouse
December 23, 2024

I have spent my life in the study and implementation of risk management. I obtained degrees with honors and academic accolades in economics, philosophy, and logic, including becoming the youngest subscriber to the Federal Reserve’s “Beige Book,” the country’s youngest university-level statistics tutor, and an inductee into both the Pi Gamma Mu and Phi Sigma Tau honor societies. This foundation was followed by 40 years of research, development, and real-world experience in risk management.

By the 1990s, it had become clear that the greatest risk to humans is, indeed, humans. First, climate change climbed from a substantial risk to an impending crisis. By the 2000s, the aging population emerged as the leading risk to short-term economic sustainability. Today, these two risks—human-induced climate change and an aging population—have combined and evolved into an existential crisis.

This is not to say that we should give up hope or abandon ship. Quite the contrary. Acknowledging the gravity of our circumstances makes it essential to invoke a robust and effective crisis management plan. What follows is an exploration of these intertwined crises and the paths forward to mitigate them.


The Rise of Human-Induced Climate Change

Climate change represents is the most profound example of a long-ignored risk evolving into a crisis. For decades, scientists and policymakers issued warnings about rising global temperatures, extreme weather events, and the cascading effects of environmental degradation. Despite this, global emissions and deforestation rates surged, driven by short-term economic priorities and political inertia.

The impacts are now undeniable. Wildfires, hurricanes, droughts, and floods have intensified, costing lives and overwhelming economies. Infrastructure built for past climates struggles to withstand today’s conditions, let alone those of the future. Furthermore, climate change disproportionately affects vulnerable populations, exacerbating global inequities and threatening social stability.

Complex feedback loops in climate science refer to interactions between different components of the Earth’s climate system that can amplify or dampen the effects of initial changes, leading to non-linear and often unpredictable outcomes. These feedback loops play a crucial role in shaping the behavior of the climate system and can influence various climate phenomena, including temperature changes, ice melt, and precipitation patterns. Tipping points are Critical Milestones that directly impact the rate of acceleration in climate change by multiplying the number and intensity of feedback loops. Identifying and understanding these tipping points is crucial for climate science and policymaking. Crossing multiple tipping points has led to the domino effect, resulting in much more rapid and severe climate change than previously projected.

Addressing this crisis requires immediate and coordinated action:

  • Transitioning to renewable energy: Fossil fuels must be phased out in favor of sustainable alternatives.
  • Implementing adaptive infrastructure: Cities and communities need to be redesigned to withstand the challenges of a changing climate.
  • Global cooperation: International agreements like the Paris Accord must be strengthened and enforced to meet ambitious targets.
  • Reducing pollution and greenhouse gases: Fossil fuel pollution is the leading cause of death worldwide and the greatest contributor to the climate crisis. Mitigating this requires aggressive policies to limit emissions and promote cleaner technologies.


The Economic Risks of an Aging Population

Parallel to the climate crisis is the demographic challenge of aging populations, particularly in developed nations. By the 2000s, it became clear that declining birth rates and increasing life expectancy were reshaping economic landscapes. Pension systems, healthcare infrastructure, and labor markets are all under strain.

Economic growth slows as the working-age population shrinks relative to retirees. Healthcare costs soar, and governments face mounting fiscal pressures. Wealth disparities exacerbate these challenges, as those without adequate savings face severe hardship in retirement.

Key strategies to address this demographic shift include:

  • Reforming healthcare and pensions: Systems must be made more efficient and sustainable.
  • Encouraging workforce participation: Policies that enable older adults to remain in the workforce longer can help ease economic pressures.
  • Investing in education and technology: Automation and productivity-enhancing technologies can offset labor shortages.
  • Demographic Solutions: Encouraging higher birth rates or increasing immigration can help stabilize the worker-to-retiree ratio. Mass immigration is likely the only viable solution for addressing both short-term and long-term challenges.

Bridging the Crises: An Integrated Approach

The climate and demographic crises are interconnected. Climate change disproportionately affects the elderly, who are more vulnerable to heatwaves, natural disasters, and health impacts. Simultaneously, the economic strain of aging populations limits resources available for climate mitigation and adaptation.

Addressing these crises requires an integrated approach that considers both environmental and economic sustainability. Policymakers, businesses, and individuals must work together to:

  • Redesign tax systems: Taxes should incentivize sustainable practices and ensure equitable contributions from all sectors.  Ideally, taxation should focus primarily on fossil fuel combustion. Pollution from fossil fuels is the leading cause of death globally. While the cost of human life is immeasurable, the associated increase in healthcare expenses places a significant burden on the economy. Additionally, the societal costs of climate change — driven largely by fossil fuel combustion — likely represent an even greater economic and environmental challenge. Redirecting taxation in this way could incentivize cleaner energy alternatives while addressing these critical issues. A 100% tax on a barrel of oil and a 1,000% tax on a ton of coal could significantly reduce wealth inequality while simultaneously fostering a sustainable economy.
  • Reduce wealth disparities: Closing the wealth gap can enhance resilience and provide resources for climate action. Taxing fossil fuel combustion could be the single largest factor in creating a more equitable future.
  • Embrace innovation: Technologies that address both climate and economic challenges must be prioritized.

Conclusion: From Crisis to Opportunity

Acknowledging the dual crises of climate change and an aging population is not a sign of defeat but a call to action. Humanity has faced existential threats before and emerged stronger through innovation, cooperation, and resilience. By transitioning from risk management to effective crisis management, we can not only mitigate these challenges but also build a more sustainable and equitable future.

What follows are detailed papers on the sustainability of our environment and economy, including energy, taxation, debt, healthcare, and wealth disparity. These explorations aim to provide actionable insights and solutions to navigate this critical juncture in human history.

The Human Induced Climate Change Experiment

Climate Change and Insurance: Costs, Availability, and Sustainability

Balancing the Books: How Public-Private Healthcare Models Can Sustain Economic Growth

Taxation in a Changing World: Challenges, Inefficiencies, and Paths to Sustainability

Wealth Taxes Are Illogical

Economic Outlook 2025 – 2035

bookmark_borderPolitical Overview of Economics

The latest economic analysis of the presidential candidates suggests that Trump’s fiscal policies could increase the federal deficit by an estimated $7-10 trillion over the next decade, primarily due to his proposed tax cuts and spending plans. Trump’s approach centers on lowering taxes, particularly for high-income earners and corporations, while increasing defense and infrastructure spending. This combination is likely to drive the deficit up significantly without matching revenue increases. Additionally, Trump plans to shift the tax burden from income-based taxes to consumption taxes, which disproportionately impacts lower- and middle-income households, as consumption taxes tend to be regressive.

In contrast, Kamala Harris’s fiscal policies are projected to have a much smaller effect on the federal deficit, with some analyses suggesting her approach may be close to net-neutral. Harris emphasizes maintaining and slightly increasing government revenue by raising taxes on the wealthy and corporations, while also focusing on targeted spending, such as expanding healthcare and education access.

However, it’s important to note that economic forecasts have limitations, particularly when considering non-concrete policy claims. For example, statements about “going after corporate gouging” or “building affordable housing” are often more rhetorical than substantive, as the details necessary to evaluate the financial feasibility of these promises are lacking. Consequently, these claims are typically excluded from rigorous economic projections because they lack clear policy frameworks or mechanisms for implementation.

This discrepancy between promises and reality is a common challenge in political economic analysis, as voters are often presented with grand ideas that may not withstand financial scrutiny.

Tariffs, Inflation, and the Climate
While the “Inflation Reduction Act” includes substantial subsidies for electric vehicles (EVs), Biden has maintained Trump’s China tariffs, and even imposed a 25% tariff on Chinese EVs, citing unsubstantiated claims that China is subsidizing its EV manufacturers. Another significant issue is the unfounded rhetoric around “corporate price gouging,” when the real culprit is supply and demand. Consumers’ insatiable appetite for mass consumption is what drives prices up, and it’s also a key factor in the looming climate catastrophe.

Climate-related inflation is a very real economic issue. For example, homeowners’ insurance has increased by 34% in the past five years, largely due to climate-related disasters. And this is just the beginning. In fact, it’s estimated that 25% of properties in the U.S. may become uninsurable within the next decade. Given this reality, claims about building affordable housing are unrealistic unless these foundational issues are addressed. These are the kinds of economic challenges that need to be tackled before I can give my endorsement.

Accepting Accountability
The government’s actions reveal a troubling mix of ignorance and indifference, turning what were once “worst-case” climate predictions into our current “best-case” scenarios. Updated climate models, now incorporating social-ecological factors, project that global temperatures could rise by as much as 9°C within this century — a drastic increase compared to previous estimates of a 4°C rise over the next millennium. Such extreme warming could push the planet toward a critical “wet-bulb” temperature threshold, where heat and humidity exceed the human body’s capacity to cool itself, posing severe and potentially lethal health risks. The need for decisive and immediate action has never been more urgent as climate change continues to spiral beyond control.

Unfortunately, that’s the reality. The root of the problem lies with us — the people. Government officials simply reflect our choices. Until consumer demands become more socially responsible, we’ll continue to get exactly what we want — and deserve. Each person bears the responsibility to minimize pollution, discontinue the use of fossil fuels, reduce consumption, and foster a culture of love and care. Only then can we drive the collective action needed to address the climate crisis and build a sustainable future.

Additional Resources
While biogeophysical factors can be studied using math, physics, and historical records, socio-economic systems pose greater challenges due to the unintended consequences of human behavior and inexplicable consumer choices.

Have you ever seen A Beautiful Mind, the movie about John Forbes Nash Jr.? One of our earlier papers on climate change, “The Golden Rule’s Social Justification,” draws heavily on Nash’s Nobel-winning work on Game Theory. Interestingly, it aligns closely with other core scientific, moral, and ethical principles. For a societal view, see the companion paper, Never Wake a Sleeping Giant.

Business & Economics

bookmark_borderEarth’s Vital Signs

by Daniel Brouse

Earth
Earth

Human-induced climate change serves as a dynamic and intricate component within an unordered system, guided by chaos theory. This suggests that global warming is undergoing exponential acceleration in a complex manner. The pace at which climate change is accelerating can be described as rapid, as evident in the intensity, duration, and likelihood of climate disasters. Drawing insights from the 2023 Canada wildfires, the World Weather Attribution Organization reported, “Climate change made the cumulative severity of Quebec’s 2023 fire season to the end of July around 50% more intense, and seasons of this severity at least seven times more likely to occur.”

Key Findings: Extreme weather and climate-related disasters have become 50% more intense and 7 times more likely.

In the 20th century, Earth’s surface temperature averaged 13.9℃. However, in the initial weeks of July 2023, the average temperature surged to 17℃. Human activities have propelled global temperatures more than 3℃ for parts of the year, with the entire period from February 2023 to February 2024 registering 1.5℃ above pre-industrial levels. A rise of 1.5 degrees already compromises human well-being, making much of the Earth uninhabitable.

As of 2024, humanity has surpassed seven critical tipping points, including Mountain Glacier Loss, Greenland Ice Sheet Collapse, Antarctic Ice Sheet Collapse, AMOC (Atlantic Meridional Overturning Circulation) Collapse, Amazon Rainforest Dieback, Coral Reef Die-Off, and Northern Permafrost Collapse. Crossing these tipping points triggers self-sustaining feedback loops independent of human activity. While the exact carbon stored in nature remains uncertain, an assumption could be made that temperatures might surge from 3 to 6 degrees above pre-industrial levels. Thriving beyond a 1.5-degree rise becomes impossible for humans. If an additional 3 degrees Celsius is added, the temperature and humidity would approach a wet-bulb temperature unsuitable for human life.

What Can I Do?
There exist numerous actions individuals can take to contribute to saving the planet. Each person bears the responsibility to minimize pollution, discontinue the use of fossil fuels, reduce consumption, and foster a culture of love and care. The Butterfly Effect illustrates that a small change in one area can lead to significant alterations in conditions anywhere on the globe. Hence, the frequently heard statement that a fluttering butterfly in China can cause a hurricane in the Atlantic. Be a butterfly and influence the world.

The Human Induced Climate Change Experiment

bookmark_borderClimate Change: Atmospheric Rivers

Extreme Rainfall–surge Hazard Risk Basics and Atmospheric Rivers Brouse (2022)

West Coast Atmospheric Rivers Brouse (2023)

East Coast Atmospheric Rivers Brouse (2023)

Greenland Atmospheric Rivers Mukherjee (2023)

ALSO SEE:

Real Estate and Flood Insurance Brouse and Mukherjee (1999 to present)
The Reign of Violent Rain Brouse and Mukherjee (2023)
The Age of Loss and Damage Brouse (2023)
Climate Change Impacts on Flood Risks and Real Estate Values Sidd Mukherjee and Daniel Brouse (2023)

bookmark_borderGreenland Atmospheric Rivers

by Sidd Mukherjee

Historically in the United States, atmospheric rivers (AR) have been associated with the West Coast. Now, AR activity is getting more attention on the East Coast.

Atmospheric rivers have been putting serious rainfall melt on Greenland for the last decade, too.

Darker snow surfaces absorb more sunlight and melt quicker. This effect is visible in Greenland. Box et al.,”Greenland ice sheet albedo feedback: thermodynamics and atmospheric drivers,” The Cryosphere, v6, pp821 et seq., doi:10.5194/tc-6-821-2012 state: ” Thus, intraseasonal summer albedo variability exceeds 0.50 over parts of the ice sheet where a snow layer ablates by mid-summer, exposing an impurity-rich ice surface …” Prof. Box is now investigating soot from North American wildfires as a factor in the darkening of Greenland.
— from News from the Ice Wars:An Occasional Bulletin

“Furthermore, our investigation of the short- and long-term relationships between moisture transport vents and modeled GrIS surface properties proves that this correspondence between the years of enhanced AR activity and anomalous GrIS mass loss is not a coincidence. Strong AR impacts cause increased melt in all areas of the GrIS and decreased SMB in the ablation zone during summer, and warm seasons with above-average GrIS melt extent are characterized by anomalously strong moisture transport by ARs over Greenland. ARs typically result in SMB gains in the GrIS ablation zone during nonsummer seasons and in the accumulation zone during all seasons. However, the intense summer SMB losses in the ablation zone during years of enhanced moisture transport outweigh the positive AR contributions to SMB in other regions and seasons. The scaling of melt versus snowfall in Figures 9 and 11 shows that the magnitude of mass loss from summer melt in the ablation zone has a much greater upper limit than mass gain from snowfall.”

In this paper see especially Fig. 9.

Then in 2018, Neff publishes again: more on atmospheric rivers causing the full surface melt in greenland in 2012.
— from Atmospheric River Impacts on Greenland Ice Sheet SurfaceMass Balance

“Rainfall at the Greenland ice sheet Summit 14 August 2021, was delivered by an atmospheric river (AR). Extreme surface ablation expanded the all-Greenland bare ice area to near-record-high with snowline climbing up to 788 ± 90 m. Ice sheet wet snow extent reached 46%, a record high for the 15–31 August AMSR data since 2003. Heat-driven firn deflation averaged 0.14 ± 0.05 m at four accumulation area automatic weather stations (AWSs). Energy budget calculations from AWS data indicate that surface heating from rainfall is much smaller than from either the sensible, latent, net-longwave or solar energy fluxes. ”

“Rainfall heat transfer contributed just 2% to the calculated melting at a 2,200 m elevation western ice sheet site (CP1 a.k.a. Crawford Point). Condensation or sensible heat transfer from the warm air mass was a far more powerful heat source. The observed amount of melting delivered by the AR could have happened without rain- fall. Yet, the impacts of rain and meltwater refreeze are considerable provided that percolation delivers the melt below where the heat can be radiated away and that refreeze-at-depth occurs. We found no evidence for the latter condition because the rainfall amount was not extreme and the surface was already melting hours before the rain- fall. Understanding any changes to the frequency and intensity of ARs appears to be a more important research target than the heat content of the liquid precipitation ARs may or may not produce Further, while rainfall that does not percolate and refreeze may not have strong surface thermodynamic impacts, rainfall contribution to the hydraulics of Greenland ice (Doyle et al., 2015) may be more consequential to ablation through ice sheet flow acceleration.”

open access, read all about it. The Watson river discharge described in the paper drains the saddle between north and south domes and is an area that i watch closely for signs of collapse. I suppose this is one.
— from Greenland Ice Sheet Rainfall, Heat and Albedo Feedback Impacts From the Mid-August 2021 Atmospheric River

ALSO SEE:
West Coast Atmospheric Rivers Brouse (2023)

East Coast Atmospheric Rivers Brouse (2023)

The Reign of Violent Rain Brouse and Mukherjee (2023)

The Age of Loss and Damage Brouse (2023)

Climate Change Impacts on Flood Risks and Real Estate Values Sidd Mukherjee and Daniel Brouse (2023)

bookmark_borderWest Coast Atmospheric Rivers

by Daniel Brouse

As the Earth warms, the air will hold more moisture. More moisture-laden air moves over land and creates atmospheric rivers (Pineapple Express). The Journal EOS in the article Atmospheric Rivers Spur High-Tide Floods on U.S. West Coast said, “Atmospheric rivers are narrow bands of moisture that travel across the lower troposphere, generally at the leading edges of massive low-pressure systems. At their peak, they can carry as much water through the sky as the Amazon River does on land. They unleash intense winds and heavy rain as they surge across the Pacific Ocean, eventually making landfall on the U.S. West Coast, contributing to many high-tide flooding events.”

The atmospheric rivers also bring heavy rainfall inland causing extreme flooding. In October of 2021 NOAA said, “a convergence of storms brought more than half a foot of rain to parts of the Bay area in addition to strong winds, flash floods, and mud/landslides. They also bring the potential for heavy snow to higher elevations in the Sierra Nevada mountain range.” (Atmospheric River Hits the West Coast)

In December 2022 and January 2023, California experienced nine back-to-back atmospheric rivers; the longest stretch of continuous atmospheric river conditions on record. NOAA went on to report, “Several atmospheric rivers struck in March 2023, bringing heavy rain and snowfall to much of the West. According to the California Department of Water Resources, the statewide snowpack was among the deepest ever recorded for the end of March — 237% of normal.”

In October of 2023, a tropical storm turned into category 5 Hurricane Otis in a record 12-hour intensification. Hurricane expert Kerry Emanual said Otis was supercharged by global warming. Historically, hurricanes’ intensification was driven by ocean surface temperatures. Otis was additionally supercharged by increasing temperatures deeper in the ocean. Hurricane Otis became the strongest on record to hit Mexico’s Pacific coast. NOAA reported, “When Otis first hit, mudslides outside the city in mountainous terrain prevented crews from traveling to the city to provide aid, and according to the Associated Press, the 10,000 troops that were deployed to the area lacked the tools needed to clear mud and downed trees off roads.”

ALSO SEE:
East Coast Atmospheric Rivers Brouse (2023)

The Reign of Violent Rain Brouse and Mukherjee (2023)

The Age of Loss and Damage Brouse (2023)

Climate Change Impacts on Flood Risks and Real Estate Values Sidd Mukherjee and Daniel Brouse (2023)