bookmark_borderWarmest Year on Record

The Human Induced Climate Change Experiment

According to NOAA scientists, the average temperature for the contiguous U.S. for 2012 was 55.3°F, which was 3.2°F above the 20th century average and 1.0°F above the previous record from 1998. The year consisted of the fourth warmest winter, a record warm spring, the second warmest summer, and a warmer-than-average autumn. Although the last four months of 2012 did not bring the same unusual warmth as the first 8 months of the year, the September through December temperatures were warm enough for 2012 to remain the record warmest year, by a wide margin.

The average precipitation total for the contiguous U.S. for 2012 was 26.57 inches, 2.57 inches below average, and the 15th driest year on record for the nation.

The U.S. Climate Extremes Index indicated that 2012 was the second most extreme year on record for the nation. The index, which evaluates extremes in temperature and precipitation, as well as landfalling tropical cyclones, was nearly twice the average value and second only to 1998.

Additional Resources        

bookmark_borderNational Snow And Ice For 2012

State of the Climate
National Snow & Ice
Annual 2012
National Oceanic and Atmospheric Administration
National Climatic Data Center

The 2011/12 winter season was nearly non-existent for much of the eastern half of the nation. The December 2011-February 2012 three-month period was marked by near-record warmth across the U.S.-Canadian border, the Midwest, Mid-Atlantic, and Northeast, limiting seasonal snowfall across those regions. Many locations had near-record low snowfall totals for the winter season. Early spring brought much of the same, when the contiguous U.S. had its warmest March on record, with a monthly temperature 8.6°F above average. The lack of snowfall and snowpack for the winter and spring across the Rockies, Great Plains, and Midwest was a precursor to the large drought episode that impacted two-thirds of the nation during the summer and autumn of 2012. In contrast to the rest of the nation, the Pacific Northwest was closer to average during winter in terms of temperature and precipitation, with several winter storms bringing heavy snowfall to the high elevations. The early-spring was wetter and cooler than average for the Northwest, contributing to above-average snowfall for many locations in the region.

US Winter snow extent anomalies
Contiguous U.S. Winter Snow Cover Extent Anomalies
Data Source: Rutgers Global Snow Lab

According to data from the Rutgers Global Snow Lab, both the winter and spring seasons brought below-average snow cover to the contiguous United States. The satellite-derived snow cover extent for December 2011-February 2012 was approximately 237,000 square miles below the 1981-2010 average — the third smallest winter snow cover footprint in the 46-year satellite record. This was the first winter since 2005-2006 with below-average snow cover for the country. Only the winter seasons of 1991/92 and 1980/81 had smaller snow cover extents. The March-May spring snow cover extent was 151,000 square miles below the 1981-2010 average — the third smallest spring snow cover extent on record. The springs of 1968 and 2000 had smaller seasonal snow cover footprints.

Western US Snowpack 1 May 2012
Western U.S. Snowpack
April 1, 2012
Source: USDA

Winter and spring mountain snowpack provide a crucial water source across much of the western United States. The total annual water budget for agriculture and human use in the mountainous West is highly dependant on the amount of snow melt that will occur in spring and is proportional to the amount of snow on the ground. The annual snowpack typically reaches its maximum value at the end of March. According to data from the USDA, on April 1st, 2012, above-normal snowpack was observed through the Cascades of Oregon and Washington, with near-normal snowpack stretching eastward through the northern Rockies of Idaho, Montana, and northern Wyoming. To the south, below and much-below snowpack was observed for the Sierra Nevada Mountains, the Great Basin, and the Central and Southern Rockies. Snowpack totals less than 50 percent of normal were widespread in California, Nevada, Utah, Colorado, Arizona, and New Mexico. In Alaska, snowpack totals were above normal for the Southern coasts and peninsula, and below-normal across the North Slope.

Select Significant Events

A strong and powerful winter storm moved across the Southern Rockies and High Plains of Colorado, New Mexico, Texas, Oklahoma, and Kansas on December 19th and 20th of 2011. Snowfall up to 15 inches was reported across the region, and strong winds in excess of 50 mph created blizzard conditions. Parts of Interstates 25 and 70 were closed, and the storm was blamed for six deaths. Dalhart, Texas, shattered its daily snowfall record, where 7.0 inches fell on the 19th, surpassing the 0.1 inch which fell on the date in 1983. The 8.2 inches that accumulated in Pueblo, Colorado during the two-day event contributed to the city having its snowiest December on record, with 18.6 inches falling throughout the month. This surpassed the previous December record of 18.2 inches, which fell in December 1913.

Satellite Image of December 19-20 Snow Cover
Satellite Image of Pacific Northwest Snowcover
Source: NASA

A large and powerful winter storm, accompanied by a surge of moisture from the tropics often referred to as an atmospheric river or the ‘Pineapple Express’, impacted the western U.S. January 18th–23rd. The worst impacts were felt across the Pacific Northwest, where several feet of snow accumulated and strong winds were observed, causing icy roads, downed power lines, and avalanches. A state of emergency was declared for much of Oregon and Washington, where over a quarter-million households lost electricity. Impressive wind, snow, and rain measurements were made during the event Mount Hood, Oregon received over 50 inches of snow, winds approaching 90 mph were measured at Summer Lake, Oregon, and over 15 inches of rain fell at Swiss Home, Oregon. The Mary’s River in Philomath, Oregon crested at its highest flood height on record. Seven inches of snow fell in Seattle, which averages only 8 inches of snow a year. To the south, across the high terrain of California and Nevada, the precipitation was a welcome sight, where very dry conditions had previously dominated during the 2011-2012 winter season. Nevada’s Carson River Basin had snowpack only 8 percent of normal before the storm (compared to 224 percent at the same point in January 2011, one year prior).

A record-breaking snow storm impacted eastern Colorado and parts of Nebraska February 2nd–4th. The slow moving storm dropped 15.9 inches of snow in Denver, a new February snow storm record, surpassing the previous record of 14.1 inches set in February 1912. The 22.7 inches that fell in Boulder was also a February record. Snow accumulations greater than three feet were widespread across the region’s highest terrain. Storms of this magnitude are more common in the region during the early spring months of March and April. As the storm moved off to the east it dropped upwards of a foot of snow across much of Nebraska. The 11.1 inches that accumulated in Lincoln, Nebraska was the fourth largest 24-hour snowfall on record for the city.

Snow totals Feb 29 2012
Satellite Image of CO and NE Snow Cover
Source: NWS

A potent storm system on February 28th and 29th brought heavy snowfall and blizzard conditions across the Northern Plains, Great Lakes, and into the Northeast. Snowfall totals exceeding one foot fell in a string of states from South Dakota to Maine. The heaviest snow fell across Minnesota and Wisconsin, where snow totals approached two feet, accompanied by winds gusting to 50 mph, creating blizzard conditions for several hours. The snow from this storm was one of the few snow events this season across many of the regions affected. Much of the Northern Plains, Great Lakes

Pacific NW March 22 snowfall
22 March Pacific Northwest Snowfall
Source: National Snow Analysis

During March, as much of the eastern U.S. was basking in record breaking warmth, an upper-level trough brought cooler-than-average conditions and late-season precipitation to the Pacific Northwest. On March 22nd, a large Pacific extra-tropical cyclone slammed into the West Coast, dumping upwards of three feet of snow across the high elevations of the Washington and Oregon Cascade Mountains. The 0.5 inch of snow that fell at the Portland, Oregon airport was the largest snowfall accumulation this late in the season. Salem and Eugene, Oregon both set new March snow storm records with 2.5 and 7.5 inches of snow, respectively. This storm was part of a larger and persistent weather pattern which brought much-above-average precipitation and below-average temperatures to the region during March. The 7.89 inches of precipitation that accumulated in Portland was a new monthly record.

April 24th Northeast Snow Depth
24 April Northeast Snow Depth
Source: NOAA NNVL

A late-season storm dropped over a foot of snow from West Virginia to Upstate New York, along the higher elevations of central and northern Appalachian Mountains, on April 23rd and 24th. To the east, in the lower elevations, heavy rain fell across the large cities of the Northeast. This type of coastal storm, called a Nor’easter, was only the second of the season to impact the eastern seaboard, with the other being very early in the season in October. The snow storm was also on the heels of the warmest March on record for many locations across the region, where most trees already had begun to leaf. The snow falling on trees with leaves caused additional headaches by bringing down limbs and cutting power to at least 75,000 residents. The storm also resulted in at least 48 daily snowfall records. Although the storm did have some negative impacts, it provided drought-relieving precipitation for many locations in the Northeast.

Sandy Snowfall Totals
Sandy remnant-low snowfall totals

The remnant low pressure system from Hurricane Sandy dropped copious amounts of snow across the Southern and Central Appalachians as it moved westward after making landfall near Atlantic City, New Jersey on October 29th. Over a foot of snow was reported in six states from North Carolina to Pennsylvania, shattering October monthly snowfall records. Widespread, heavy snow of this magnitude during October has never been observed across this region. The largest snow totals occurred along the highest elevations of the Appalachians, with Mount Leconte, Tennessee receiving 33 inches of snow and Terra Alta, West Virginia measuring 36 inches. Very strong winds combined with the snow to create blizzard conditions for up to two days in some locations. The largest impacts of the storm were the massive power outages due to downed trees and power lines and building collapses because of the heavy, wet nature of the snow. Flooding was also a concern as warm temperatures returned quickly after the storm causing rapid melt and runoff.


Citing This Report

NOAA National Climatic Data Center, State of the Climate: National Snow & Ice for Annual 2012

bookmark_borderBrain Music: Improving Emergency Response Through Music

Every brain has a soundtrack. Its tempo and tone will vary, depending on mood, frame of mind, and other features of the brain itself. When recorded and played back to an emergency responder, say a firefighter, it may sharpen their reflexes during a crisis, and calm their nerves afterward.

Over the past decade, the influence of music on cognitive development, learning, and emotional well-being has emerged as a hot field of scientific study. To explore music’s potential relevance to emergency response, the Science & Technology Directorate (S&T) has begun a study into a form of neurotraining called “Brain Music” that uses music created in advance from listeners’ own brain waves to help them deal with common ailments like insomnia, fatigue, and headaches stemming from stressful environments.

“Because of the strains that come with an emergency response job, we are interested in finding ways to help these workers remain at the top of their game when working and get quality rest when they go off a shift,” said Department of Homeland Security (DHS) Program Manager Robert Burns. “Our goal is to find new ways to help first responders perform at the highest level possible, without increasing tasks, training, or stress levels.”

If the brain “composes” the music, the first job of scientists is to take down the notes. Each recording is converted into two unique musical compositions designed to trigger the body’s natural responses, for example, by improving productivity while at work, or helping adjust to constantly changing work hours. The compositions are clinically shown to promote one of two mental states in each individual: relaxation – for reduced stress and improved sleep; and alertness – for improved concentration and decision-making.

Each 2–6 minute track is a composition performed on a single instrument, usually a piano. The relaxation track may sound like a “melodic, subdued Chopin sonata,” while the alertness track may have “more of a Mozart sound,” according to Burns. (It seems there’s a classical genius—or maybe two genii—in all of us.) Listen to an example of an instrumental alert track.

After their brain waves are set to music, each person is given a specific listening schedule, such as once an hour for four hours each day, personalized to their work environment and needs. After an extended length of time, people may be able to listen to the music more sporadically. If used properly, the music can boost productivity and energy levels, or trigger a body’s natural responses to stress. A selected group of firefighters will be the first emergency responders taking part in the project.

The music is created by Human Bionics LLC, with the project conducted through the TechSolutions Program, in conjunction with the Human Factors Behavior Sciences Division. It is being tested as part of the Readiness Optimization Program (ROP), a wellness program that combines nutrition education and neurotraining to evaluate a cross population of first responders, including federal agents, police, and firefighters.

Since the ROP is supposed to help them sleep more soundly and eat healthier, the benefits should extend beyond the work environment and ultimately improve one’s entire life.

The nutrition component of the ROP has grown out of numerous clinical studies on nutrition and brain development, sleep, and aging, as well as from the fields of military and sports medicine. The Brain Music component is derived from patented technology developed at Moscow University to use brain waves as a feedback mechanism to correct physiological conditions.

The concept of Brain Music is to use the frequency, amplitude, and duration of musical sounds to move the brain from an anxious state to a more relaxed state. In British philosopher John Locke’s terms, Brain Music brings new meaning to his famous phrase: “A sound mind in a sound body, is a short, but full description of a happy state in this World.”

To request more information about this story, please e-mail st.snapshots@hq.dhs.gov.

bookmark_borderHot. Hot. Hot.

Australia — Temperatures in Australia are reaching high heights with the current heat wave. Bush fires are burning wild. Tomorrow, the  temperature is forecast as a high of 50 degrees… 50 centigrade… that’s 122 Fahrenheit.

bookmark_borderGlobal Warming And Climate Volatility

As part of the Human Induced Climate Change Experiment, we have been predicting the effects of global warming on climate volatility. Indeed, we have seen a marked severity in volatile weather systems.

2012 went down as the hottest year in recorded history. Though we are only several days into January, the year is already setting records. There has been snow in the deserts of China, record heat and wildfires in Australia… while record cold temperatures have killed hundreds in India.

bookmark_borderSnow Covered Desert

While snow coverage has been retreating in the Northeastern United States, the increased volatile weather systems being caused by global warming are causing it to snow in the desert.

Snow-Covered Desert

Snow-covered deserts are rare, but that’s exactly what the Moderate Resolution Imaging Spectroradiometer (MODIS) on NASA’s Aqua satellite observed as it passed over the Taklimakan Desert in western China on Jan. 2, 2013. Snow has covered much of the desert since a storm blew through the area on Dec. 26. The day after the storm, Chinese Central Television (CNTV) reported that the Xinjian Uygyr autonomous region was one of the areas hardest hit.

The Taklimakan is one of the world’s largest—and hottest—sandy deserts. Water flowing into the Tarim Basin has no outlet, so over the years, sediments have steadily accumulated. In parts of the desert, sand can pile up to 300 meters (roughly 1,000 feet) high. The mountains that enclose the sea of sand—the Tien Shan in the north and the Kunlun Shan in the south—were also covered with what appeared to be a significantly thicker layer of snow in January 2013.

Snow In The Desert
Snow In The Desert

bookmark_borderNorthern Hemisphere Snow Cover is Retreating

PHILADELPHIA, PA — What is up with the weather? Yes, we have seen some freaky storms over the past few years. Global warming is expected to cause volatile weather patterns. Indeed, that is what we have been experiencing; however, overall the Northern Hemisphere is showing a steady decline in snowfall.

NOAA:

Northern Hemisphere Snow Cover Extent
Average of monthly snow cover extent anomalies over Northern Hemisphere lands (including Greenland) since Nov 1966. Right: Seasonal snow cover extent over Northern Hemisphere lands since winter 1966-67. Calculated from NOAA snow maps. From BAMS State of the Climate in 2009 report.

Northern Hemisphere average annual snow cover has declined in recent decades. This pattern is consistent with warmer global temperatures. Some of the largest declines have been observed in the spring and summer months.

bookmark_borderEarthrise On Christmas

This photo of “Earthrise” over the lunar horizon was taken by the Apollo 8 crew on December 24, 1968, showing Earth for the first time as it appears from deep space.

Astronauts Frank Borman, Jim Lovell and William Anders had become the first humans to leave Earth orbit, entering lunar orbit on Christmas Eve. In a historic live broadcast that night, the crew took turns reading from the Book of Genesis, closing with a holiday wish from Commander Borman: “We close with good night, good luck, a Merry Christmas, and God bless all of you — all of you on the good Earth.”

Earthrise: First Color Photograph of Earth

bookmark_borderRocky Mountain Snow

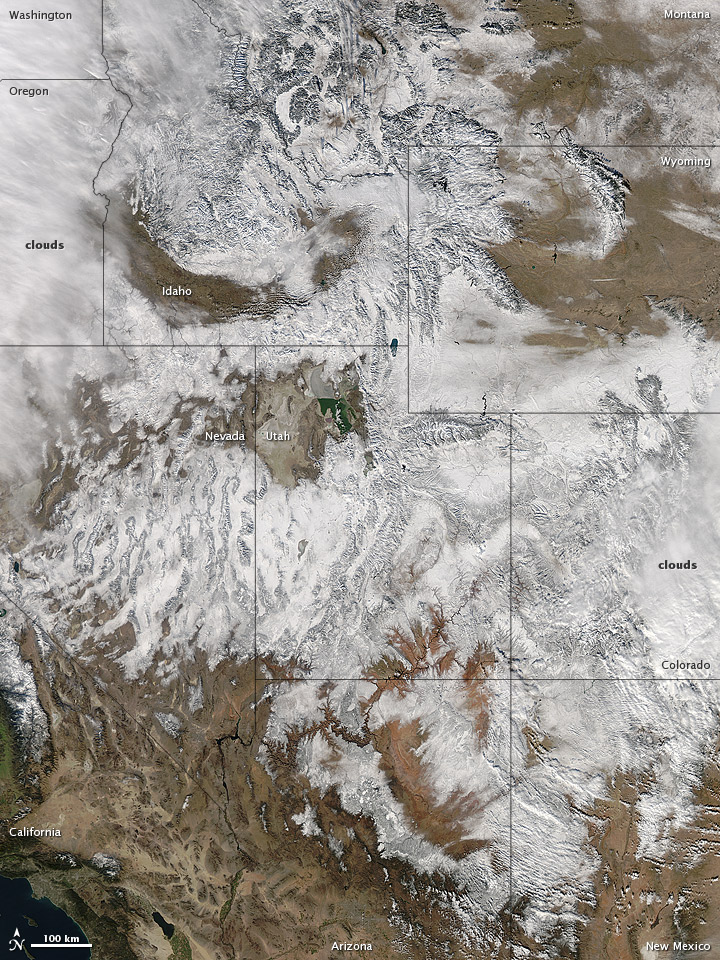
In time for the 2012 winter solstice, a storm dropped snow over most of the Rocky Mountains in the United States. On December 20, the National Weather Service reported snow depths exceeding 100 centimeters (39 inches) in some places—the result of the recent snowfall plus accumulation from earlier storms.

The Moderate Resolution Imaging Spectroradiometer (MODIS) on NASA’s Aqua satellite captured this natural-color image on December 19, 2012. Clouds had mostly cleared from the region, though some cloud cover lingered over parts of the Pacific Northwest and Colorado. Showing more distinct contours than the clouds, the snow cover stretched across the Rocky Mountains and the surrounding region, from Idaho to Arizona and from California to Colorado.

Snowfall did not stop in Colorado, as the storm continued moving eastward across the Midwest. By December 20, 2012, a combination of heavy snow and strong winds had closed schools, iced roads, and delayed flights, complicating plans for holiday travelers.

Though troublesome for travel, the snow brought much-needed moisture; multiple cities had set new records for consecutive days without measurable snow, CBS news reported. As of December 18, the U.S. Drought Monitor stated that a substantial portion of the continental United States continued to suffer from drought, and “exceptional” drought conditions extended from South Dakota to southern Texas.

Reference
CBS News. (2012, December 20) Snowstorm blows out of Rockies, into Midwest. Accessed December 20, 2012.
National Weather Service. (2012, December 20) National Snow Analyses. Accessed December 20, 2012.
University of Nebraska-Lincoln. (2012, December 18) U.S. Drought Monitor. Accessed December 20, 2012.

NASA image courtesy Jeff Schmaltz, LANCE MODIS Rapid Response. Caption by Michon Scott.

Instrument:
Aqua – MODIS

Rocky Mountain Snowstorm