bookmark_borderEscalating Climate Crisis: Extreme Weather Displaces Hundreds of Thousands in 2024

by Daniel Brouse
March 19, 2025

Not only was 2024 the hottest year on record, but it also set a record for the number of people displaced, including in the U.S.

  • The World Meteorological Organization (WMO) reported that 2024 was the hottest year on record, with global temperatures averaging 1.55°C above pre-industrial levels. This unprecedented heat contributed to the acceleration of glacier and sea ice loss, leading to a rise in sea levels. The temperature exceeds the 1.5°C limit set by the Paris Accord which is an important threshold for triggering tipping points. Nine tipping points have likely been crossed in the last 5 years. Tipping points are Critical Milestones that directly impact the rate of acceleration in climate change by multiplying the number and intensity of feedback loops. Identifying and understanding these tipping points is crucial for climate science and policymaking. Crossing multiple tipping points could lead to a domino effect, resulting in a much more rapid and severe climate change than currently projected.

  • The WMO also noted that extreme weather events in 2024, such as heatwaves, floods, and storms, displaced more than 800,000 people and caused significant crop losses. In the U.S., displacement was driven by multiple climate disasters, including an unprecedented hurricane season, widespread flooding, and prolonged heatwaves.

    Hurricanes Helene and Milton were among the most devastating storms to make landfall in 2024, forcing hundreds of thousands of people to evacuate in coastal regions, particularly in Florida, Louisiana, and the Carolinas. The hurricanes caused extensive infrastructure damage, with some communities still struggling to rebuild months later. Meanwhile, record-breaking flooding in the Midwest, exacerbated by heavier rainfall and rising river levels, displaced thousands of residents, washing away homes and farmlands.

    As 2025 began, the crisis continued with massive wildfires in California, driven by persistent drought and extreme heat. Entire towns were forced to evacuate, with some residents losing their homes permanently due to the rapidly spreading blazes. The Midwest and Southeast were also hit hard in March 2025 by one of the worst tornado outbreaks in recent history, leaving entire neighborhoods uninhabitable and displacing thousands. The increasing frequency and intensity of these disasters underscore the growing impact of climate change on population displacement in the U.S. and the urgent need for stronger adaptation measures.

  • Additionally, a study revealed that ‘climate whiplash’—abrupt shifts between extreme wet (violent rain) and dry conditions—is increasingly affecting major cities worldwide. This phenomenon complicates disaster preparedness and recovery efforts, underscoring the urgent need for global action to adapt to these changes.

    Mass, velocity, and density determine the severity of extreme rain events, and all three are increasing as both wind and rainfall intensify. The interaction of these factors amplifies flow forces, with wind and water forces scaling proportionally to the square of velocity. This means that as wind speeds rise due to more intense heating or heavier rainfall, the resulting damage increases exponentially. According to drag physics, force is proportional to density times the square of velocity.

    For example, a 20-mile-per-hour wind exerts four times the force of a 10-mile-per-hour wind, while a 40-mile-per-hour wind exerts 16 times the force. At 50 miles per hour, the force is 25 times greater, and at 60 miles per hour, it is 36 times greater than at 10 miles per hour. When factoring in density, the impact becomes even more severe: water is approximately 800 times denser than air, meaning that a 10-mile-per-hour water flow exerts 800 times the force of a 10-mile-per-hour wind.

    As climate change accelerates, increasing flow velocities will lead to exponentially greater destructive forces. While the precise extent of future velocity increases remains uncertain, the consequences are already visible—overwhelmed flood and sewage systems, collapsing hillsides, and widespread infrastructure failures. Without urgent adaptation measures, these escalating forces will continue to cause greater damage to communities and ecosystems.

    The increasing frequency of extreme rain events is occurring alongside cycles of severe drought, creating a destructive feedback loop. Prolonged drought leaves the land parched and less able to absorb water, making it highly susceptible to erosion, flash flooding, and landslides when heavy rains arrive. This combination intensifies devastation, as dry, compacted soil repels water, leading to rapid runoff, more severe flooding, and long-term degradation of topsoil, which further reduces the land’s ability to recover.

These findings emphasize the escalating impact of climate change on human displacement and the critical importance of implementing effective climate adaptation and mitigation strategies.
 

The Human Induced Climate Change Experiment

bookmark_borderConvincing a Climate Change Denier of Reality

By Daniel Brouse

Our climate model uses chaos theory in an attempt to adequately account for humans and forecasts a global average temperature increase of 9 degrees Celsius above pre-industrial levels. Everybody has the responsibility not to pollute. There are plenty of things you can do to help save the planet. Stop using fossil fuels. Consume less. Love more. Here is a list of additional actions you can take.

Convincing a climate change denier of the reality and urgency of the climate crisis can be challenging, but a strategic approach using clear, relatable, and credible information can be effective. Here are some steps to consider:

1. Personalize the Impact

People are often more convinced by information that directly affects them or their loved ones.

Example:

  • Extreme Weather Events: Discuss recent extreme weather events, such as the record heatwaves, wildfires, or hurricanes, and how these events have affected their local area or places they care about. Use data and visuals to show the increasing frequency and intensity of these events.
  • Health Impacts: Explain how climate change is affecting air quality, leading to respiratory issues, allergies, and other health problems. Highlight any local air quality alerts and their impacts on health.

2. Present Credible Scientific Evidence

Use data and statements from reputable scientific organizations and experts.

Example:

  • IPCC Reports: Refer to the Intergovernmental Panel on Climate Change (IPCC) reports, which are comprehensive reviews by thousands of scientists worldwide. Highlight key findings that show the human influence on climate change.
  • NASA and NOAA: Use data from NASA and the National Oceanic and Atmospheric Administration (NOAA) that show trends in global temperatures, sea-level rise, and shrinking ice sheets.

3. Economic and Security Arguments

Frame climate change in terms of its economic and national security impacts, which can be more persuasive for some individuals.

Example:

  • Economic Costs: Discuss the financial impact of climate change-related disasters. For instance, the billions of dollars spent on recovery from hurricanes, floods, and wildfires.
  • Job Creation: Highlight how investing in renewable energy and green technologies can create jobs and drive economic growth.
  • National Security: Cite statements from defense agencies and experts who warn that climate change poses significant risks to national and global security, leading to conflicts over resources and mass migrations.

4. Visual Evidence

Visuals can be more powerful than words. Use before-and-after images, graphs, and videos to illustrate the changes in the environment.

Example:

  • Glacier Retreat: Show time-lapse images of glaciers shrinking over the past few decades.
  • Sea Level Rise: Use maps and simulations that show the impact of rising sea levels on coastal communities.

5. Testimonials and Personal Stories

Personal stories from people affected by climate change can be very compelling.

Example:

  • Farmers and Fishermen: Share stories from farmers who are experiencing changes in growing seasons and crop yields or fishermen who are seeing changes in fish populations.
  • Residents of Impacted Areas: Use testimonials from residents of areas hit by severe weather events or rising sea levels.

6. Addressing Misconceptions

Directly address common misconceptions with clear, factual explanations.

Example:

  • Climate vs. Weather: Explain the difference between weather (short-term) and climate (long-term trends). Use analogies like comparing the daily fluctuations of the stock market (weather) to long-term economic growth (climate).
  • Historical Climate Change: Clarify that while the Earth’s climate has changed in the past, the current rate of change is unprecedented and largely driven by human activities.

References

  1. IPCC Reports
  2. NASA Global Climate Change
  3. NOAA Climate

Example Conversation

  • You: “Have you noticed how our summers are getting hotter and the winters less predictable? That’s climate change in action. Scientists from NASA and NOAA have been tracking these changes for decades.”
  • Denier: “But the climate has always changed.”
  • You: “True, but the rate at which it’s changing now is much faster. For example, the IPCC report shows that the current warming is about ten times faster than the average rate of ice-age-recovery warming. And it’s largely due to human activities like burning fossil fuels.”

By combining personal relevance, credible scientific evidence, economic implications, visual aids, personal stories, and addressing misconceptions, you can create a compelling argument to help a climate change denier understand the reality and urgency of the issue.

Some people appear numb or compassion-less about climate change for several reasons:

Psychological Distance

  1. Temporal Distance:
    • People perceive climate change impacts as happening in the distant future, reducing their sense of urgency and immediate concern .
  2. Spatial Distance:
    • Climate change effects are often seen as occurring in far-off places, affecting other people rather than one’s immediate environment .
  3. Social Distance:
    • Individuals might think climate change primarily impacts people who are different from them, such as those in different countries or socio-economic groups .

Cognitive Dissonance and Denial

  1. Cognitive Dissonance:
    • Confronting the reality of climate change can create psychological discomfort due to the conflict between awareness of the problem and the continuation of behaviors contributing to it. This can lead to denial or downplaying of the issue to reduce this discomfort .
  2. Denial and Defense Mechanisms:
    • Some people use denial as a defense mechanism to avoid the anxiety and fear associated with the overwhelming nature of climate change .

Lack of Awareness and Misinformation

  1. Information Deficit:
    • A lack of understanding or misinformation about climate change can lead to apathy. Many people might not fully grasp the science behind climate change or the severity of its impacts .
  2. Misinformation:
    • The spread of false information and climate change denial campaigns can confuse the public and diminish the perceived importance of the issue .

Psychological Barriers

  1. Perceived Inefficacy:
    • Feelings of helplessness or the belief that individual actions cannot make a difference can lead to disengagement. When people feel their efforts are futile, they are less likely to care or act .
  2. Optimism Bias:
    • Some individuals believe that technological advancements or future solutions will solve the problem without requiring immediate personal or societal changes .

Socio-Political Influences

  1. Political Ideology:
    • Political beliefs and affiliations significantly influence one’s stance on climate change. Conservative ideologies often correlate with skepticism about climate change, influenced by party lines and media sources .
  2. Economic Concerns:
    • Fear of economic repercussions, such as job losses in certain industries, can lead to resistance against acknowledging or addressing climate change .

Social Norms and Peer Influence

  1. Social Norms:
    • People tend to conform to the beliefs and behaviors of their social group. If climate change concern is not a norm within their community, they are less likely to prioritize it .
  2. Peer Influence:
    • The attitudes of peers and influential figures in one’s life can significantly impact one’s views on climate change. Lack of concern among peers can lead to similar attitudes .

References

  1. PsyPost – Temporal distance reduces concern about climate change
  2. Environmental Research Communications – Spatial distance affects climate change risk perception
  3. Climate Outreach – Climate change and social distance
  4. American Psychological Association – Cognitive Dissonance and Climate Change
  5. Psychology Today – Denial and Climate Change
  6. National Geographic – Lack of knowledge and climate change
  7. Nature – Misinformation and Climate Change
  8. ScienceDirect – Perceived Inefficacy and Climate Change
  9. Pew Research Center – Optimism Bias and Climate Change
  10. The Guardian – Political Ideology and Climate Change
  11. Forbes – Economic Concerns and Climate Change
  12. Journal of Environmental Psychology – Social Norms and Climate Change
  13. Harvard Business Review – Peer Influence and Climate Change

The Human Induced Climate Change Experiment

bookmark_borderUnderstanding Straight-Line Winds and Climate Change

By Daniel Brouse
May 18, 2024

Weather Like the Deadly Houston Windstorm Is Being Fueled in Part by Climate Change

Scientists have detected an increase since the 1980s in what are known as straight-line winds, and climate change is playing a significant role. These winds, which are often associated with severe thunderstorms, can reach speeds exceeding 100 mph and cause damage similar to that of a tornado, but they move along a straight path.

Understanding Straight-Line Winds

Straight-line winds, also known as derechos when they cover a particularly large area, are powerful, sustained winds that originate from downdrafts in thunderstorms. Unlike the rotating winds of a tornado, straight-line winds blow in a single direction, hence their name. These winds can flatten trees, knock down power lines, and cause extensive damage to buildings and infrastructure.

The Role of Climate Change

Recent studies indicate that climate change is contributing to an increase in the frequency and intensity of these wind events. The following factors explain how climate change is influencing straight-line winds:

  1. Increased Atmospheric Instability: As global temperatures rise, the atmosphere becomes more unstable. Warmer air holds more moisture, leading to more intense thunderstorms, which are a primary source of straight-line winds. The increased energy in the atmosphere enhances the formation of severe weather systems capable of producing strong downdrafts.
  2. Enhanced Convective Available Potential Energy (CAPE): CAPE is a measure of the energy available for convection, which is a key process in the formation of thunderstorms. Higher CAPE values are associated with more vigorous updrafts and downdrafts, resulting in stronger winds. Climate change is leading to higher CAPE values in many regions, contributing to more powerful straight-line winds.
  3. Changing Wind Patterns: Climate change is altering global wind patterns, which can influence the development and movement of severe weather systems. These changes can result in more frequent and intense straight-line wind events, particularly in areas that are becoming more prone to severe thunderstorms.

The Impact of Straight-Line Winds

The deadly Houston windstorm is a stark reminder of the destructive power of straight-line winds. The storm left a trail of devastation, with thousands of residents losing power and homes being damaged or destroyed. The aftermath of such storms can be particularly dangerous during extreme weather events like heatwaves, which are also becoming more common due to climate change.

Conclusion

As the climate continues to change, the occurrence of extreme weather events like straight-line winds is expected to increase. This poses significant challenges for communities, infrastructure, and emergency response systems. Understanding the role of climate change in these events is crucial for developing strategies to mitigate their impact and enhance resilience against future storms. Scientists and policymakers must work together to address the root causes of climate change and implement measures to protect vulnerable populations from the growing threat of severe weather.

What Can I Do?
Our climate model uses chaos theory in an attempt to adequately account for humans and forecasts a global average temperature increase of 9℃ above pre-industrial levels. Everybody has the responsibility not to pollute. There are plenty of things you can do to help save the planet. Stop using fossil fuels. Consume less. Love more. Here is a list of additional actions you can take.

How is All Real Estate at Risk From Climate Change?

The Human Induced Climate Change Experiment

bookmark_borderChaos Theory: Evolving Winter Atmospheric Teleconnection Patterns

By Daniel Brouse

  1. Teleconnections: Teleconnections refer to climate anomalies and patterns that occur over large distances and are often linked to each other. These connections can manifest as recurring climate patterns, such as El Nino and La Nina events, the North Atlantic Oscillation (NAO), and the Southern Oscillation (SO). Teleconnections can influence weather and climate conditions globally, impacting precipitation, temperature, and atmospheric circulation patterns.
    • El Nino and La Nina: These are phases of the El Nino-Southern Oscillation (ENSO) phenomenon, characterized by anomalous warming (El Nino) or cooling (La Nino) of sea surface temperatures in the tropical Pacific Ocean. These events can lead to widespread changes in weather patterns worldwide, affecting rainfall, temperatures, and storm activity.
    • North Atlantic Oscillation (NAO): The NAO is a climate pattern characterized by changes in atmospheric pressure differences between the Icelandic Low and the Azores High over the North Atlantic Ocean. It influences weather patterns in North America, Europe, and North Africa, impacting temperatures, storm tracks, and precipitation patterns.
    • Southern Oscillation (SO): The SO is closely related to ENSO and refers to the atmospheric component of the El Nino-Southern Oscillation system. It influences weather patterns across the globe, particularly in the tropical Pacific region.
  2. Chaos Theory: Chaos theory emphasizes the inherent complexity and unpredictability of dynamic systems, such as the Earth’s climate system. It recognizes that small changes in initial conditions can lead to significant and unpredictable outcomes over time. In the context of climate change, chaos theory underscores the nonlinear interactions between various components of the climate system, including the atmosphere, oceans, ice, and biosphere.
    • Sensitive Dependence on Initial Conditions: Chaos theory highlights the sensitivity of complex systems to initial conditions, where small variations can amplify and lead to divergent outcomes. In the climate system, this sensitivity can manifest as abrupt shifts, tipping points, and feedback loops, contributing to nonlinear responses to external forcings like greenhouse gas emissions.
    • Emergent Behavior: Complex systems exhibit emergent behavior, where collective interactions between individual components give rise to new and often unpredictable phenomena. Climate change can lead to emergent properties such as extreme weather events, shifts in climate regimes, and changes in ecosystem dynamics.
    • Nonlinear Dynamics: Climate systems often exhibit nonlinear dynamics, meaning that changes in one component can trigger nonlinear responses in other parts of the system. This complexity makes it challenging to accurately model and predict the long-term impacts of climate change.

The study, “Evolving winter atmospheric teleconnection patterns and their potential triggers across western North American-Patterns” reports:

We present a comprehensive analysis diagnosing the primary factors driving the observed changes in major atmospheric teleconnection patterns in the Northern Hemisphere winter, including the Pacific North American pattern (PNA), North Atlantic Oscillation (NAO), and North American winter dipole (NAWD), with particular focus on their roles in shaping anomalous weather across North America. Our investigation reveals a consistent influence of the NAWD over seven decades, contrasting with fluctuating impacts from PNA and minor impacts from NAO. In particular, an emergent negative correlation between the NAWD and PNA, signaling a shifted phase of teleconnection patterns, is identified. Such a relationship change is traced to enhanced upper-level ridges across western North America, reflecting a reinforced winter stationary wave. Through attribution analysis, we identify greenhouse gas emissions as a probable driver for the northward drift of the Asia-Pacific jet core, which, aided by orographic lifting over the Alaskan Range, subsequently amplifies the winter stationary wave across western North America. This work emphasizes the pronounced effect of human-induced global warming on the structure and teleconnection of large-scale atmospheric circulation in the Northern Hemisphere winter, providing vital perspectives on the dynamics of current climate trends.

Chaos theory offers insights into the complex dynamics of the Earth’s atmosphere, particularly regarding the interactions between different atmospheric teleconnection patterns and their response to external forcings such as greenhouse gas emissions. Chaos theory can help elucidate how seemingly minor changes in atmospheric circulation patterns can lead to significant and often unpredictable changes in weather patterns across North America.

The analysis highlights the interplay between major atmospheric teleconnection patterns in the Northern Hemisphere winter, including the Pacific North American pattern (PNA), North Atlantic Oscillation (NAO), and North American winter dipole (NAWD). These patterns are known to influence weather conditions over vast regions and are sensitive to external drivers such as greenhouse gas emissions.

Chaos theory suggests that even small perturbations in the atmosphere, such as changes in temperature or pressure, can lead to nonlinear responses and amplify into larger-scale changes in weather patterns. In this case, the study identifies a consistent influence of the NAWD over several decades, indicating a robust relationship between this teleconnection pattern and anomalous weather across North America.

The emergence of a negative correlation between the NAWD and PNA, signaling a shifted phase of teleconnection patterns, is particularly noteworthy. This shift reflects a complex interplay of atmospheric dynamics, including the amplification of winter stationary waves across western North America.

Moreover, chaos theory underscores the role of human-induced global warming as a probable driver for these changes in atmospheric circulation. Greenhouse gas emissions are identified as a key factor contributing to the northward drift of the Asia-Pacific jet core, which, in turn, amplifies the winter stationary wave across western North America. This highlights the interconnectedness of human activities and Earth’s climate system, with potentially far-reaching consequences for weather patterns and climate trends.

Chaos theory provides a framework for understanding the intricate and often nonlinear relationships between atmospheric teleconnection patterns, external forcings, and the dynamics of current climate trends. By applying chaos theory principles, researchers can gain vital perspectives on the complex interactions shaping Earth’s climate system and inform efforts to mitigate and adapt to climate change.

Chaos Theory and Climate Systems

bookmark_borderExtreme Weather and Violent Rain

by Daniel Brouse

Between April 1 and 4, Southeastern Pennsylvania experienced another severe weather event attributed to atmospheric rivers and strong winds. Rainfall accumulation exceeded 3 inches, accompanied by wind gusts ranging from 35 to 45 mph. Tragically, two individuals lost their lives in unrelated incidents, one in Montgomery County and the other in Delaware County, when trees collapsed onto their vehicles.

Part of the The Philadelphia Violent Rain Experiment
The Greater Philadelphia Area serves as our focal point for studying non-coastal violent rain events. Although situated 78 miles from the nearest coast, Philadelphia has experienced a surge in violent rainstorms since 2021, with each episode yielding more precipitation than the typical monthly average. In addition to enduring Nor’easters and tropical storms from the Southeast, Philadelphia is increasingly subjected to deluges originating from the Gulf of Mexico.

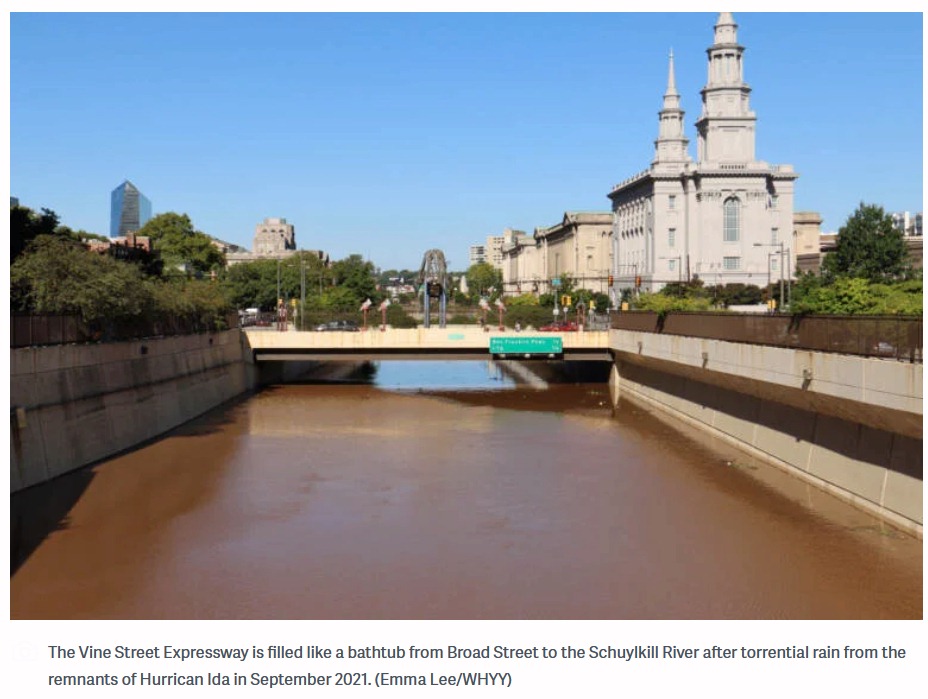
Vine Street Expressway Flooded

Hurricane Ida in the summer of 2021 is a good example. Because of the 85 degrees Fahrenheit Gulf of Mexico ocean temperature, Ida rapidly gained strength right before it made landfall jumping from a Category 1 to a Category 4 storm. The warm air allowed more moisture to be carried as rain. The storm was so large that it was able to pick up more moisture from the Atlantic Ocean. After destroying parts of Florida, the ocean moisture was carried inland and dumped over places like Pennsylvania and New York. Ida caused record flood damage in parts of Pennsylvania. The Philadelphia Inquirer reported, “The remnants of Hurricane Ida destroyed or damaged hundreds of homes in Southeastern Pennsylvania and caused more than $100 million in public infrastructure damage across the state.” There were more deaths in the Northeastern USA than where the storm made landfall in Louisiana. The New York Times reported, “The remnants of Hurricane Ida caused flash flooding and a number of deaths and disrupted transit across parts of New York and New Jersey. The storm killed at least 43 people in New York, New Jersey, Pennsylvania and Connecticut and left more than 150,000 homes without power.” Ida’s Philadelphia area destruction included 5 deaths, 7 tornadoes, record flooding, hundreds of water rescues, and “one incredibly soggy mess.” The violent rain in Philadelphia was so extreme that the main road across the city from the Delaware River to the Schuylkill River, the Vine Street Expressway, was turned into a canal. “You could’ve swam from 22nd Street to about 15th Street,” said Justin Galbreath, a district maintenance manager at the Pennsylvania Department of Transportation. As climate change intensifies, the frequency of Vine Street becoming a river will likely increase until such time as it becomes permanent.

The train derailment in Plymouth Meeting (July 17, 2023), the eleven vehicles swept away, and the seven people drowned by flood waters in Washington Crossing (July 15, 2023) were caused by a deluge of rain and flash flooding. “In my 44 years, I’ve never seen anything like it,” Upper Makefield Fire Chief Tim Brewer said. “When the water came up, it came up very swiftly. We do not think that anybody drove into it, that they were actively on that road when it happened.” CBS news reported, “Over 6 inches of rain in an hour caused the flash flooding according to Brewer. The fire department was dispatched in that area for a lightning strike and just by happenstance they found 11 cars. Eight people were rescued from the cars and two from the creek.” In July and December of 2023, extreme rainfall resulted in sinkholes being exposed in the carbonate rock under Route 202 in nearby King of Prussia, PA.

In September of 2023, the Philadelphia Inquirer reported, “The remnants of Tropical Storm Ophelia soaked the entire Philadelphia region with episodic downpours on Saturday, the first day of fall, conspiring to incite 60-mph wind gusts at the Shore and high-tide flooding that closed numerous roads in beach and back-bay towns.” There were up to 8 inches of rain recorded throughout the Philadelphia region over the three day event.

The winter of 2023 saw near weekly atmospheric river flash flooding events. On January 9, the Greater Philadelphia Region incurred an historic winter tropical violent rain event. CBS news reported, “If it feels like it’s been an abnormally rainy few weeks, you’re right. Normal rainfall totals between Dec. 1 and Jan. 9 amount to about 4.78 inches. Between December 2023 and Tuesday, we’d already recorded more than 9 inches of rain, an amount normally recorded in December, January and February combined.” The January 9 storm brought over 4 inches of rain to many areas. The Delaware River peaked at its highest level ever. There were hurricane strength winds with wind gusts over 70mph.

On March 23, 2024, Philadelphia witnessed its wettest March day on record. The rain gauge at the airport measured over 3 inches of rainfall, with parts of New Castle County, Delaware, also receiving over 3 inches. Some areas in Gloucester County and Camden County, New Jersey, recorded rainfall exceeding 4 inches. The precipitation observed on that day was roughly equivalent to the typical rainfall for the entire month. A young girl was swept away by the rapidly rising and swift moving waters of the Chester Creek in Delaware County, PA.

On the same day, an atmospheric river event brought heavy rains to Brazil’s Rio de Janeiro state, resulting in at least nine fatalities, with Petropolis being the hardest hit. A staggering 270 mm (11 inches) of rain fell within 24 hours, significantly impacting the region and leading to numerous incidents, including landslides and house collapses.

The Human Induced Climate Change Experiment

bookmark_border9 Climate Change Tipping Points Crossed

By Daniel Brouse
March 28, 2024

Tipping points are Critical Milestones that directly impact the rate of acceleration in climate change by multiplying the number and intensity of feedback loops. Identifying and understanding these tipping points is crucial for climate science and policymaking. Crossing multiple tipping points could lead to a domino effect, resulting in a much more rapid and severe climate change than currently projected.

A look at nine (9) of the multiple tipping points that are in play during 2024. The first dominoes have fallen and will continue to knock down more tiles with each escalating step. The crossing of these nine climate tipping points represents a critical threshold in the Earth’s climate system, with potentially irreversible consequences for global ecosystems and human societies:

  1. Greenland Ice Sheet Collapse: The melting of the Greenland Ice Sheet has accelerated in recent years, leading to increased rates of ice loss and sea level rise. As glaciers retreat and ice shelves collapse, vast quantities of freshwater enter the ocean, disrupting marine ecosystems and contributing to global sea level rise.
  2. West Antarctic Ice Sheet Collapse: Similar to Greenland, the West Antarctic Ice Sheet is experiencing rapid melting and destabilization. The collapse of this ice sheet has the potential to raise sea levels by several meters, inundating coastal areas and triggering widespread impacts on infrastructure, agriculture, and human populations.
  3. Labrador-Irminger Seas/SPG Convection Collapse: The collapse of convection in the Labrador-Irminger Seas, part of the North Atlantic Ocean, could disrupt the Atlantic Meridional Overturning Circulation (AMOC). This circulation pattern plays a crucial role in regulating global climate and ocean circulation, influencing weather patterns and heat distribution worldwide.
  4. East Antarctic Subglacial Basins Collapse: The East Antarctic Ice Sheet contains vast quantities of ice, much of which is grounded below sea level. The collapse of subglacial basins in East Antarctica could lead to rapid ice loss and contribute to sea level rise, with potentially far-reaching consequences for coastal regions and global climate stability.
  5. Arctic Winter Sea Ice Collapse: Arctic sea ice has been declining rapidly in extent and thickness due to rising temperatures. The loss of winter sea ice in the Arctic not only accelerates regional warming but also affects global weather patterns, ocean circulation, and biodiversity in the Arctic ecosystem.
  6. East Antarctic Ice Sheet Collapse: While traditionally considered more stable than its western counterpart, the East Antarctic Ice Sheet is also vulnerable to collapse under continued warming. The disintegration of ice shelves and glaciers in East Antarctica could significantly contribute to sea level rise and alter ocean circulation patterns.
  7. Amazon Rainforest Dieback: Deforestation, drought, and climate change threaten the resilience of the Amazon Rainforest, the world’s largest tropical rainforest. The dieback of the Amazon could result in decreased rainfall, increased carbon emissions, and loss of biodiversity, impacting regional and global climate systems.
  8. Boreal Permafrost Collapse: Permafrost in the northern regions of the globe contains vast stores of carbon in the form of frozen organic matter. As permafrost thaws due to rising temperatures, it releases greenhouse gases such as methane and carbon dioxide, further exacerbating climate change and creating a feedback loop of increased warming.
  9. Atlantic Meridional Overturning Circulation Collapse: The collapse of the AMOC, driven by changes in ocean temperature and salinity, could have profound consequences for global climate stability. Disruption of this circulation pattern could lead to abrupt shifts in weather patterns, including changes in temperature, precipitation, and ocean currents, with far-reaching impacts on ecosystems and human societies.

The crossing of these tipping points underscores the urgent need for decisive action to mitigate climate change and adapt to its impacts. Without concerted efforts to reduce greenhouse gas emissions and protect vulnerable ecosystems, the consequences of these tipping points could pose significant challenges to the well-being of present and future generations.

Toppled Tipping Points: The Domino Effect Brouse and Mukherjee (2023)

Coral Reefs’ Tipping Point Brouse (2024)

Tipping Cascades, Social-Ecological Systems, and the Hottest Year in History Brouse (2024)

Chaos Theory and Climate Change Brouse and Mukherjee (2024)

bookmark_borderEnso-Neutral Not So Neutral

by Daniel Brouse

The neutral phase of the El Niño-Southern Oscillation (ENSO) occurs when water temperature anomalies in the eastern and central Pacific range between 0.5 °C and -0.5 °C. During this period, neither La Niña nor El Niño conditions dominate, and it is sometimes humorously referred to as “La Nada”; however, ENSO-neutral is anything but neutral nor normal.

ENSO-neutral refers to a phase in the El Niño-Southern Oscillation (ENSO) cycle when neither El Niño nor La Niña conditions are present in the tropical Pacific Ocean. Climate change can influence ENSO-neutral conditions in several ways:

  1. Increased Frequency and Intensity of Extremes: Climate change can lead to more frequent and intense weather extremes, such as heatwaves, droughts, and heavy rainfall events, even during ENSO-neutral periods. These extremes can occur independently of El Niño or La Niña events and may be exacerbated by rising global temperatures.
  2. Shifts in Atmospheric Circulation Patterns: Climate change can alter atmospheric circulation patterns globally, affecting the behavior of the jet stream and other large-scale wind patterns. These changes can influence the onset, strength, and duration of ENSO-neutral conditions and may lead to shifts in regional weather patterns.
  3. Sea Surface Temperature Anomalies: While ENSO-neutral conditions are characterized by near-average sea surface temperatures (SSTs) in the tropical Pacific, climate change can contribute to overall warming of ocean waters. This background warming may influence the baseline SSTs during ENSO-neutral periods and can potentially impact weather patterns and ocean circulation.
  4. Teleconnections: Climate change can modify teleconnections, which are large-scale atmospheric linkages that connect distant regions of the globe. These teleconnections play a significant role in shaping weather and climate patterns during ENSO-neutral periods. Changes in teleconnections may alter the impacts of ENSO-neutral conditions on weather and climate variability in different regions.

Overall, while ENSO-neutral conditions may not directly result from climate change, the broader changes occurring in the climate system can influence the characteristics and impacts of these neutral periods. Understanding these interactions is essential for improving our ability to predict and adapt to future climate variability and extremes.

Atmosphere-Soil-Ocean Coupling:

  1. Teleconnections:
    • Chaos theory recognizes the concept of teleconnections, where seemingly unrelated events in one part of the Earth system influence conditions in another. For instance, changes in sea surface temperatures (linked to ocean dynamics) can affect atmospheric circulation patterns, leading to variations in precipitation and temperature on land.
  2. Climate Variability:
    • The complex interactions between soil, atmosphere, and oceans contribute to climate variability. Chaos theory helps to understand the sensitivity of the climate system to initial conditions and how small perturbations in one component can lead to significant and sometimes unpredictable outcomes.

In 2023, the world experienced an El Niño phase, which typically reduces hurricane activity. However, the climate pattern shifted towards La Niña in 2024. La Niña patterns often amplify the Atlantic hurricane season, particularly concerning when paired with months-long streaks of record warmth across the Atlantic Ocean.

* Our climate model employs chaos theory to comprehensively consider human impacts and projects a potential global average temperature increase of 9 degrees Celsius above pre-industrial levels.

How is All Real Estate at Risk From Climate Change?

The Human Induced Climate Change Experiment

bookmark_borderClimate Change: Camelot’s Resurgence

Camelot’s Resurgence: A Musical Odyssey Through Mythical Metaphors of Climate Change at the Round Table

The legend of King Arthur, the Round Table, and Camelot can be metaphorically related to human-induced climate change in various ways:

  1. Unified Effort and Global Cooperation:
    • Metaphor: The Round Table represents equality and unity among Arthur’s knights, highlighting the idea of collaboration and shared responsibility.
    • Climate Change Connection: Addressing climate change requires global cooperation and shared efforts. The metaphor suggests that, like the knights gathered around the Round Table, nations need to unite in facing the common challenge of climate change.
  2. Camelot as a Sustainable Utopia:
    • Metaphor: Camelot is often portrayed as an idealized, utopian kingdom where justice, equality, and chivalry prevail.
    • Climate Change Connection: The metaphor implies that addressing climate change requires envisioning and striving for sustainable and environmentally conscious societies. Camelot serves as a symbol for the kind of world we should aim to create to mitigate the impact of climate change.
  3. The Sword in the Stone as Responsibility:
    • Metaphor: Arthur pulling the sword from the stone signifies his acceptance of responsibility and destiny as the rightful king.
    • Climate Change Connection: The metaphor can be linked to the acknowledgment of the responsibility humans hold in causing and mitigating climate change. Just as Arthur takes up the responsibility of leading, humanity must take responsibility for its impact on the environment.
  4. The Betrayal of Lancelot and Guinevere as Human Failings:
    • Metaphor: The affair between Lancelot and Guinevere, leading to Camelot’s downfall, represents the betrayal and moral failings of individuals within the kingdom.
    • Climate Change Connection: The metaphor reflects the human tendencies that contribute to environmental degradation, such as exploitation of natural resources, overconsumption, and the neglect of sustainable practices.
  5. Mordred’s Betrayal as Ignoring Warning Signs:
    • Metaphor: Mordred’s betrayal, often driven by a thirst for power, represents the consequences of ignoring warning signs and neglecting the environment.
    • Climate Change Connection: The metaphor aligns with the consequences of ignoring early warnings and scientific evidence regarding climate change. Human actions, driven by short-term interests, can lead to irreversible damage.

In summary, the King Arthur legend serves as a metaphor for the collective human experience in facing challenges like climate change. It emphasizes the importance of unity, responsibility, sustainability, and the consequences of moral failings and neglect.

From the album: Camelot’s Resurgence

bookmark_borderCoral Reefs’ Tipping Point

by Daniel Brouse
February 14, 2024

Coral reefs confront unprecedented challenges arising from various stressors, many of which are directly tied to human activities. Some of these stressors possess critical tipping points, surpassing which can lead to the collapse of coral ecosystems. According to the European Geosciences Union’s statement on January 2, 2024, specific tipping points include a temperature increase of 1.2℃ above pre-industrial levels and atmospheric CO2 concentrations exceeding 350 parts per million. Disturbingly, as of February 2024, the Earth’s yearly average temperature has already risen to +1.5℃, underscoring the urgency of addressing climate-related threats to coral reefs.

Climate change is having significant and detrimental effects on coral reefs around the world. Some of the key impacts include:

  1. Coral Bleaching:
    • One of the most immediate and visible impacts of climate change on coral reefs is coral bleaching. Elevated sea temperatures cause corals to expel the symbiotic algae (zooxanthellae) living within their tissues. Without these algae, corals lose their vibrant colors and become more susceptible to stress, disease, and death. While corals can recover from mild bleaching events, severe or prolonged bleaching can lead to widespread coral mortality.
  2. Ocean Acidification:
    • Increased carbon dioxide (CO2) levels in the atmosphere not only contribute to global warming but also lead to ocean acidification. The absorption of excess CO2 by the oceans results in a decrease in pH, making the water more acidic. This acidification can weaken coral skeletons and hinder the ability of corals to build and maintain their calcium carbonate structures.
  3. Sea Level Rise:
    • Rising global temperatures contribute to the melting of polar ice caps and glaciers, causing sea levels to rise. Elevated sea levels can lead to increased stress on coral reefs, especially those located in shallow waters. This can result in reduced sunlight reaching the corals and increased sedimentation, impacting their growth and survival.
  4. Extreme Weather Events:
    • Climate change is linked to an increase in the frequency and intensity of extreme weather events, such as hurricanes and cyclones. These events can physically damage coral reefs by causing coral breakage, dislodgment, and destruction of the reef structure. The recovery time for damaged reefs is often extended, making them more vulnerable to subsequent disturbances.
  5. Changes in Ocean Circulation:
    • Climate change can alter ocean currents and circulation patterns. Changes in water flow can affect the distribution of nutrients and impact the resilience of coral reefs. Some regions may experience altered temperature regimes, nutrient imbalances, and disruptions in the supply of food sources for corals and their associated ecosystems.
  6. Shifts in Coral Species Distribution:
    • As sea temperatures change and habitats are modified, the distribution of coral species may shift. Some species may migrate to cooler waters, while others may struggle to adapt or face local extinctions. These shifts can disrupt the balance of ecosystems and affect the biodiversity associated with coral reefs.

The cumulative impact of these climate-related stressors poses a severe threat to coral reefs worldwide. It’s crucial to address the root causes of climate change and implement conservation measures to enhance the resilience of coral ecosystems. Protection of coral reefs involves both local and global efforts, including sustainable fishing practices, marine protected areas, reducing greenhouse gas emissions, and promoting coral reef restoration initiatives.

Coral reef ecosystems can be influenced by several feedback loops that contribute to reaching tipping points. These feedback loops often involve interactions between various environmental stressors and the responses of coral reefs. Here are some feedback loops associated with the coral reef tipping point:

  1. Coral Bleaching Feedback Loop:
    • Mechanism: Elevated sea temperatures, driven by climate change, can trigger coral bleaching, where corals expel their symbiotic algae.
    • Effect: As bleaching occurs, corals become stressed and more susceptible to diseases. If bleaching is severe or occurs frequently, it weakens coral resilience and can lead to widespread coral mortality, reducing the ability of the reef to recover.
  2. Ocean Acidification and Coral Growth Feedback Loop:
    • Mechanism: Increased atmospheric carbon dioxide (CO2) leads to ocean acidification, hindering the ability of corals to build and maintain their calcium carbonate structures.
    • Effect: Weakened coral skeletons make corals more vulnerable to physical damage and limit their capacity to recover from disturbances. This feedback loop can contribute to a decline in overall coral reef health.
  3. Storm Damage and Reef Structure Feedback Loop:
    • Mechanism: Intense tropical storms, hurricanes, or cyclones, influenced by climate change, can cause physical damage to coral reefs.
    • Effect: Damaged coral structures provide less protection for the reef against future storms. If storms become more frequent or severe, the cumulative impact can compromise the structural integrity of the reef and hinder recovery.
  4. Overfishing and Algae Overgrowth Feedback Loop:
    • Mechanism: Overfishing of herbivorous fish, such as parrotfish, reduces their population, leading to increased algae growth on coral reefs.
    • Effect: Algae can outcompete corals for space, hindering coral growth and recovery. Reduced herbivory exacerbates the overgrowth of algae, creating a feedback loop that undermines the resilience of the coral reef ecosystem.
  5. Disease Spread and Coral Health Feedback Loop:
    • Mechanism: Climate change and environmental stressors can weaken coral health, making them more susceptible to diseases.
    • Effect: As diseases spread among stressed corals, the overall health of the reef declines. Weakened corals are less able to withstand additional stressors, leading to a feedback loop of declining health and increased vulnerability.
  6. Loss of Biodiversity and Ecosystem Function Feedback Loop:
    • Mechanism: Environmental stressors, such as coral bleaching and disease, can lead to the loss of key species and a decline in overall biodiversity on the reef.
    • Effect: A reduction in biodiversity weakens the resilience and functioning of the coral reef ecosystem. This can create a feedback loop where the loss of key species further compromises the ability of the reef to recover from disturbances.

Mitigating these feedback loops requires comprehensive conservation strategies, including reducing greenhouse gas emissions, implementing sustainable fishing practices, establishing marine protected areas, and addressing local stressors to enhance the resilience of coral reefs.

ALSO SEE:

Toppled Tipping Points: The Domino Effect / Brouse and Mukherjee (2023)

Sea-level Rise: Greenland and the Collapse of the East Antarctic Ice Sheet / Mukherjee and Brouse (2022 and 2023)

Sea Level Rise: Then and Now / Mukherjee and Brouse (2023)

Feedback Loops / Daniel Brouse and Sidd Mukherjee (2016)

The Human Induced Climate Change Experiment

bookmark_borderClimate Change Wildfires

by Daniel Brouse and Sidd Mukherjee

About the 2023 wildfires in Hawaii, Governor Josh Green said, “For perspective, we’ve had six fire emergencies this August, we had six fire emergencies between 1953 and 2003. That’s how- how fast things are changing. I know that there is debate out there whether we should be talking about climate change or not. Well, let’s be real world, climate change is here we are in the midst of it with a hotter planet, and fiercer storms.”

Climate change is contributing to the increased intensity and frequency of wildfires through a combination of factors that create favorable conditions for wildfires to ignite, spread, and become more destructive. Here are some key ways in which climate change influences wildfires:

  1. Higher Temperatures:
    • Impact: Rising global temperatures increase the likelihood of extreme heat events.
    • Effect on Wildfires: Higher temperatures contribute to drier conditions, leading to increased evaporation and moisture loss from vegetation. Dry and hot conditions provide a more conducive environment for wildfires to ignite and spread.
  2. Drought Conditions:
    • Impact: Changes in precipitation patterns and prolonged droughts are linked to climate change.
    • Effect on Wildfires: Drought conditions result in dry vegetation, making it more susceptible to ignition. Reduced soil moisture levels also contribute to the flammability of ecosystems.
  3. Changing Rainfall Patterns:
    • Impact: Climate change alters regional rainfall patterns, leading to more intense rainfall in some areas and prolonged dry spells in others.
    • Effect on Wildfires: Areas experiencing reduced rainfall may face prolonged dry seasons, creating conditions favorable for wildfires. Intense rainfall in certain regions can lead to the growth of vegetation, which later dries out and becomes potential fuel for fires.
  4. Warming Winters:
    • Impact: Warmer winter temperatures can affect snowpack and contribute to earlier snowmelt.
    • Effect on Wildfires: Reduced snowpack and earlier snowmelt can result in drier soil and vegetation earlier in the year, extending the wildfire season and increasing the period of vulnerability to fire ignition.
  5. Extended Fire Season:
    • Impact: Changes in climate contribute to longer and more intense fire seasons.
    • Effect on Wildfires: A longer fire season means that conditions conducive to wildfires persist for a more extended period, increasing the likelihood of ignition and the potential for wildfires to become larger and more destructive.
  6. Insect Infestations:
    • Impact: Warmer temperatures allow for the proliferation of certain insects, such as bark beetles.
    • Effect on Wildfires: Insect-infested trees become more susceptible to disease and wildfire. Dead and dry trees contribute to the fuel load, increasing the intensity and spread of wildfires.
  7. Wind Patterns:
    • Impact: Changes in climate can influence wind patterns.
    • Effect on Wildfires: Changes in wind patterns can contribute to the rapid spread of wildfires. Strong winds can carry embers over long distances, leading to the ignition of new areas.
  8. Thawing Permafrost:
    • Impact: Warming temperatures contribute to the thawing of permafrost.
    • Effect on Wildfires: Thawing permafrost releases stored carbon, creating flammable conditions. It can also lead to changes in vegetation types, altering fuel availability for wildfires.

The combination of these factors creates a feedback loops, where more intense and frequent wildfires release large amounts of carbon dioxide into the atmosphere, contributing to further climate change. This cycle reinforces the importance of addressing both the causes and consequences of climate change to mitigate the impact on wildfire risk. While the beautiful sunsets during forest fires create captivating visuals, it’s essential to recognize the environmental and health impacts associated with wildfires. Wildfires can cause significant damage to ecosystems, contribute to air pollution, and pose risks to human health. The mesmerizing sunsets are a visible reminder of the interconnectedness of atmospheric processes and the far-reaching effects of natural events like wildfires.

In addition to the carbon feedback loop (the carbon emissions of Canada’s fires outweighed the combined emissions from its oil and gas, transport and agriculture sectors), the fires also cause the melting of the permafrost and zombie fires to burn in the permafrost. The permafrost collapse is a self-sustaining feedback loop/tipping point. As the permafrost melts, the peatlands emit CO2 and methane. The increase in CO2 and methane results in more warming that results in more peatland emissions. A third feedback loop is created with lightning strikes. The study Forests at Risk Due to Lightning Fires found a sensitivity of extratropical intact forests to potential increases in lightning fires, which would have far-reaching consequences for terrestrial carbon storage and biodiversity. The results show that, on a global scale, lightning is the primary ignition source of fires in temperate and boreal forests. Global warming causes more extreme weather events and conditions for lightning creating more forest fires that create more warming and more lightning strikes.

The study Wildfire as a major driver of recent permafrost thaw in boreal peatlands published in the Journal Nature Communications found wildfires have caused a quarter of permafrost thaw (2,000 square kilometres) in Western Canada’s boreal peatlands over the past 30 years. “Historically, permafrost in this area underwent a natural cycle of thawing and reforming, but given current climate conditions and projections for the future, this fire-induced thaw appears to be irreversible,” said Carolyn Gibson, who conducted the research.

On January 1, 2024, the article, Why Are Alaska’s Rivers Turning Orange?, was published in Scientific America. “Streams in Alaska are turning orange with iron and sulfuric acid. Scientists who have studied these rusting rivers agree that the ultimate cause is climate change. Kobuk Valley National Park has warmed by 2.4 degrees Celsius (4.32 degrees Fahrenheit) since 2006 and could get another 10.2 degrees C hotter by 2100, a greater increase than projected for any other national park. The heat may already have begun to thaw 40 percent of the park’s permafrost, the layer of earth just under the topsoil that normally remains frozen year-round. McPhee wanted to protect the Salmon River because humans had ‘not yet begun to change it.’ Now, less than 50 years later, we have done just that. The last great wilderness in America, which by law is supposed to be ‘untrammeled by man,’ is being trammeled from afar by our global emissions.”

NASA reported: Wildland fire experts have described Canada’s 2023 fire season as record-breaking and shocking. Over the course of a fire season that started early and ended late, blazes have burned an estimated 18.4 million hectares. Hundreds of fires exceeded 10,000 hectares (39 square miles), large enough to be considered “megafires.” These megafires were also unusually widespread this season, charring forests from British Columbia and Alberta in the west to Quebec and the Atlantic provinces in the east to the Northwest Territories and the Yukon in the north.

Though the rate of change in climate disasters’ intensity, duration, and likelihood vary according to the type of extreme weather, a “rule-of-thumb” can be derived from the Canada wildfires of 2023. The World Weather Attribution Organization found, “Climate change made the cumulative severity of Quebec’s 2023 fire season to the end of July around 50% more intense, and seasons of this severity at least seven times more likely to occur.”

50% more intense
7 x more likely

Sidd said, “Do you remember back in the early 2000’s when we thought we wouldn’t live to see the extreme changes due to global warming?”

Daniel replied, “I think 2023 is the most significant year so far. We saw confirmation of tipping points being crossed for Mountain Glacier Loss, Greenland Ice Sheet Collapse, Antarctic Ice Sheet Collapse, and potentially the Collapse of AMOC.”

Sidd continued, “We already knew that. It was Canada catching on fire that I could not believe. I never thought I’d live to see the day.”

Daniel asked, “Do you think the permafrost and peatlands will have zombie fires and cause the permafrost tipping point?”

Sidd responded, “Yes. They are gone, too. We already know from the permafrost peatland fires in Siberia.”

Daniel ponders, “Hmmmm… I guess that means my plan went up in smoke? My worst case scenario / last resort emergency plan was to escape to Canada.”

ALSO SEE:
How is All Real Estate at Risk From Climate Change? Brouse and Mukherjee (2024)
The Long-term Breathing Experiment / Brouse (2023)
Health Impacts of Air Pollution / Brouse (2023)
Climate Change: Rate of Acceleration / Brouse and Mukherjee (2023)
Toppled Tipping Points: The Domino Effect / Brouse and Mukherjee (2023)
Tree Extinction Due to Human Induced Environmental Stress / Mukherjee and Brouse (2005)
Soil Degradation and Desertification / Brouse (2024)
Create a Climate-Resilient Environment in and Around Your Home / Brouse (2024)