bookmark_borderRaindrops Are Increasing in Size Due to Climate Change

By Daniel Brouse
October 1, 2024

There is growing evidence that raindrops are increasing in size due to climate change and rising temperatures. Several studies suggest that global warming is influencing precipitation patterns, including the size and intensity of raindrops. Here’s a summary of the key points:

1. Increased Water Vapor in the Atmosphere

  • Warmer air holds more moisture, as described by the Clausius-Clapeyron equation. For every 1°C (1.8°F) rise in temperature, the atmosphere can hold about 7% more water vapor. This increased moisture can result in larger raindrops, as more water is available for cloud formation and precipitation.

2. Enhanced Convection

  • Rising temperatures lead to stronger convection (vertical air movement), which is a key process in storm formation. Stronger updrafts can suspend larger water droplets in the atmosphere for longer periods, allowing them to grow before falling as rain. This can lead to larger raindrops in storms.

3. Heavier Rainfall Events

  • There has been a documented increase in the frequency and intensity of heavy rainfall events globally. Larger and heavier raindrops are more likely in such events because more water is being concentrated in intense, short bursts of rain. For example, a study by the U.S. National Climate Assessment found that heavy rainfall has increased in many regions of the United States, especially in the Northeast.

4. Studies and Observations

  • Satellite observations and ground-based radar data have detected an increase in the size of raindrops over certain regions. A study published in Nature Communications in 2020 showed that storm systems in tropical and subtropical regions were producing larger raindrops as global temperatures increased.
  • In urban areas, which experience localized warming due to the “urban heat island” effect, researchers have observed both an increase in rainfall intensity and larger raindrops compared to rural areas.

5. Impact of Aerosols

  • Climate change also affects the distribution and concentration of aerosols in the atmosphere. These tiny particles serve as nuclei around which raindrops form. With more aerosols in some regions due to human activities, raindrops can take longer to coalesce, potentially leading to larger drops as they fall.

6. Feedback Loops

  • The increase in extreme weather events, such as tropical storms and hurricanes, which are intensified by climate change, also leads to heavier rain with larger raindrops. These storms draw more water vapor from the warming oceans, contributing to bigger raindrops when they make landfall.

Conclusion:

While more research is ongoing, there is substantial evidence that climate change is leading to larger raindrops due to increased atmospheric moisture, enhanced convection, and more intense storm systems. These changes contribute to more severe rainfall events, which are linked to greater flooding and erosion.

Violent Rain
What turns these severe weather events into ‘violent rain events’ is the application of the drag equation and flow dynamics.

Mass and velocity are just part of the equation; density also plays a key role. The combination of these variables increases the intensity of flow forces. Wind and water forces scale with the square of velocity, meaning that as flow speeds increase—due to more intense heating or heavier rainfall—the damage scales accordingly. According to drag physics, force is proportional to density times the square of velocity (v2v2).
About the Human Induced Climate Change Experiment

bookmark_borderViolent Rain: Helene Update

By Daniel Brouse
September 30, 2024

If you’re wondering why rain-related severe weather events are becoming more frequent and intense, it’s due to climate change. Rising temperatures increase the amount of humidity in the atmosphere, as warmer air holds more moisture. The Clausius-Clapeyron equation shows that for every 1°C (1.8°F) increase in temperature, the air can hold about 7% more water vapor.

Many areas in the U.S. are experiencing average temperature increases of up to 10°C, extending over more weeks during both spring and fall. This increase allows the atmosphere to hold about 70% more water vapor, leading to significantly more rainfall. Additionally, raindrops are becoming larger and falling faster, which increases their momentum. Using the formula p=mv (momentum = mass × velocity), larger and faster raindrops carry more energy.

Moreover, the number of raindrops is also increasing. A higher concentration of raindrops in a given time and area further boosts momentum. For example, if N raindrops, each with mass m and velocity v, hit a surface area A per second, the total momentum impacting the surface is Nmv per second. This contributes to increased force and damage during rainstorms.

The end result is an increase not only in the frequency and intensity of storms but also in the momentum of falling rain, which intensifies their impact.

Violent Rain
What turns these severe weather events into ‘violent rain events’ is the application of the drag equation and flow dynamics.

Mass and velocity are just part of the equation; density also plays a key role. The combination of these variables increases the intensity of flow forces. Wind and water forces scale with the square of velocity, meaning that as flow speeds increase — due to more intense heating or heavier rainfall — the damage scales accordingly. According to drag physics, force is proportional to density times the square of velocity.

For example, a 20-mile-an-hour wind exerts four times the force of a 10-mile-an-hour wind, while a 40-mile-an-hour wind exerts 16 times the force of a 10-mile-an-hour wind. At 50 miles an hour, the force is 25 times greater, and at 60 miles an hour, it’s 36 times greater than at 10 miles an hour. Now, add the density factor: water is about 800 times denser than air, so a 10-mile-an-hour water flow exerts 800 times the force of a 10-mile-an-hour wind.

As flow velocities increase due to climate change, the forces — and thus the damage — scale with the square of the velocities. While we may not know precisely how much velocities will rise with climate change, we’re already seeing the effects: overwhelmed flood and sewage systems, collapsing hillsides, and more.

About the Human Induced Climate Change Experiment

bookmark_borderExtreme Weather and Violent Rain

by Daniel Brouse

Between April 1 and 4, Southeastern Pennsylvania experienced another severe weather event attributed to atmospheric rivers and strong winds. Rainfall accumulation exceeded 3 inches, accompanied by wind gusts ranging from 35 to 45 mph. Tragically, two individuals lost their lives in unrelated incidents, one in Montgomery County and the other in Delaware County, when trees collapsed onto their vehicles.

Part of the The Philadelphia Violent Rain Experiment
The Greater Philadelphia Area serves as our focal point for studying non-coastal violent rain events. Although situated 78 miles from the nearest coast, Philadelphia has experienced a surge in violent rainstorms since 2021, with each episode yielding more precipitation than the typical monthly average. In addition to enduring Nor’easters and tropical storms from the Southeast, Philadelphia is increasingly subjected to deluges originating from the Gulf of Mexico.

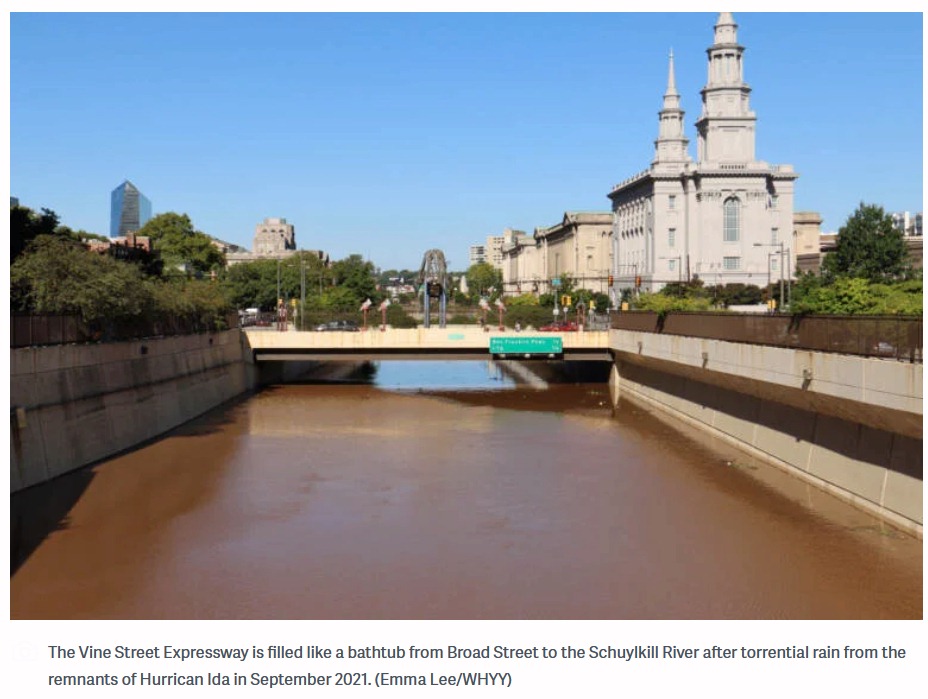
Vine Street Expressway Flooded

Hurricane Ida in the summer of 2021 is a good example. Because of the 85 degrees Fahrenheit Gulf of Mexico ocean temperature, Ida rapidly gained strength right before it made landfall jumping from a Category 1 to a Category 4 storm. The warm air allowed more moisture to be carried as rain. The storm was so large that it was able to pick up more moisture from the Atlantic Ocean. After destroying parts of Florida, the ocean moisture was carried inland and dumped over places like Pennsylvania and New York. Ida caused record flood damage in parts of Pennsylvania. The Philadelphia Inquirer reported, “The remnants of Hurricane Ida destroyed or damaged hundreds of homes in Southeastern Pennsylvania and caused more than $100 million in public infrastructure damage across the state.” There were more deaths in the Northeastern USA than where the storm made landfall in Louisiana. The New York Times reported, “The remnants of Hurricane Ida caused flash flooding and a number of deaths and disrupted transit across parts of New York and New Jersey. The storm killed at least 43 people in New York, New Jersey, Pennsylvania and Connecticut and left more than 150,000 homes without power.” Ida’s Philadelphia area destruction included 5 deaths, 7 tornadoes, record flooding, hundreds of water rescues, and “one incredibly soggy mess.” The violent rain in Philadelphia was so extreme that the main road across the city from the Delaware River to the Schuylkill River, the Vine Street Expressway, was turned into a canal. “You could’ve swam from 22nd Street to about 15th Street,” said Justin Galbreath, a district maintenance manager at the Pennsylvania Department of Transportation. As climate change intensifies, the frequency of Vine Street becoming a river will likely increase until such time as it becomes permanent.

The train derailment in Plymouth Meeting (July 17, 2023), the eleven vehicles swept away, and the seven people drowned by flood waters in Washington Crossing (July 15, 2023) were caused by a deluge of rain and flash flooding. “In my 44 years, I’ve never seen anything like it,” Upper Makefield Fire Chief Tim Brewer said. “When the water came up, it came up very swiftly. We do not think that anybody drove into it, that they were actively on that road when it happened.” CBS news reported, “Over 6 inches of rain in an hour caused the flash flooding according to Brewer. The fire department was dispatched in that area for a lightning strike and just by happenstance they found 11 cars. Eight people were rescued from the cars and two from the creek.” In July and December of 2023, extreme rainfall resulted in sinkholes being exposed in the carbonate rock under Route 202 in nearby King of Prussia, PA.

In September of 2023, the Philadelphia Inquirer reported, “The remnants of Tropical Storm Ophelia soaked the entire Philadelphia region with episodic downpours on Saturday, the first day of fall, conspiring to incite 60-mph wind gusts at the Shore and high-tide flooding that closed numerous roads in beach and back-bay towns.” There were up to 8 inches of rain recorded throughout the Philadelphia region over the three day event.

The winter of 2023 saw near weekly atmospheric river flash flooding events. On January 9, the Greater Philadelphia Region incurred an historic winter tropical violent rain event. CBS news reported, “If it feels like it’s been an abnormally rainy few weeks, you’re right. Normal rainfall totals between Dec. 1 and Jan. 9 amount to about 4.78 inches. Between December 2023 and Tuesday, we’d already recorded more than 9 inches of rain, an amount normally recorded in December, January and February combined.” The January 9 storm brought over 4 inches of rain to many areas. The Delaware River peaked at its highest level ever. There were hurricane strength winds with wind gusts over 70mph.

On March 23, 2024, Philadelphia witnessed its wettest March day on record. The rain gauge at the airport measured over 3 inches of rainfall, with parts of New Castle County, Delaware, also receiving over 3 inches. Some areas in Gloucester County and Camden County, New Jersey, recorded rainfall exceeding 4 inches. The precipitation observed on that day was roughly equivalent to the typical rainfall for the entire month. A young girl was swept away by the rapidly rising and swift moving waters of the Chester Creek in Delaware County, PA.

On the same day, an atmospheric river event brought heavy rains to Brazil’s Rio de Janeiro state, resulting in at least nine fatalities, with Petropolis being the hardest hit. A staggering 270 mm (11 inches) of rain fell within 24 hours, significantly impacting the region and leading to numerous incidents, including landslides and house collapses.

The Human Induced Climate Change Experiment

bookmark_borderExtreme Rainfall–surge Hazard Risks

by Daniel Brouse

Most climate change models forecast rising sea levels as the predominant threat of a warming climate to flood risks. Though sea level rise is of great concern, so should be extreme rainfall.

Both the sea and air temperatures are rising. Warm air can hold more moisture than cool air. Warmer sea temperatures result in more evaporation. Warmer air can hold more moisture. The increased moisture in the air moves over land causing inland deluges.

Hurricane Ida in the summer of 2021 is a good example. Because of the 85 degrees Fahrenheit Gulf of Mexico ocean temperature, Ida rapidly gained strength right before it made landfall jumping from a Category 1 to a Category 4 storm. The warm air allowed more moisture to be carried as rain. The storm was so large that it was able to pick up more moisture from the Atlantic Ocean. The ocean moisture was carried inland and dumped over places like Pennsylvania and New York. Ida caused record flood damage in parts of Pennsylvania. The Philadelphia Inquirer reported, “The remnants of Hurricane Ida destroyed or damaged hundreds of homes in Southeastern Pennsylvania and caused more than $100 million in public infrastructure damage across the state.” There were more deaths in the Northeastern USA than where the storm made landfall in Louisiana. The New York Times reported, “The remnants of Hurricane Ida caused flash flooding and a number of deaths and disrupted transit across parts of New York and New Jersey. The storm killed at least 43 people in New York, New Jersey, Pennsylvania and Connecticut and left more than 150,000 homes without power.”

The Journal Nature published the study Tropical cyclone climatology change greatly exacerbates US extreme rainfall–surge hazard examining how current models underestimate the risk of Rainfall–surge Hazard. “Tropical cyclones (TCs) are drivers of extreme rainfall and surge, but the current and future TC rainfall–surge joint hazard has not been well quantified. Using a physics-based approach to simulate TC rainfall and storm tides, we show drastic increases in the joint hazard from historical to projected future (SSP5–8.5) conditions. The frequency of joint extreme events (exceeding both hazards’ historical 100-year levels) may increase by 7–36-fold in the southern US and 30–195-fold in the Northeast by 2100. This increase in joint hazard is induced by sea-level rise and TC climatology change; the relative contribution of TC climatology change is higher than that of sea-level rise for 96% of the coast, largely due to rainfall increases. Increasing storm intensity and decreasing translation speed are the main TC change factors that cause higher rainfall and storm tides and up to 25% increase in their dependence.”

From the article Rising Temperatures Bringing Bigger Floods published in the Journal Science, “CO2 emissions have boosted risk of intense precipitation and consequent flooding. To determine how rising temperatures have altered flood risk, atmospheric scientist Pardeep Pall of the University of Oxford in the United Kingdom and his colleagues ran thousands of climate simulations. In roughly half of them, they reduced atmospheric concentrations of carbon dioxide to levels measured in the year 1900, and they adjusted ocean temperatures and the amount of Arctic sea ice—which affects high-latitude weather patterns—accordingly. In the other simulations, they modeled modern conditions. Then they compared the rainfall amounts generated in both types of simulations. Finally, they fed the rainfall values into a model that assesses the potential for flooding. In 90% of the simulations, results suggested that the flood risk in England and Wales in autumn 2000 was at least 20% higher than it would have been in 1900.”

As the Earth warms, the air will hold more moisture. More moisture-laden air moves over land and creates atmospheric rivers (Pineapple Express). The Journal EOS in the article Atmospheric Rivers Spur High-Tide Floods on U.S. West Coast said, “Atmospheric rivers are narrow bands of moisture that travel across the lower troposphere, generally at the leading edges of massive low-pressure systems. At their peak, they can carry as much water through the sky as the Amazon River does on land. They unleash intense winds and heavy rain as they surge across the Pacific Ocean, eventually making landfall on the U.S. West Coast, contributing to many high-tide flooding events.”

The atmospheric rivers also bring heavy rainfall inland causing extreme flooding. In October of 2021 NOAA said, “a convergence of storms brought more than half a foot of rain to parts of the Bay area in addition to strong winds, flash floods, and mud/landslides. They also bring the potential for heavy snow to higher elevations in the Sierra Nevada mountain range.” (Atmospheric River Hits the West Coast)

More articles on Flood Insurance, Extreme Weather Events, Rising Sea Levels and Global Warming