bookmark_borderExtreme Weather Events Getting More Extreme

The U.N. has released a report entitled, “Extreme Weather Continues in 2018 – a Continuing Call to Climate Action”.

Addressing the dangers associated with extreme weather conditions, the Executive Secretary of the UN Climate Change Patricia Espinosa said: “We must keep an eye on the future. As the superstorms and monsoon flooding of last year and the extreme heat and extreme cold of this year show – we still have a long way to go to deliver on the promise of the Paris Climate Change Agreement”.

This year, record warmth was observed across parts of North America, Europe and Asia, as well as the Atlantic, Pacific and Indian Oceans. Record cold May temperatures were limited to northeastern Canada and the northern Atlantic Ocean, off the southern coast of Greenland.

The study published in the journal Nature showed that ice losses from Antarctica are causing sea levels to rise faster today than at any time in the past 25 years. Results of the Ice Sheet Mass Balance Inter-Comparison Exercise (IMBIE).

According to NASA, “Antarctica’s potential contribution to global sea level rise from its land-held ice is almost 7.5 times greater than all other sources of land-held ice in the world combined. The continent stores enough frozen water to raise global sea levels by 190 feet (58 meters), if it were to melt entirely. Knowing how much ice it’s losing is key to understanding the impacts of climate change now and its pace in the future.”

NOAA points to climate change as part of the problem causing the largest wildfires in California.

Daytime high temperatures were well above average across much of the western United States in July, but it was overnight low temperatures that were really extreme in large areas of California—where firefighters are battling multiple wildfires—and the Great Basin, and in isolated pockets of Colorado and the Southwest.
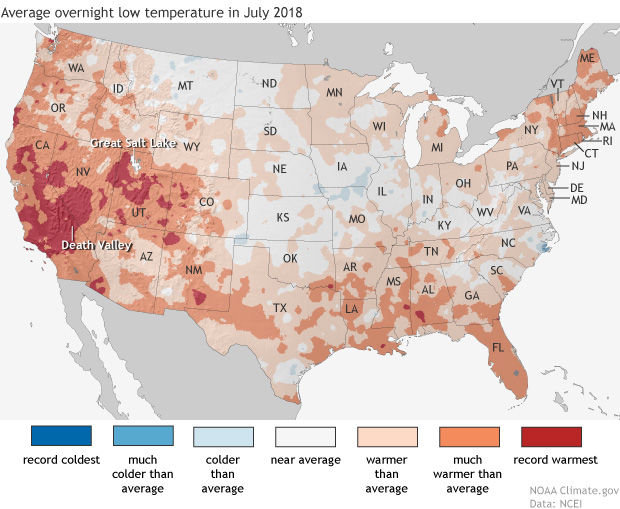
Map of the contiguous United States showing July 2018 overnight low temperature ranksAs the NCEI’s Deke Arndt has blogged about before, nighttime low temperatures are increasing faster than daytime high temperatures across most of the contiguous United States. For much of the West and Southwest, July’s record-breaking nighttime heat is a new highpoint in a long-term trend—one that has rapidly accelerated in recent decades. In California, average overnight low temperature in July rose by 0.3°F per decade over the historical record (1895-2018), but since 2000, the pace of warming has accelerated to 1.3°F per decade.
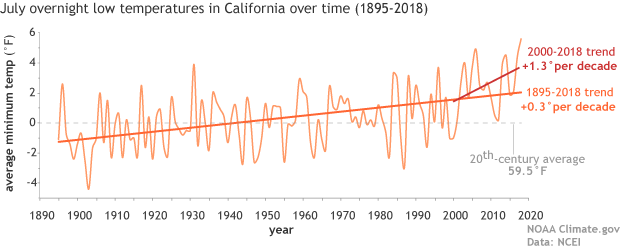
graph of July minimum temperature 1895–2018 with long-term trend and trend since 2000 shown

Average July minimum temperatures (overnight lows) in California  (light orange line) from 1895–2018. The trend over the historical record is shown in dark orange, and the recent trend (2000-2018) is shown in red. The twentieth-century average is shown with a gray line. NOAA Climate.gov graph, based on data from NCEI’s Climate at a Glance.

According to Tim Brown, director of NOAA’s Western Region Climate Center (WRCC), it’s a pattern that has serious consequences for wildfires and those who combat them. When temperatures cool off overnight, it’s not just a physical relief for firefighters who may be working in conditions that push the limits of human endurance; fire behavior itself relaxes as temperatures drop, winds grow calmer, and relative humidity rises. He explained via email,

Moisture in dead vegetation continuously tries to reach equilibrium with atmospheric moisture. So if nighttime temperature is staying warmer, then the humidity is lower, and the fuels stay drier. A dead fuel moisture reduction of a few percent can increase flammability, flame length, and subsequent overall fire behavior.

When fires remain active at night, it can increase both the time to containment and total burned area, while also affecting public health and safety through more smoke production and lower air quality.  Brown says that qualitatively, there seems to be an increase in firefighters’ reports of active nighttime fire behavior since around 2000.  He and other researchers are currently investigating whether that relationship can be confirmed quantitatively.
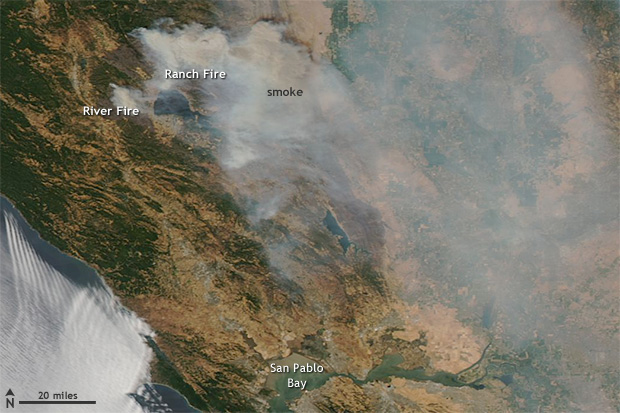
satellite image of fires and smoke near Clear Lake, California on August 6, 2018

NASA Aqua satellite image of the Ranch and River Fires in Northern California on August 6, 2018, with a pall of smoke spreading to the east.  These fires are part of the Mendocino Complex  Fire, which has become the largest fire in California history.  Extreme fire activity in the state was exacerbated by record-warm overnight low temperatures in July. Image from NASA Worldview website.

Nighttime warming has consequences for other aspects of public health. WRCC climatologist Nina Oakley pointed out via email that the South Coast region of California is experiencing the largest warming trends in nighttime temperatures, according to an environmental health hazard report from the California Environmental Protection Agency. In many communities in the region, air conditioning—rarely needed in the past—is uncommon. In addition, since 2000, heat waves in California have become more humid. In the report, experts offered a warning about the change:

People, animals, and plants that are adapted to California’s traditionally dry daytime heat and nighttime cooling are unable to recover from extreme heat, especially when humidity is high at night. The increase in nighttime heat waves presents an additional risk factor for vulnerable populations.

The rapid increase in the rate of warming in California and other parts of the U.S. West since the start of the new century is a sharp reminder that we can’t necessarily count on the future changing as slowly as the past. Asked about the July nighttime heat in California, California state climatologist Mike Anderson answered via email, “As for the past decade or two, we have noticed observations have looked different than the rest of the historical record. We are consistently sampling at the warm edge of the historical distribution now, and expectations are for that to continue, with new records being set with increasing frequency in the coming years.”

Parts of Pennsylvania recorded record rainfall during the summer of 2018 with frequent “tropical downpours” delivering thirteen or more inches of rain in a 5 day period. The Penn Environment Organization released a report entitled, “Hitting Close to Home | Global Warming is Fueling Extreme Weather Across the U.S.”

Weather-related disasters affect millions

  • Since September 2010, counties housing 84 percent of the total Pennsylvania population (over 10 million residents) were affected by federally-declared weather disasters.
  • Pennsylvania experienced five weather-related disasters, including severe storms, tornadoes, floods, and tropical storms since September 2010.

Extreme weather causes widespread destruction

  • In February 2015 a large winter storm and associated cold wave impacted many central, eastern and northeastern states, including Pennsylvania. The storm and cold wave caused at least 30 deaths and the total estimated costs were over $1 billion in the affected region.
  • In October 2012 Hurricane Sandy caused extensive damage to several states, including Pennsylvania from wind, rain, and heavy snow. Hurricane Sandy caused at least 159 deaths and the total estimated costs were $67.6 billion in the affected regions.
  • Since 2010, extreme weather events have caused at least 30 power outages in Pennsylvania, including one outage that lasted 10 days in 2012 during Hurricane Sandy. [3]


Weather extremes are becoming more common 

Globally, 2015 was Earth’s hottest year on record, surpassing 2014. [4] Many types of extreme weather are expected to become more frequent or severe in a warming world, which could lead to more weather-related disasters.

  • Tropical Storms and Hurricanes: Global warming has the potential to make tropical storms more destructive. Hurricanes and other coastal storms are likely to be more powerful [5] and rainier, [6] while storm surges could be more destructive as sea levels rise. [7]
  • Heavy Rain and Snow: Extreme precipitation is already increasing; continued trends could increase the risk of intense downpours, heavy snowstorms and severe flooding. [8]
  • Droughts and Wildfires: While global warming is anticipated to bring more rain to some areas, it will also likely elevate temperatures and extend dry spells. The potential for stronger drought—and greater area burned by wildfires—will increase, particularly in the West and Southwest.

Every year the World Economic Forum publishes the Global Risks Report. This year’s report suggests that experts anticipate another year of heightened risk. From the approximately 1000 respondents of the annual Global Risks Perception Survey, 59% expect an intensified risk, compared to 7% pointing to declining risks.

Environmental risks have grown in prominence over the 13-year history of the Global Risks Report. This trend continues in the 2018 report. All five risks in the environmental category are ranked higher than average in both likelihood and impact over a 10-year horizon.

“Extreme weather events” and “Natural disasters” rank among the top three risks in terms of likelihood and impact. “Failure of climate-change mitigation and adaptation” ranks among the top five.


The Human Induced Climate Change Experiment (Global Warming Research and Educational Materials)

bookmark_borderFlood Losses

South Carolina, Virginia, Georgia and Florida because of sea
level rise flooding from 2005 to 2017. ”

Florida: -$5.42 billion

South Carolina: -$1.11 billion

North Carolina: -$582 million”

https://www.charlotteobserver.com/news/science-technology/article215476785.html

https://www.floodiq.com/

https://b.floodiq.com/methodology

https://link.springer.com/article/10.1007%2Fs11113-018-9473-5

https://link.springer.com/content/pdf/10.1007%2Fs11113-018-9473-5.pdf

Boston climate risks:

https://www.cnbc.com/2018/05/30/waterfront-real-estate-in-boston-rises-in-the-face-of-stronger-storms.html

bookmark_borderFlood Insurance Rates Rising

“your flood insurance premiums could rise up to 18 percent each year”

A recent article in the Miami Herald reports:

“FEMA confirmed to the Miami Herald that it is looking into switching to risk-based pricing in 2020, which would end the subsidies most coastal communities enjoy on their flood insurance premiums and show the true dollar cost of living in areas repeatedly pounded by hurricanes and drenched with floods — like South Florida.

“That means insurance is about to become very expensive, and it kind of sounds the bell that these are high-risk areas,” said Wayne Pathman, a Miami-based land use attorney and chair of the city’s Sea Level Rise Committee.

Premiums through the National Flood Insurance Policy are already rising an average of eight percent this year; the first wave of pricier policies started in April. That brings the average annual price (including surcharges) for a policy holder to $1,062.

It’s all part of a strategy to make the NFIP financially stable. The program is $20 billion in debt (and that’s after the government forgave $16 billion of that debt last year) because it pays out much more each year than it takes in.”

More about Flood Insurance
More about Climate Change

bookmark_borderRising Sea Level and the Internet

In a study published by the University of Wisconsin-Madison, authors concluded the infrastructure of the Internet is at risk due to global warming and rising sea levels.

“Thousands of miles of buried fiber optic cable in densely populated coastal regions of the United States may soon be inundated by rising seas….”

“Most of the damage that’s going to be done in the next 100 years will be done sooner than later,” says Barford, an authority on the “physical internet” — the buried fiber optic cables, data centers, traffic exchanges and termination points that are the nerve centers, arteries and hubs of the vast global information network. “That surprised us. The expectation was that we’d have 50 years to plan for it. We don’t have 50 years.”

Many of the conduits at risk are already close to sea level and only a slight rise in ocean levels due to melting polar ice and thermal expansion as climate warms will be needed to expose buried fiber optic cables to sea water. Hints of the problems to come, says Barford, can be seen in the catastrophic storm surges and flooding that accompanied hurricanes Sandy and Katrina.

The Human Induced Climate Change Experiment

bookmark_borderClimate Change Hammers US Coasts

In a report published by NOAA, the 2017 nation‐wide average annual frequency of high tide flooding hit an all‐time record.

If high tide flooding in 2018 follows historical patterns, flooding will be most common during the winter (Dec‐Feb) along the West Coast and the northern section of Northeast Atlantic Coast in response to winter storms and more‐predictable monthly highest astronomical tides (predicted tides). Along the Gulf and along much of the Atlantic Coasts, flood patterns are less predictable and occur usually in response to weather effects.

Flooding is, however, most common during the fall (Sep‐Nov) when the mean sea level cycle peaks, and more often during monthly highest predicted tides in some Southeast Atlantic locations. Breaking of annual flood records is to be expected next year and for decades to come as sea levels rise, and likely at an accelerated rate (Sweet et al., 2017b).

When high tide flood frequencies along the entire U.S. coastline are averaged (Figure 3b), the 2017 national average of 6 days . . . is record breaking. Rising ocean levels along the U.S. coastline (Figure 3b, blue line) of about 2 mm/year since 1920 are driving (along with local land subsidence) a rapid increase in U.S. high tide flood frequencies. The U.S. average high tide flood frequency is now 50% greater since 2000 and 100% greater than it was 30 years ago.

Also see:
Flood Insurance
Atlantic City Going Under

bookmark_borderCan You Weather The Whether?

Sidd says:

i can’t believe anybody is moving to the coast. But apparently
some people like throwing their money into the ocean.
https://www.bloomberg.com/news/articles/2018-04-23/the-latest-climate-threat-for-coastal-cities-more-rich-people

paper on Miami Dade climate effect on real estate appreciation
the higher the better…
paper is at
http://iopscience.iop.org/article/10.1088/1748-9326/aabb32#supplementarydata

may affect us at some point. lets b careful
not to post more than fair use allows, not the
whole article.
https://phys.org/news/2018-05-news-agencies-hail-major-eu.html

total precip goin up (mainly over ocean)
but areas of precip shrinking (also mainly over ocean)
== smaller and more intense storms over ocean
(in case i didn’t spell it out: watch out coastline and islands)
open access paper at
http://iopscience.iop.org/article/10.1088/1748-9326/aab375/pdf

roundup more toxic than claimed
https://www.theguardian.com/us-news/2018/may/08/weedkiller-tests-monsanto-health-dangers-active-ingredient

“Perhaps you think youâ??re safe because the flood map shows your home is on high ground. But you still need infrastructure â?? things like roads, power plants, water treatment facilities, airports and drinking-water wellfields. So while your house may be high and dry, good luck getting to the grocery store, the doctorâ??s office or out of town.”
http://www.miamiherald.com/opinion/editorials/article210451219.html

More on Climate Change and Flood Insurance<?h2>

bookmark_border9 Out of 10 People Breath Polluted Air

In a new release from the World Health Organization (WHO), “air pollution levels remain dangerously high.” Updated estimations reveal an alarming death toll of 7 million people every year caused by ambient (outdoor) and household air pollution.

Dr. Tedros Adhanom Ghebreyesus, Director-General of WHO said, “It is unacceptable that over 3 billion people – most of them women and children – are still breathing deadly smoke every day from using polluting stoves and fuels in their homes. If we don’t take urgent action on air pollution, we will never come close to achieving sustainable development.”

Key findings:

  • WHO estimates that around 90% of people worldwide breathe polluted air. Over the past 6 years, ambient air pollution levels have remained high and approximatively stable, with declining concentrations in some part of Europe and in the Americas.
  • The highest ambient air pollution levels are in the Eastern Mediterranean Region and in South-East Asia, with annual mean levels often exceeding more than 5 times WHO limits, followed by low and middle-income cities in Africa and the Western Pacific.
  • Africa and some of the Western Pacific have a serious lack of air pollution data. For Africa, the database now contains PM measurements for more than twice as many cities as previous versions, however data was identified for only 8 of 47 countries in the region.
  • Europe has the highest number of places reporting data.
  • In general, ambient air pollution levels are lowest in high-income countries, particularly in Europe, the Americas and the Western Pacific.In cities of high-income countries in Europe, air pollution has been shown to lower average life expectancy by anywhere between 2 and 24 months, depending on pollution levels.

Climate Change and Air Quality

bookmark_borderWhen Your Property Goes Underwater

The right to the free flow of water has long maintained “public right-of-way easements” in the United States. In general, if a waterway is navigable, it is a public right-of-way; however, the results of climate change and rising sea levels have turned people’s private property into navigable waterways.

An article in Bloomberg entitled The Fighting Has Begun Over Who Owns Land Drowned by Climate Change highlights recent disputes over water right-of-ways:

America’s coastal cities are preparing for legal battles over real estate that slips into the ocean.

A decade after the global financial crisis popularized the term “underwater real estate,” parts of the U.S. are grappling with a new, more literal version of that problem.

“There’s no question it will be a huge fight,” says Holly Doremus, a law professor at the University of California at Berkeley who specializes in environmental law. “We don’t exactly know the boundaries of what the state can do.” For centuries, a body of law called the public trust doctrine has stipulated that, when it comes to coastal property, anything below the average high-tide line is owned by the government for the use and benefit of the public. Those rules also cover what happens when the high-tide line moves. If that movement happens suddenly—for example, if a portion of beach is washed away by a storm—the land owner retains title to the property provided he or she restores it to dry land.

More on Flood Insurance and Climate Change

bookmark_borderCalifornia Increasing Weather Volatility

One of the most notable changes in weather doing to global warming is volatility. “We are not saying that the Earth’s temperature is just going to rise. In general, as energy is added to a system, the fluctuations in the system increase. So, we expect more storms, more droughts, more wildfires, more floods, more fluctuations of all kinds. What we are saying is that weather conditions will become more volatile due to the impact of humans,” said Sidd Mukherjee and Daniel Brouse of The Membrane Domain (2004). The increase in extreme weather events wreak havoc on humans’ ability to adapt to the changing environment. For instance, severe droughts followed by severe rains create devastating floods.

A new study (23 April 2018) published in the Journal Nature, Increasing precipitation volatility in twenty-first-century California, forecasts extreme weather events in California:

Mediterranean climate regimes are particularly susceptible to rapid shifts between drought and flood—of which, California’s rapid transition from record multi-year dryness between 2012 and 2016 to extreme wetness during the 2016–2017 winter provides a dramatic example. Projected future changes in such dry-to-wet events, however, remain inadequately quantified, which we investigate here using the Community Earth System Model Large Ensemble of climate model simulations. Anthropogenic forcing is found to yield large twenty-first-century increases in the frequency of wet extremes, including a more than threefold increase in sub-seasonal events comparable to California’s ‘Great Flood of 1862’. Smaller but statistically robust increases in dry extremes are also apparent. As a consequence, a 25% to 100% increase in extreme dry-to-wet precipitation events is projected, despite only modest changes in mean precipitation. Such hydrological cycle intensification would seriously challenge California’s existing water storage, conveyance and flood control infrastructure.


bookmark_borderGlaciers Are Vanishing

Around the world glaciers are melting at an alarming rate. The World Glacier Monitoring Service publishes a survey of the mass changes from glaciers.

In their latest survey, the found “The average mass balance of the glaciers with available long-term observation series around the world continues to be negative, with tentative figures indicating a further thickness reduction of 1.1 meters water equivalent (m w.e.) during the hydrological year 2015.”

Melting Glaciers
Melting Glaciers

More About “Human Induced Climate Change”