bookmark_borderBomb Cyclone: Extreme Weather Events

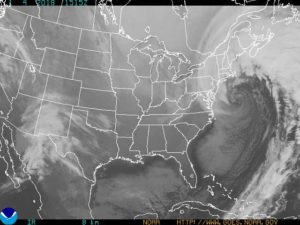
Bomb Cyclone Storm on January 4, 2018 off the Northeastern Shore

“‘Bomb cyclone’ blasting East Coast before polar vortex uncorks tremendous cold late this week.  The most severe winter weather yet will assault the area late this week.” — washingtonpost.com (January 3, 2018)

The bomb cyclone blizzard was a 1,000 mile wide Nor’easter classified as a “bomb cyclone” because of its sharp drop in atmospheric pressure. “Bombogenesis, a popular term used by meteorologists, occurs when a midlatitude cyclone rapidly intensifies, dropping at least 24 millibars over 24 hours,” said NOAA.

“We are not saying that the Earth’s temperature is just going to rise. In general, as energy is added to a system, the fluctuations in the system increase. So, we expect more storms, more droughts, more wildfires, more floods, more fluctuations of all kinds. What we are saying is that weather conditions will become more volatile due to the impact of humans,” said Sidd Mukherjee and Daniel Brouse (2004)

“What use to be a once-in-a-hundred year event is now an annual event.” (2017)

“I think the public and many policymakers don’t really take those 100-year forecasts very seriously,” said Myles Allen, an Oxford scientist who is now one of the world’s leading experts in attribution science. “They are much more seriously interested in the question of what is happening now and why—which boils down to attribution.”

It use to be that scientists were reluctant to relate any single weather event to climate change; however, that has changed.

NOAA now issues a report for extreme weather events, “This report provides information on direct economic losses, deaths, and other impacts for numerous weather and climate disasters including tropical cyclones, floods, droughts and heat waves, severe storms (e.g., tornadoes, hail, and straight-line winds), wildfires, crop freeze events, and winter storms.”

The Bulletin of the American Meteorological Society now issues a special report each year assessing the impact of climate change on the previous year’s extreme events.

Scientific American reported, Myles Allen had hinted about “litigation two years before Hurricane Katrina occurred. In his Nature commentary, he mused about the possibility of massive class-action lawsuits—carrying the potential for “up to six billion plaintiffs” around the world—attempting to hold greenhouse gas emitters liable for damages.

Attribution studies could help to apportion the blame, he noted. For instance, he wrote, “If, at a given confidence level, past greenhouse-gas emissions have increased the risk of a flood tenfold, and that flood occurs, then we can attribute, at that confidence level, 90% of any damage to those past emissions.”

About 2017, NPR reported, “This year will go down in history for its extreme weather. Researchers have now definitively attributed three major extreme weather events to climate change.”

LINDA WERTHEIMER, HOST:

If you’re listening to this program from the Midwest or East Coast, well, I hope you’re nice and warm inside your house or car. President Trump took note of the frigid temperatures in the East this holiday season with this tweet – perhaps we could use a little bit of that good, old global warming.

Climate scientists note that while parts of the U.S. are much colder than average now, the world as a whole this week is warmer than the average over recent decades. One thing climate scientists have long been reluctant to say is that specific extreme weather events are the result of climate change. But NPR’s Christopher Joyce says a little-noticed study this past year did prove a link.

CHRISTOPHER JOYCE, BYLINE: This was this – a study that determined that, yes, looking at events in 2016, 27 of them – they found three that were so off the charts that they had to be the result of what we have done to the planet. They’re just beyond what is expected to be a natural event.

WERTHEIMER: What are they? What are the three events?

JOYCE: Well, one was the incredible heat that we experienced – the average temperature around the globe in 2016. It was 1.7 degrees Fahrenheit above the average in the 20th century. And that is just enormous. The second one – extreme heat waves in Asia, especially India and Pakistan. Hundreds of people died. The temperatures were just beyond belief. And the third one – one not noticed that much – but something called the blob, which was a section of water in the Bering Sea off the coast of Alaska that was just unusually warm – again, so warm that it’s just beyond what could be modeled as being – as happening in a natural world.

WERTHEIMER: But still, how do they know that this was not just weird weather – certainly, extreme, unexpected, unusual?

JOYCE: You know, again, I have to use the word model, which people are afraid of. But they’re computer models. And what you basically do is you recreate the world as it was before the Industrial Revolution and certainly before the mid-20th century when we started warming it up. And you put in all of the atmosphere. You put in the oceans, the circulation, the temperature. And you sort of create this world before we changed it. And then you create another model of the world we’re in. And you take these events, and you put them in that model of what the world used to be like. And you can tell that they couldn’t have been created by the forces that were at work before we warmed the planet.

WERTHEIMER: So those three things could not have happened absent global warming.

JOYCE: Yeah. I talked to one of the scientists who did the work – who compiled the work – Stephanie Herring of the National Oceanic and Atmospheric Administration. And this is how she put it.

(SOUNDBITE OF ARCHIVED RECORDING)

STEPHANIE HERRING: Not even one in a million. They cannot replicate them in a world without climate change is what the scientists are saying. It’s a big result, yes. It’s – again, you know, we’ve been doing this for six years, 131 papers. This is our first time seeing this.

bookmark_borderChristmas Creations

Christmas Creations is an original album of holiday music created for the 2017 season.

Please listen to this
“Merry Christmas!”
Here’s wishing you a very merry Christmas
Clearly, a very merry Christmas
Winter solstice bliss
“Merry Christmas!”
Here’s wishing you a very merry Christmas
Hold dearly this very merry Christmas
In the tale
Peace will prevail
In “The End”
The message we send
Grand total
Peace for all
In “The End”
Peaceful

As you’re passing pass
“Merry Christmas”?
Here’s wishing you a very merry Christmas
Query: a very merry Christmas
Let’s say everyday
“Merry Christmas!”
Here’s wishing you a very merry Christmas
And did you hear
… a “Happy New Year!”

2017
New Releases

For Joy
Baby Jesus (in Santa’s Clothing)
Christmas Wish List
Impart On Christmas Day
3 Kings Ace High
A Cold November Day
For Friends Giving
Angel Well
In Angel Skin
Savor The Flavor
Save-ty
Oh Snow
Merry Christmas!

Instrumentals | Bonus Tracks & Videos

Home | Christmas Homepage

bookmark_borderSea Level Rise and Property Values

“Disaster on the Horizon: The Price Effect of Sea Level Rise”

Asaf Bernstein, Matthew Gustafson, and Ryan Lewis.

Sea level rise coming home, the market is paying attention (Halleluia! who woulda thunk it. The real estate market, especially on the coasts is a wretched hive of villainy))

The first sentence of the abstract is “Homes exposed to sea level rise (SLR) sell at a 7% discount relative to observably equivalent unexposed properties equidistant from the beach.”

More:

“This effect is primarily driven by properties unlikely to be inundated for over half a century, suggesting that it is driven by investors pricing long horizon concerns about SLR costs.”

” … the SLR exposure discount has increased substantially over the past decade, coinciding with both increased awareness and more pessimistic prognoses about the extent and speed of rising oceans. In particular, we document increased transaction volume and lower prices for sophisticated buyers following the significant revisions of the IPCC’s 2013 release, which increased SLR projects and awareness.”

” … properties that will experience ocean encroachment after 1 foot of global average sea level rise trading at a 22%, 2-3 feet at a 17% discount, 4-5 feet at a 9% discount and 6 feet at a 6% discount. [4] Using the long run discount rate provided by Giglio et al. (2014) and assuming complete loss at the onset of inundation, we estimate that markets expect 1 foot of sea level rise within 35 years, 2-3 feet within 45 years, 4-5 feet after 65 years, and 6 feet in 80 years. These results are consistent with the medium to high projections provided in Parris et al. (2012) and utilized by the NOAA in their 2012 report.

” … exposed non-owner occupied properties trade at a 10% to 11% discount, relative to comparable non-exposed properties. ”

” … expectations regarding future SLR have steadily increased over the course of our sample period … At the beginning of our sample in 2007 we find no significant difference between the prices of exposed and unexposed properties. By the end of our sample in 2016, exposed non-owner occupied properties are priced approximately 13.5% below comparable unexposed properties.”

” … we find evidence that the discount applied to non-owner occupied properties increased from 8.1% to 14.0% following the IPCC release.

” … consistent with the idea that as information about SLR risks comes to light, exposed properties should be more likely to transact, we find that the annual probability of turnover is approximately 0.2 percentage points higher for exposed properties between 2011 and 2016 (relative to a base transaction rate of approximately 11% for all properties). This is entirely driven by the period following the IPCC report where we see a 0.8 percentage point increase in the annual probability of an exposed property transacting.”

I see a remake of the “The Big Short” coming up. A good title might be “Underwater.”

Open access (no doi ?!) . Read the whole thing:

https://papers.ssrn.com/sol3/papers.cfm?abstract_id=3073842

sidd

MORE RESOURCES:

Climate Change And Credit
Real Estate and the Rising Sea Level
Top 5 Risks
How Do We Handle Flood Risk?
Senegal Forecasts Climate Change Changes
Biloxi-Chitimacha-Choctaw Indians Climate Change Refugees
Atlantic City Going Under
Biggert Waters Flood Insurance Reform Act of 2012
Flood Insurance Reform 2011
About Flood Insurance
Who Pays For Flood Losses?
Floodplain Maps Force Towns Into Tricky Waters
Head of the Federal Flood Insurance Program Resigns
Sacramento And FEMA Fight On Flood Insurance
Global Warming


bookmark_borderClimate Change And Credit

by Daniel Brouse

Part of a series of articles on Climate Change And Flood Insurance

Homeowners living in flood plain have learned the hard way that climate change has effected their ability to get a mortgage. As the sea level rises and extreme weather events intensify, homeowners have found their insurance rates increasing or their total inability to obtain insurance coverage. Without insurance it is very, very hard to get a mortgage.

Moody’s credit ratings are now going to have a similar impact on municipalities. “What we want people to realize is: If you’re exposed, we know that. We’re going to ask questions about what you’re doing to mitigate that exposure,” Lenny Jones, a managing director at Moody’s, said in an interview. “That’s taken into your credit ratings.”

Bloomberg news agency reports:

In its report, Moody’s lists six indicators it uses “to assess the exposure and overall susceptibility of U.S. states to the physical effects of climate change.” They include the share of economic activity that comes from coastal areas, hurricane and extreme-weather damage as a share of the economy, and the share of homes in a flood plain.

Based on those overall risks, Texas, Florida, Georgia and Mississippi are among the states most at risk from climate change. Moody’s didn’t identify which cities or municipalities were most exposed.

“If I was a city official, I’d be asking a whole lot of questions about what vulnerabilities their community has, and how each new proposed development adds to that vulnerability,” said Rob Moore, a senior policy analyst at the Natural Resources Defense Council. “Because at some point, your creditors certainly will.”

Real Estate and the Rising Sea Level
Top 5 Risks
How Do We Handle Flood Risk?
Senegal Forecasts Climate Change Changes
Biloxi-Chitimacha-Choctaw Indians Climate Change Refugees
Atlantic City Going Under
Biggert Waters Flood Insurance Reform Act of 2012
Flood Insurance Reform 2011
About Flood Insurance
Who Pays For Flood Losses?
Floodplain Maps Force Towns Into Tricky Waters
Head of the Federal Flood Insurance Program Resigns
Sacramento And FEMA Fight On Flood Insurance
Global Warming


bookmark_borderUber Paid Ransom and Hid Hack

Uber Paid Hackers to Delete Stolen Data on 57 Million People

* Company paid hackers $100,000 to delete info, keep quiet
* Chief Security Officer Joe Sullivan and another exec ousted

Bloomberg reports, that Uber was hacked of personal data from 57 millions drivers and riders. Then, instead of reporting the crime, they paid extortion to the criminals and hid the breach.

“None of this should have happened, and I will not make excuses for it,” Dara Khosrowshahi, who took over as chief executive officer in September, said in an emailed statement. “We are changing the way we do business.”

Travis Kalanick, Uber’s co-founder and former CEO, learned of the hack in November 2016, a month after it took place, the company said. Uber said it was obligated to report the hack of driver’s license information and failed to do so.

“At the time of the incident, we took immediate steps to secure the data and shut down further unauthorized access by the individuals,” Khosrowshahi said. “We also implemented security measures to restrict access to and strengthen controls on our cloud-based storage accounts.”

bookmark_borderThe Danger in Email, Sytlesheets, Scripts and Session Replay

Membrane Domain Security Center

https://freedom-to-tinker.com/2017/09/28/i-never-signed-up-for-this-privacy-implications-of-email-tracking/

What happens when you open an email and allow it to display embedded images and pixels? You may expect the sender to learn that you’ve read the email, and which device you used to read it. But in a new paper we find that privacy risks of email tracking extend far beyond senders knowing when emails are viewed. Opening an email can trigger requests to tens of third parties, and many of these requests contain your email address. This allows those third parties to track you across the web and connect your online activities to your email address, rather than just to a pseudonymous cookie.

How it works. Email tracking is possible because modern graphical email clients allow rendering a subset of HTML. JavaScript is invariably stripped, but embedded images and stylesheets are allowed. These are downloaded and rendered by the email client when the user views the email.[2] Crucially, many email clients, and almost all web browsers, in the case of webmail, send third-party cookies with these requests. The email address is leaked by being encoded as a parameter into these third-party URLs.

https://freedom-to-tinker.com/2017/11/15/no-boundaries-exfiltration-of-personal-data-by-session-replay-scripts/

You may know that most websites have third-party analytics scripts that record which pages you visit and the searches you make. But lately, more and more sites use “session replay” scripts. These scripts record your keystrokes, mouse movements, and scrolling behavior, along with the entire contents of the pages you visit, and send them to third-party servers. Unlike typical analytics services that provide aggregate statistics, these scripts are intended for the recording and playback of individual browsing sessions, as if someone is looking over your shoulder.

https://motherboard.vice.com/en_us/article/59yexk/princeton-study-session-replay-scripts-tracking-you
Over 400 of the World’s Most Popular Websites Record Your Every Keystroke

Prominent companies who use the scripts include men’s retailer Bonobos.com, Walgreens.com, and the financial investment firm Fidelity.com. It’s also worth noting that 482 might be a low estimate. It’s likely that the scripts don’t record every user that visits a site, the researchers told me. So when they were testing, they likely did not detect some scripts because they were not activated. You can see all the popular websites that utilize session replay scripts documented by the researchers here.

The Walgreen’s example runs afoul of HIPPA in, oh, so many ways.

List of sites discovered (I bet many, many more are doing it)

https://webtransparency.cs.princeton.edu/no_boundaries/session_replay_sites.html

Disable all scripting. Disable images. Hell, I’m almost at the point of disabling stylesheets, that’ll be the next tracker if they aint doing it already.

I guess, just use surfraw and parse the output. Or go oldschool and lynx/links.

sidd

bookmark_borderHerb Insulation Air Purifier (Healthy Snack)

by Daniel Brouse

Herb Insulation Air Purifier Snack

This is what I call the “Herb Insulation Air Purifier”. It’s very cheap and easy to use. As a matter of fact, it can pay for itself the first day.

On a cold day, it can insulate the window from letting cold air in or warm air out.

On a hot day, it can insulate the window from letting hot air in or cooler air out.

On every day, it can purify the air by adding O2, removing CO2, and emitting beneficial chemicals into the air for health and wellness.

On any day that you touch it, you will help prevent your own ills, as well as, the spreading of disease to others.

On the days you add them to your cooking, a metamorphosis and chemical reaction will occur that results in great things for your habitat and your diet.

Pictured in this Herb Insulation Air Purifier Mosaic (Healthy Snack) are parsley, rosemary, basil, onion greens, and oregano. Depending on the conditions and/or your appetite, any number of a herbs will do. The basil can’t stand frigid temperatures, so it is best left on the inner side for the winter. Here the oregano has two generations yielding both dried herbs and added insulation. Some of the parsley is in the second year of its bi-annual life. The first-year undergrowth adds a nice low buffer of insulation. Soil that is exposed during the cold months is a great insulator, absorbs the heat from sunlight during the day and stores it into the night. (Foraging for Food in the Winter offers additional advice on cold weather herbs.)

Also recommend are  a wide variety of lettuce, aloe, scallions, thyme, sage, spinach, and whatever you like to eat.  During hot months, aloe and cacti do well.  The cacti can also be used to help keep cats out of the planters throughout the year.

More Food For Thought:

Information on growing and finding your own food.
Important Facts About Chlorophyll
Window Sill Herb Garden
Minerals And Water
Safe Drinking Water

Food For Thought

bookmark_borderEmissions Worst Ever

The World Meteorological Organization reported on October 30, 2017:
Greenhouse gas concentrations surge to new record

Green-House-Gas-Bulletin-2017.pdf

Concentrations of carbon dioxide in the atmosphere surged at a record-breaking speed in 2016 to the highest level in 800,000 years, according to the World Meteorological Organization’s Greenhouse Gas Bulletin. The abrupt changes in the atmosphere witnessed in the past 70 years are without precedent.

Globally averaged concentrations of CO2 reached 403.3 parts per million in 2016, up from 400.00 ppm in 2015 because of a combination of human activities and a strong El Niño event. Concentrations of CO2 are now 145% of pre-industrial (before 1750) levels, according to the Greenhouse Gas Bulletin.

Rapidly increasing atmospheric levels of CO2 and other greenhouse gases have the potential to initiate unprecedented changes in climate systems, leading to “severe ecological and economic disruptions,” said the report.

The annual bulletin is based on observations from the WMO Global Atmosphere Watch Programme. These observations help to track the changing levels of greenhouse gases and serve as an early warning system for changes in these key atmospheric drivers of climate change.

Population growth, intensified agricultural practices, increases in land use and deforestation, industrialization and associated energy use from fossil fuel sources have all contributed to increases in concentrations of greenhouse gases in the atmosphere since the industrial era, beginning in 1750.

Since 1990, there has been a 40% increase in total radiative forcing – the warming effect on our climate – by all long-lived greenhouse gases, and a 2.5% increase from 2015 to 2016 alone, according to figures from the US National Oceanic and Atmospheric Administration quoted in the bulletin.

“Without rapid cuts in CO2 and other greenhouse gas emissions, we will be heading for dangerous temperature increases by the end of this century, well above the target set by the Paris climate change agreement,” said WMO Secretary-General Petteri Taalas. “Future generations will inherit a much more inhospitable planet, “ he said.

“CO2 remains in the atmosphere for hundreds of years and in the oceans for even longer. The laws of physics mean that we face a much hotter, more extreme climate in the future. There is currently no magic wand to remove this CO2 from the atmosphere,”said Mr Taalas.

The last time the Earth experienced a comparable concentration of CO2 was 3-5 million years ago, the temperature was 2-3°C warmer and sea level was 10-20 meters higher than now.

In a separate report, the United Nations (UN) released the Emissions Gap Report for 2017. The report concludes that world treaties are only slowing emissions by 1/3 of what is needed to meet the maximum 2 degree rise in temperature. A 2 degree Celsius rise in temperature would likely cause a 20-40 foot rise in sea levels.

Emissions-Gap-Report_2017.pdf

If the trend continues, most coastal and port cities (including the Jersey Shore and Philadelphia) will be submerged in your lifetime.

2 Degree Temp. Rise and Sea Level Rise
New Jersey Shore Under Sea Level

bookmark_borderReal Estate and the Rising Sea Level

by Daniel Brouse

“Living near the water is incredibly appealing for people around the country, but it also comes with additional considerations for buyers and homeowners,” Zillow chief economist Svenja Gudell wrote in a new report. “Homes in low-lying areas are also more susceptible to storm flooding and these risks could be realized on a much shorter timeline as we have seen time and time again.”

Climate change is causing the sea level to rise. The effects are already being felt in places like the Jersey Shore. Atlantic City, N.J. ranked third in the top ten U.S. areas that experience nuisance flooding with a 682% surge since 1957.

“As relative sea level increases, it no longer takes a strong storm or a hurricane to cause flooding”said William Sweet, Ph.D., oceanographer at NOAA’s Center for Operational Oceanographic Products and Services (CO-OPS) and the report’s lead author. “Flooding now occurs with high tides in many locations due to climate-related sea level rise, land subsidence and the loss of natural barriers. The effects of rising sea levels along most of the continental U.S. coastline are only going to become more noticeable and much more severe in the coming decades, probably more so than any other climate-change related factor.”

“We’ve seen the enormous impact flooding can have on a city and its residents,” said Gudell. “It’s harder for us to think about it on a long-term timeline, but the real risks that come with rising sea levels should not be ignored until it’s too late to address them.”

The Zillow report found:

  • Coastal homes are threatened by the prospect of rising sea levels
  • More than $900 billion worth of U.S. residential real estate could be lost by a 6-foot rise in sea levels
  • The rise in water levels projected by 2100 could destroy 2 million homes

A CNBC analysis of the report said, “Of the nation’s largest cities, Miami, New York, Boston, Tampa and Fort Myers, Florida, have the highest volume of homes at risk of flooding. Los Angeles, Charleston, South Carolina, Houston and New Orleans are also in the top 20 markets at risk.”

Flood insurance is usually needed to obtain a mortgage for a property located in a flood zone. Flood insurance is the only insurance offered by the federal government that can be obtained by anybody. The National Flood Insurance Program (NFIP) is made available by the Federal Emergency Management Agency (FEMA).

The NFIP offers coverage for: 1) Building Property, up to $250,000, and 2) Personal Property (Contents), up to $100,000. The coverage is cumulative which means NFIP will pay out a maximum of $250,000 for the structure. If you make a claim for $100,000 and then sell the property, the next owner can only get insurance for up to $150,000.

The Zillow study found:

  • One-third (32 percent) of underwater homes would be valued in the bottom third nationally, meaning $123 billion in losses.
  • Two in five (39 percent) underwater homes would be valued in the top third nationally, translating to $597 billion in lost high-end real estate.
  • In rural and suburban areas, homes in the top value tier may face particular risk, while in urban areas homes in the bottom value tier are more likely to be affected.

MORE INFORMATION:
Top 5 Risks
How Do We Handle Flood Risk?
Senegal Forecasts Climate Change Changes
Biloxi-Chitimacha-Choctaw Indians Climate Change Refugees
Atlantic City Going Under
Biggert Waters Flood Insurance Reform Act of 2012
Flood Insurance Reform 2011
About Flood Insurance
Who Pays For Flood Losses?
Floodplain Maps Force Towns Into Tricky Waters
Head of the Federal Flood Insurance Program Resigns
Sacramento And FEMA Fight On Flood Insurance
Global Warming

bookmark_borderPollution And Health: 9 Million Deaths Per Year

The Lancet Commission published a report on October 19, 2017 that outlined the results of pollution and health. The report concluded that 9 million people suffered premature deaths due to pollution in 2015.

“Pollution is the largest environmental cause of disease and premature death in the world today. Diseases caused by pollution were responsible for an estimated 9 million premature deaths in 2015—16% of all deaths worldwide—three times more deaths than from AIDS, tuberculosis, and malaria combined and 15 times more than from all wars and other forms of violence. In the most severely affected countries, pollution-related disease is responsible for more than one death in four,” the report states.

Air pollution is the leading cause of death followed by water pollution. The financial cost from pollution-related death, sickness and welfare costs about $4.6 trillion in annual losses.

The report highlights:

  • Air pollution was linked to 6.5 million premature deaths;
  • Water pollution was linked to 1.8 million premature deaths;
  • Workplace pollution was linked to 1 million premature deaths;
  • Premature deaths resulting from pollution-related diseases like heart disease and cancer outnumbered AIDS, tuberculosis, and malaria combined 3 to 1;
  • About 92% of all premature deaths linked to pollution occur in low and middle-income countries.
  • Up to one in four deaths can be attributed to pollution in countries like China, India, Pakistan, or Bangladesh.
  • In absolute numbers, China (1.8 million) and India (2.5 million) had the most pollution-related deaths for the year 2015.
  • The United States, home to the world’s biggest economy, saw 155,000 premature deaths linked to pollution in 2015.


MORE REFERENCES
Death By Ozone
Health And Air Quality
Air Pollution Deaths
Air Pollution Killing Millions
Largest Health Risk