bookmark_borderClimate Change Impacts and You: The Rising Cost of a Changing Climate

by Daniel Brouse

Introduction

Climate change is no longer simply a future environmental threat. It is increasingly affecting American households through higher costs, declining air quality, extreme heat, infrastructure disruptions, property damage, and changing patterns of disease.

Although catastrophic floods, hurricanes, wildfires, and other disasters dominate the headlines, the most widespread climate impact may be less dramatic: the steady financial pressure climate change places on everyday household budgets. Food prices, insurance premiums, utility bills, and the costs of maintaining homes and communities are all increasingly influenced by a changing climate.

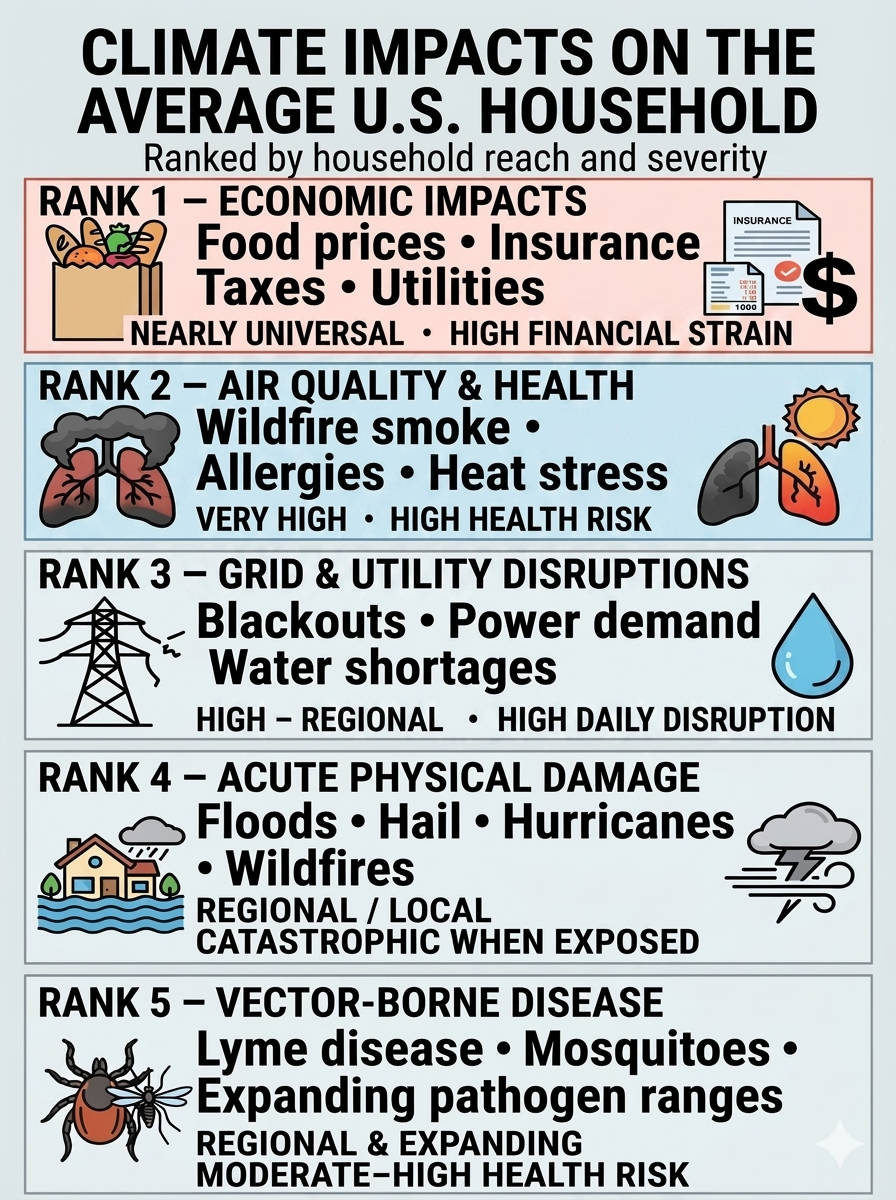
The impacts are not distributed equally. Some are nearly universal, while others are concentrated in particular regions or communities. The ranking below therefore considers two factors: how widely households are exposed and how severely the impact can disrupt everyday life.

Ranking of Climate Impacts on the Average U.S. Household

RankImpact CategoryPrimary Household ThreatsUbiquitySeverity
1Economic ImpactsFood inflation, insurance premiums, taxes, utility costsNearly universalHigh financial strain
2Air Quality & Chronic HealthWildfire smoke, longer allergy seasons, heat stressVery highHigh health risk
3Grid & Utility DisruptionsBlackouts, heat-related demand, water shortagesHigh, but regionalHigh daily disruption
4Acute Physical DamageFloods, hail, hurricanes, wildfiresRegional/localCatastrophic when exposed
5Vector-Borne DiseasesLyme disease, mosquitoes, expanding pathogen rangesRegional and expandingModerate to high health risk

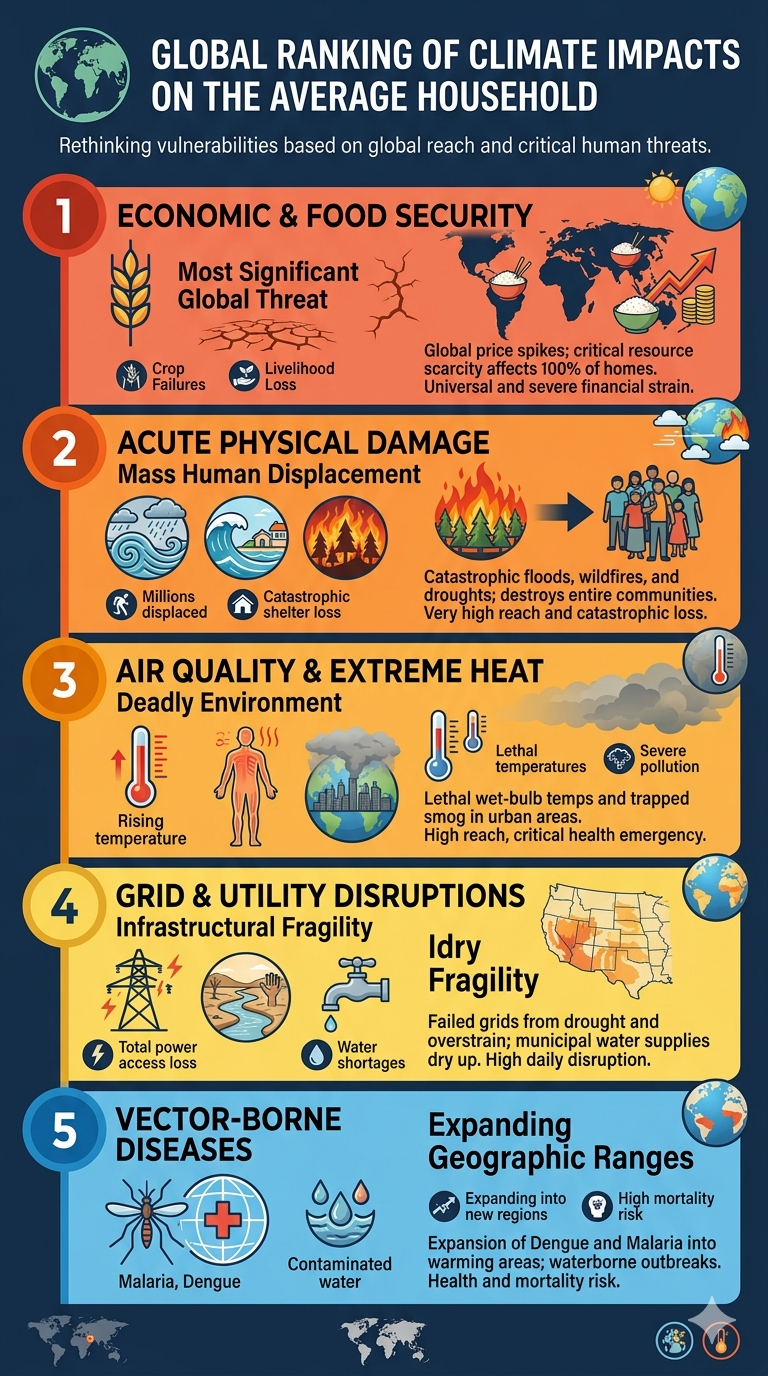
Global Ranking of Climate Impacts on the Average Household

The ranking below shifts the order of impacts based on global reach and the immediate threat to human life and livelihoods across developing and developed nations alike.

RankImpact CategoryPrimary Global Household ThreatsUbiquitySeverity
1Economic & Food SecurityGlobal food price spikes, crop failures, loss of agricultural livelihoodsUniversal (100% of homes)Extreme financial/survival strain
2Acute Physical DamageCatastrophic monsoon flooding, sea-level rise, mega-wildfires, historic droughtsVery High (Millions displaced)Catastrophic loss of shelter
3Air Quality & Extreme HeatLethal wet-bulb temperatures, severe dust/smoke pollution, urban heat islandsHigh (Equatorial & Urban zones)Critical health emergency
4Grid & Utility DisruptionsTotal lack of power access, severe municipal water shortages, drying river basinsHigh (Varies by infrastructure)High daily survival disruption
5Vector-Borne DiseasesMalaria, Dengue fever expansion, waterborne cholera outbreaksExpanding (Sub-tropical regions)High health and mortality risk

1. Economic Impacts: The Most Universal Climate Burden

Economic impacts rank first because households do not have to live in a flood zone, wildfire corridor, or hurricane-prone region to pay the economic costs of climate change. Climate-related costs increasingly reach Americans through food prices, insurance premiums, utility bills, taxes, public fees, and the rising cost of maintaining homes and infrastructure.

Climate change can therefore function as a cost multiplier, increasing expenses both directly and indirectly.

Climate-Driven Food Inflation

Drought, extreme heat, excessive rainfall, and other weather disruptions can reduce agricultural yields and interfere with food production and supply chains. Because food markets are interconnected, production losses in one region can influence prices far beyond the location of the original climate event.

The effects can reach everyday staples and commodities such as coffee, wheat, corn, beef, fruits, and vegetables.

The result is a climate-related cost that can reach virtually every household through the grocery bill—even when the household is hundreds or thousands of miles from the drought, flood, or heatwave affecting agricultural production.

The Insurance Crisis

Insurance is one of the clearest mechanisms through which climate risk is transferred directly to households.

As floods, hurricanes, wildfires, severe storms, and other disasters generate increasingly costly losses, insurers may respond by raising premiums, increasing deductibles, restricting coverage, or withdrawing from particularly high-risk markets.

For homeowners, climate risk can therefore produce a double financial burden:

higher insurance costs + higher uninsured exposure.

In some locations, the problem extends beyond affordability. Homeowners may find that certain types of coverage are difficult or impossible to obtain through conventional private insurance markets.

Rising Utility Costs

Hotter summers increase demand for air conditioning. As temperatures remain elevated for longer periods, households may need to run cooling systems more frequently and for longer durations.

That increases electricity consumption while simultaneously placing additional stress on the power grid.

Climate change can therefore affect household budgets through both higher energy consumption and the cost of maintaining a more resilient electrical system.

Water systems can face similar pressures. Drought, declining water supplies, flooding, and changing precipitation patterns may require communities to invest in new reservoirs, treatment capacity, pipelines, drainage systems, and other infrastructure.

Those investments ultimately have to be paid for.

Taxes, Assessments, and Public Costs

One of the least visible climate costs is the portion that reaches households through government budgets rather than private markets.

When climate-related disasters become more costly, governments must spend more on emergency response, disaster recovery, infrastructure repair, flood protection, stormwater management, wildfire preparedness, water systems, coastal protection, and long-term climate adaptation.

Those expenses can eventually reach households through:

  • Property taxes used to finance infrastructure repairs and resilience projects.
  • Special assessments and municipal fees for stormwater, drainage, flood control, and other local projects.
  • Higher utility rates needed to upgrade vulnerable water and electrical systems.
  • State and federal taxes that help finance disaster recovery, emergency response, agricultural assistance, infrastructure rebuilding, and resilience programs.
  • Public insurance and disaster programs when private insurance markets cannot absorb the full cost of catastrophic losses.

This creates an important economic chain:

Climate hazard → physical damage → insurance losses → government response → infrastructure spending → taxes, fees, and utility costs.

The household may never experience the original flood, wildfire, hurricane, or drought, yet it can still participate in paying the bill.

Rising Property and Maintenance Costs

Climate stress can also increase the cost of owning and maintaining a home.

More intense rainfall can require improved drainage. Stronger storms can increase demand for roofing and exterior repairs. Heat can accelerate deterioration of infrastructure and building materials. Flooding and wildfire risk can require additional mitigation measures.

At the same time, widespread disasters can create temporary shortages of construction materials, contractors, equipment, and skilled labor, increasing repair costs.

The Hidden Climate Cost

Taken together, these effects mean that climate change does not have to destroy your home to affect your household finances.

A household can experience climate-related costs through:

  • Higher grocery prices
  • Higher insurance premiums
  • Higher electricity and water bills
  • Higher taxes and public fees
  • Higher repair and maintenance costs

Together, these expenses create a growing household climate burden—even when a family never experiences a major climate disaster firsthand.

The important point is that climate change is not simply a collection of isolated disasters. It is increasingly an economic force that propagates through markets, insurance systems, government budgets, and household expenses.

For the average American household, this may ultimately be the most widespread way climate change is experienced: not as one catastrophic event, but as a persistent accumulation of additional costs.

2. Air Quality & Chronic Health: A Widespread Physical Exposure

Climate change also affects the quality of the air people breathe.

Wildfire Smoke

Wildfire smoke can travel hundreds or even thousands of miles, carrying fine particulate matter such as PM₂.₅ into communities far from the original fire.

These particles can penetrate deep into the respiratory system and aggravate existing respiratory and cardiovascular problems. As wildfire activity and smoke exposure increase in some regions, air-quality impacts are no longer limited to communities immediately adjacent to fires.

Longer Allergy Seasons

Warmer temperatures can alter plant growing seasons and extend periods of pollen production.

For people with asthma or seasonal allergies, longer or more intense pollen seasons can mean more days of symptoms, greater medication use, and reduced quality of life.

Heat Stress

Rising baseline temperatures also increase the frequency and duration of dangerous heat.

Homes without adequate cooling, outdoor workplaces, and communities with limited access to cooling resources can be particularly vulnerable. Extreme heat is not merely uncomfortable—it can place substantial physiological stress on the human body.


3. Grid & Utility Disruptions: Climate Stress on Essential Infrastructure

Modern households depend on electricity, water, transportation, telecommunications, and other infrastructure every day.

Climate extremes can place additional stress on these systems.

Power Grid Failures

Extreme heat can push electricity demand toward peak levels as households and businesses increase air-conditioning use.

At the same time, extreme weather can damage transmission lines, substations, transformers, and other infrastructure.

The consequences can range from higher electricity costs to localized outages and, under severe conditions, prolonged disruptions to essential services.

Water Scarcity

Drought can reduce reservoir levels, groundwater availability, and other sources of municipal water.

Communities may respond with conservation requirements, watering restrictions, infrastructure investments, or higher water costs.

Water stress can therefore become both an environmental problem and a household financial problem.


4. Acute Physical Damage: Catastrophic Where It Strikes

Floods, hurricanes, wildfires, severe thunderstorms, hail, and high winds can cause enormous damage to homes, vehicles, businesses, and infrastructure.

This category ranks fourth not because the damage is minor, but because exposure is geographically concentrated.

A household directly hit by a major disaster can experience losses vastly greater than those associated with ordinary climate-related inflation.

Floods and Flash Floods

Intense rainfall can overwhelm drainage systems and produce rapid flooding in locations that may not have traditionally been considered high-risk.

Coastal communities also face storm surge and rising sea levels that can increase the consequences of major storms.

Severe Hail and Wind

Severe convective storms can produce damaging hail and straight-line or tornadic winds.

Roofing, siding, windows, vehicles, and other property can be damaged within minutes, creating repair costs that are often compounded by rising construction and insurance expenses.

Wildfires

Wildfires can destroy homes and communities directly while also creating secondary effects through smoke, evacuation, infrastructure disruption, and insurance losses.


5. Vector-Borne Diseases: A Smaller but Expanding Risk

Climate change can also alter the geographic range and seasonal activity of disease-carrying organisms.

Tick-Borne Illnesses

Changes in temperature and seasonal conditions can affect the distribution and activity of ticks and their hosts.

In some regions, this may increase opportunities for exposure to Lyme disease and other tick-borne illnesses.

Mosquito-Borne Diseases

Changing temperature and precipitation patterns can also influence mosquito populations and the geographic conditions suitable for certain mosquito-borne diseases.

The importance of this category varies considerably by region, but changing environmental conditions can alter the boundaries of disease risk over time.

Other Pathogens

Environmental changes can also affect exposure to less common infectious diseases, including tularemia (rabbit fever), which can be transmitted through several pathways involving ticks, biting flies, infected animals, or contaminated environments.


The Basics: How Climate Change Reaches Your Household

Climate change may seem like a global-scale phenomenon, but its consequences increasingly arrive through very ordinary parts of daily life.

Your Wallet: A Rising Cost of Living

Climate change can function like a hidden cost multiplier, increasing expenses directly and indirectly.

  • Higher grocery bills: Weather extremes can disrupt agricultural production and food supply chains.
  • Higher insurance premiums: Increasing disaster losses can raise premiums, deductibles, and coverage costs.
  • Higher utility bills: Hotter temperatures increase cooling demand and electricity consumption.
  • Higher repair costs: Disasters can increase demand for construction materials, contractors, and replacement vehicles.
  • Higher infrastructure costs and taxes: Communities may need to spend more on flood protection, stormwater systems, water supplies, roads, and electrical infrastructure.

The result is that climate change does not need to destroy your house to affect your household finances.


Your Health: New Physical Strains

A warmer climate can change the environmental conditions in which people live.

Extended Allergy Seasons

Longer growing seasons and changing pollen patterns can increase exposure for people with seasonal allergies and asthma.

Heat Stress

More frequent and intense heat events increase risks of heat exhaustion, heatstroke, dehydration, and other heat-related illnesses.

Air Pollution

Wildfire smoke and other climate-related air-quality problems can expose people to unhealthy concentrations of fine particulate matter.

Vector-Borne Disease

Changing environmental conditions can alter the geographic and seasonal ranges of ticks, mosquitoes, and other disease vectors.


Your Environment: Infrastructure and Safety

Climate change also affects the physical systems surrounding your home.

Property Damage

Flooding, severe storms, wildfires, hail, and high winds can damage homes, vehicles, and personal property.

Travel Disruptions

Flooded roads, damaged bridges, severe storms, wildfire smoke, and extreme heat can disrupt transportation and cause delays.

Power and Water Reliability

Extreme heat, drought, storms, and other hazards can put additional pressure on electricity and water systems.

These disruptions can affect people even when their own property escapes direct physical damage.


What You Can Do

Climate change is a global problem, but households can take practical steps to reduce both personal vulnerability and unnecessary expense.

Audit Home Energy

Improve insulation, use efficient lighting and appliances, and manage heating and cooling more efficiently.

Prepare for Emergencies

Maintain a basic emergency kit, understand local flood and wildfire risks, and have a plan for prolonged power outages.

Protect Your Property

Keep gutters and drainage systems clear, maintain trees and vegetation around structures, and understand your property’s exposure to flooding, wind, wildfire, and other hazards.

Reduce Waste

Reducing food waste, conserving water, and using energy efficiently can lower household costs while reducing resource demand.

Know Your Insurance

Review deductibles, exclusions, flood coverage, and other policies before disaster strikes. Standard homeowners insurance does not necessarily cover every major climate-related hazard.


The Bottom Line

Climate change is often discussed in terms of distant environmental consequences, but for American households, the most immediate effects are increasingly personal and financial.

You may encounter climate change as:

a higher grocery bill,
a larger insurance premium,
a higher electric bill,
a smoky summer afternoon,
a longer allergy season,
a power outage,
a flooded road,
a damaged roof,
or a greater risk of heat stress.

The most dramatic climate disasters will continue to make the headlines. But the deeper transformation may be quieter: climate change is becoming embedded in the ordinary economics and infrastructure of everyday life.

The question is no longer simply what will climate change do to the planet?

It is increasingly:

What will climate change cost you?
bookmark_borderClimate Change Hotspots: Highest Risk Over the Next Decade

by Daniel Brouse

Climate Change Hotspots: Highest Risk Over the Next Decade

  • Africa (Sahel, Horn & Sub-Saharan): Desertification, megadroughts, crop failures, water shortages, catastrophic flooding, and expanding disease.
  • South & Southeast Asia: Deadly heat, glacier-fed flash floods, super-typhoons, coastal erosion, and marine heatwaves threatening hundreds of millions.
  • Western North America & Central America: Flash droughts, extreme wildfire seasons, stronger tropical storms, and widespread agricultural collapse.
  • South America (Amazon & Andes): Amazon rainforest approaching savannization, while glacial loss threatens freshwater supplies for millions.
  • Mediterranean Europe: Rapid drying, chronic water scarcity, declining crop yields, and unprecedented wildfire risk.
  • Oceania: Rising seas threaten low-lying island nations, while Australia’s interior faces intensifying megadroughts and catastrophic fire weather.
  • Arctic: Fastest-warming region on Earth, with accelerating permafrost thaw, infrastructure failure, coastal erosion, and powerful climate feedbacks.

bookmark_borderClimate Change and a Backyard Produce Experiment

by Daniel Brouse

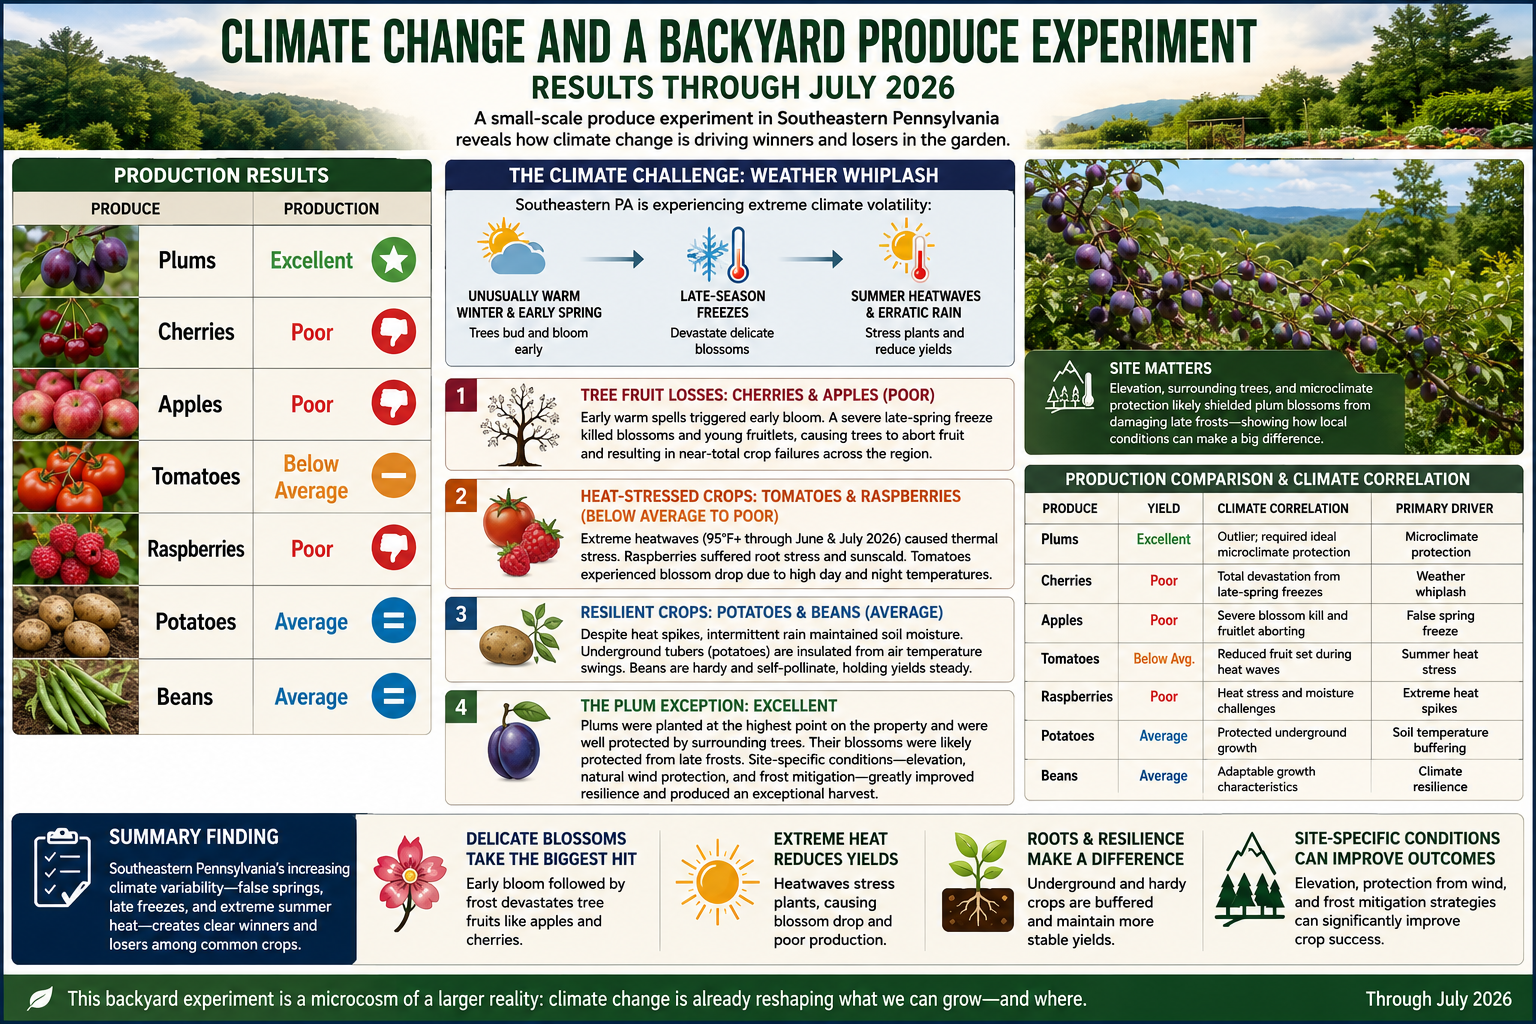
Climate Change and a Backyard Produce Experiment: Results Through July 2026

Production Results

ProduceProduction
PlumsExcellent
CherriesPoor
ApplesPoor
TomatoesBelow Average
RaspberriesPoor
PotatoesAverage
BeansAverage

Introduction

The results of this backyard produce experiment closely reflect the climate-related agricultural challenges affecting Southeastern Pennsylvania through July 2026. The region has experienced increasing climate volatility, often described as “weather whiplash”—a pattern characterized by unusually warm winter and early spring conditions followed by damaging late-season freezes, summer heat waves, and increasingly erratic precipitation.

The observed performance of each crop corresponds closely with the climatic stresses documented throughout the region.

Analysis by Crop Type

1. Tree Fruit Losses: Cherries and Apples

Both cherries and apples produced poor yields, mirroring the severe losses reported by many Pennsylvania fruit growers.

Climate Driver:
Warmer winters and early springs are causing fruit trees to break dormancy and bloom earlier than historical averages.

The False Spring Effect:
Following an unusually warm early spring, a significant late-season freeze struck Pennsylvania. Because many cherry and apple trees had already reached vulnerable flowering stages, blossoms were damaged or destroyed. Trees subsequently aborted damaged fruitlets, resulting in dramatically reduced harvests.

Observed Result: Poor production.


2. Heat-Stressed Crops: Tomatoes and Raspberries

Tomatoes and raspberries showed substantial sensitivity to elevated summer temperatures.

Climate Driver:
Repeated heat waves during June and July 2026 produced prolonged periods with temperatures exceeding 95°F (35°C).

Botanical Impacts:

  • Raspberries possess shallow root systems that are highly vulnerable to heat stress and soil moisture fluctuations. Prolonged high temperatures can reduce berry size, quality, and overall production.
  • Tomatoes often experience blossom drop when both daytime and nighttime temperatures remain elevated. Flowers fail to pollinate successfully, reducing fruit set and overall yield.

Observed Results:

  • Raspberries: Poor
  • Tomatoes: Below Average

3. Resilient Crops: Potatoes and Beans

Potatoes and beans demonstrated greater resilience despite challenging weather conditions.

Climate Driver:
Although extreme heat occurred, the season also included intermittent rainfall events that helped maintain soil moisture.

Botanical Impacts:

  • Potatoes benefit from underground tubers that remain insulated from extreme air temperatures.
  • Beans are generally adaptable and capable of maintaining stable production across a wider range of environmental conditions.

Observed Results:

  • Potatoes: Average
  • Beans: Average

4. The Plum Exception

Plums were the clear standout of the experiment, producing an excellent harvest despite widespread challenges affecting other fruit crops.

Climate Driver:
Most stone fruit in the region faced significant frost damage. However, localized factors can substantially alter outcomes.

Possible Explanations:

  • Favorable microclimate conditions
  • Higher-elevation planting sites where cold air drains away
  • Natural frost protection from surrounding terrain
  • Orchard management practices that reduced freeze damage

The plums were planted at the highest point on the property and were well protected by surrounding trees. Their elevated location likely reduced frost exposure, while the surrounding trees helped moderate temperature fluctuations and wind. Together, these conditions likely protected the blossoms from the damaging late-spring frosts that devastated many other fruit trees. The exceptional performance of the plum crop suggests that site-specific conditions—including elevation, natural wind protection, and frost mitigation—can significantly improve a crop’s resilience to climate-related stresses.

Observed Result: Excellent production.


Production Comparison and Climate Correlation

ProduceYieldClimate CorrelationPrimary Driver
PlumsExcellentLocalized success despite regional stressMicroclimate protection
CherriesPoorSevere blossom losses from spring freezeWeather whiplash
ApplesPoorFrost-damaged blossoms and fruitletsFalse spring freeze
TomatoesBelow AverageReduced fruit set during heat wavesSummer heat stress
RaspberriesPoorHeat stress and moisture challengesExtreme temperatures
PotatoesAverageProtected underground growthSoil temperature buffering
BeansAverageAdaptable growth characteristicsClimate resilience

Conclusions

This small-scale produce experiment provides a useful illustration of how climate change is increasingly influencing agricultural outcomes in Southeastern Pennsylvania.

The results reflect a broader regional pattern:

  • Early warming followed by hard freezes disproportionately impacts tree fruits such as apples and cherries.
  • Extreme summer heat reduces yields of temperature-sensitive crops such as tomatoes and raspberries.
  • Root crops and legumes generally demonstrate greater resilience to short-term temperature extremes.
  • Microclimate advantages can sometimes offset regional climate pressures, as demonstrated by the exceptional plum harvest.

Key Finding

The experiment suggests that Southeastern Pennsylvania’s increasing climate variability—particularly the combination of false springs, late freezes, and extreme summer heat—is creating clear winners and losers among common food crops. Delicate flowering fruit trees experienced the greatest losses, while more resilient crops maintained average production levels despite challenging conditions.

bookmark_borderThe Two Sides of the Climate Crisis: Consumption and Production

by Daniel Brouse

Climate change is often discussed as a problem of emissions, but emissions are the result of two interconnected forces: consumption and production.

Q: What are the greatest drivers of climate change?
A: Consumption and production.

At present, I would rank our addiction to consumption and ecofascism as the two most significant drivers of the climate crisis. While they operate in different ways, both reinforce the systems that accelerate environmental degradation.

The Consumption Problem

The United States, Western Europe, Canada, and Australia represent some of the world’s most consumption-driven economies. When self-interest, materialism, and short-term economic incentives dominate decision-making, consumer demand becomes one of the primary drivers of climate change, influencing not only greenhouse gas emissions but also land-use change, deforestation, habitat destruction, water consumption, resource depletion, and biodiversity loss.

This is why consumption-based accounting provides a more accurate picture of climate responsibility than production-based accounting alone.

For example, if a smartphone is manufactured in Asia using coal-generated electricity and then shipped across the Pacific to a consumer in Los Angeles, the emissions from mining, manufacturing, transportation, and delivery are ultimately driven by the purchasing decision. Under consumption-based accounting, those emissions are attributed to the American consumer rather than solely to the country where the phone was manufactured.

Read the full explanation and view the rankings here:

http://membrane.com/global_warming/Accounting-for-Climate-Responsibility.html#the-carbon-we-own

The Production Problem

The production side of the equation is likewise influenced by self-interest and economic incentives, but it is also shaped by ideological movements that obstruct effective climate action.

Two distinct, though sometimes overlapping, ideologies are particularly important:

Denialism is characterized by the rejection of scientific evidence, refusal to engage with empirical data, and reliance on misinformation or rhetorical distraction. Its primary objective is often the protection of political, ideological, or economic interests by undermining the scientific consensus.

Ecofascism combines elements of denialism with authoritarian, exclusionary, or extremist beliefs. In its most extreme forms, it portrays environmental collapse as acceptable—or even desirable—because it is viewed as reducing populations or preserving resources for groups considered more deserving than others. This ideology has historically been associated with racist, xenophobic, or eugenicist beliefs and rejects principles of equality and shared human responsibility.

The distinction is important. Traditional denialism primarily seeks to delay or prevent climate policy. Ecofascism goes further by framing unequal human survival as an acceptable or even desirable outcome — eliminationist logic.

Why This Matters

Climate change is not simply a technological or economic challenge. It is also a question of values.

On one side, excessive consumption drives demand for fossil fuels, resource extraction, and emissions. On the other, ideologies that reject science or rationalize unequal human suffering weaken society’s ability to respond effectively to the crisis.

Both sides must be addressed if meaningful progress is to be made.

Further Reading

While investigating climate change denialism, I examined material that I believe illustrates the intersection between denialist narratives and extremist environmental ideologies. A summary of that research is available here:

http://membrane.com/global_warming/Ecofascism-and-Denialism-101.html

bookmark_borderOil: A Slippery Slope (Literally and Figuratively)

Oil is one of those subjects that’s surprisingly slippery—both physically and economically. Most people know prices go up and down, but few realize that even storing oil comes with limits.

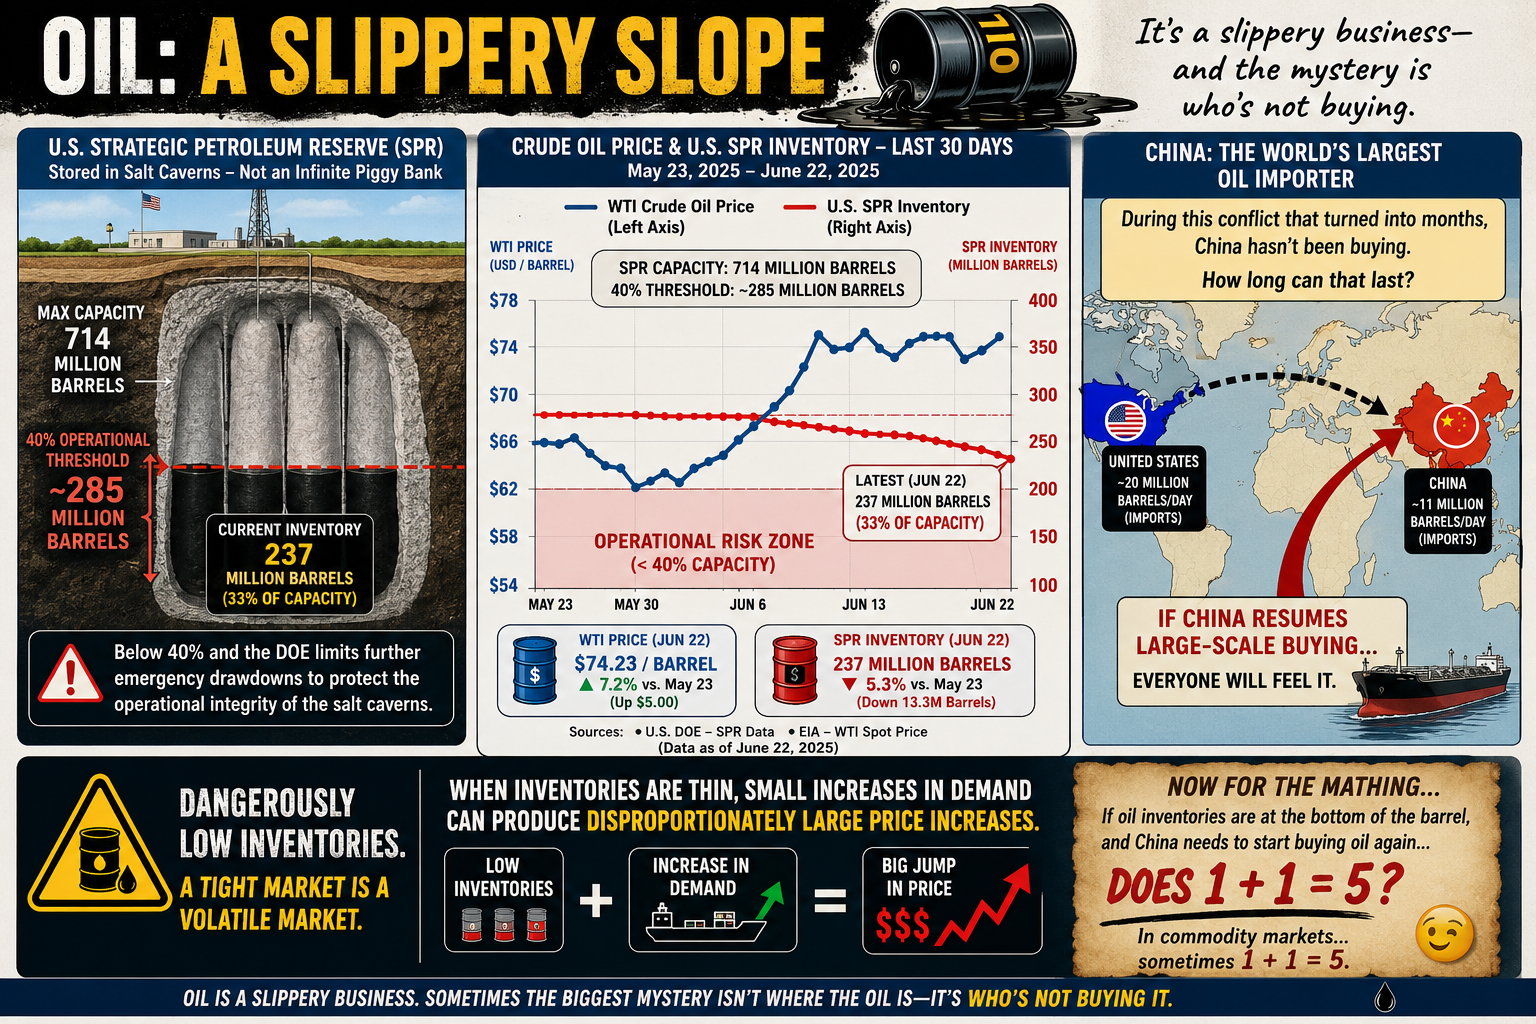
Take the U.S. Strategic Petroleum Reserve (SPR). It’s often treated like a giant underground gas tank that can be drained and refilled at will. Not quite. The reserve is stored in massive salt caverns, and if inventories fall below roughly 40% of its 714 million-barrel capacity (about 285 million barrels), the Department of Energy limits additional emergency withdrawals. The reason isn’t politics—it’s geology. Keeping enough oil in the caverns helps maintain their long-term operational integrity.

The same basic challenge applies everywhere. Oil storage isn’t as simple as stacking barrels in a warehouse. Tanks, pipelines, and underground caverns all have practical operating limits, and those limits can shape energy policy as much as supply and demand.

Then there’s China.

Despite a conflict that many expected would trigger a buying spree, China has reportedly remained on the sidelines for months rather than aggressively increasing crude purchases. Whether that’s because of existing inventories, weak domestic demand, economic strategy, or expectations of lower future prices is open to debate.

The interesting question isn’t whether China can avoid buying oil today. It’s how long it can continue doing so.

Eventually, inventories run down, demand changes, or market conditions shift. And when one of the world’s largest oil consumers steps back into the market, everyone notices.

Oil has always been a slippery business. Sometimes the biggest mystery isn’t where the oil is—it’s who’s not buying it.

Now for the Math…

If global oil inventories are scraping the bottom of the barrel, and the world’s largest importer suddenly has to start buying again…

…does 1 + 1 = 5?

Not in arithmetic. But in commodity markets, sometimes it feels that way.

When supply is already tight, prices don’t rise in a neat, linear fashion. A relatively small increase in demand can trigger a disproportionately large jump in price as buyers compete for the same limited barrels. Traders see it coming, futures markets react, inventories shrink even faster, and a little bit of demand can snowball into a much bigger price move.

In other words, 1 + 1 doesn’t equal 5 because the math changed—it equals 5 because human behavior did.

Oil markets have always had a nonlinear streak. When inventories are comfortable, an extra million barrels a day barely makes a ripple. But when stocks are running low and spare capacity is scarce, that same million barrels can feel like throwing a match into a room full of gasoline.

That’s why economists watch inventories just as closely as production. Sometimes the most important number isn’t how much oil is being pumped—it’s how much is left in the tank.

bookmark_borderAccounting for Climate Responsibility

by Daniel Brouse

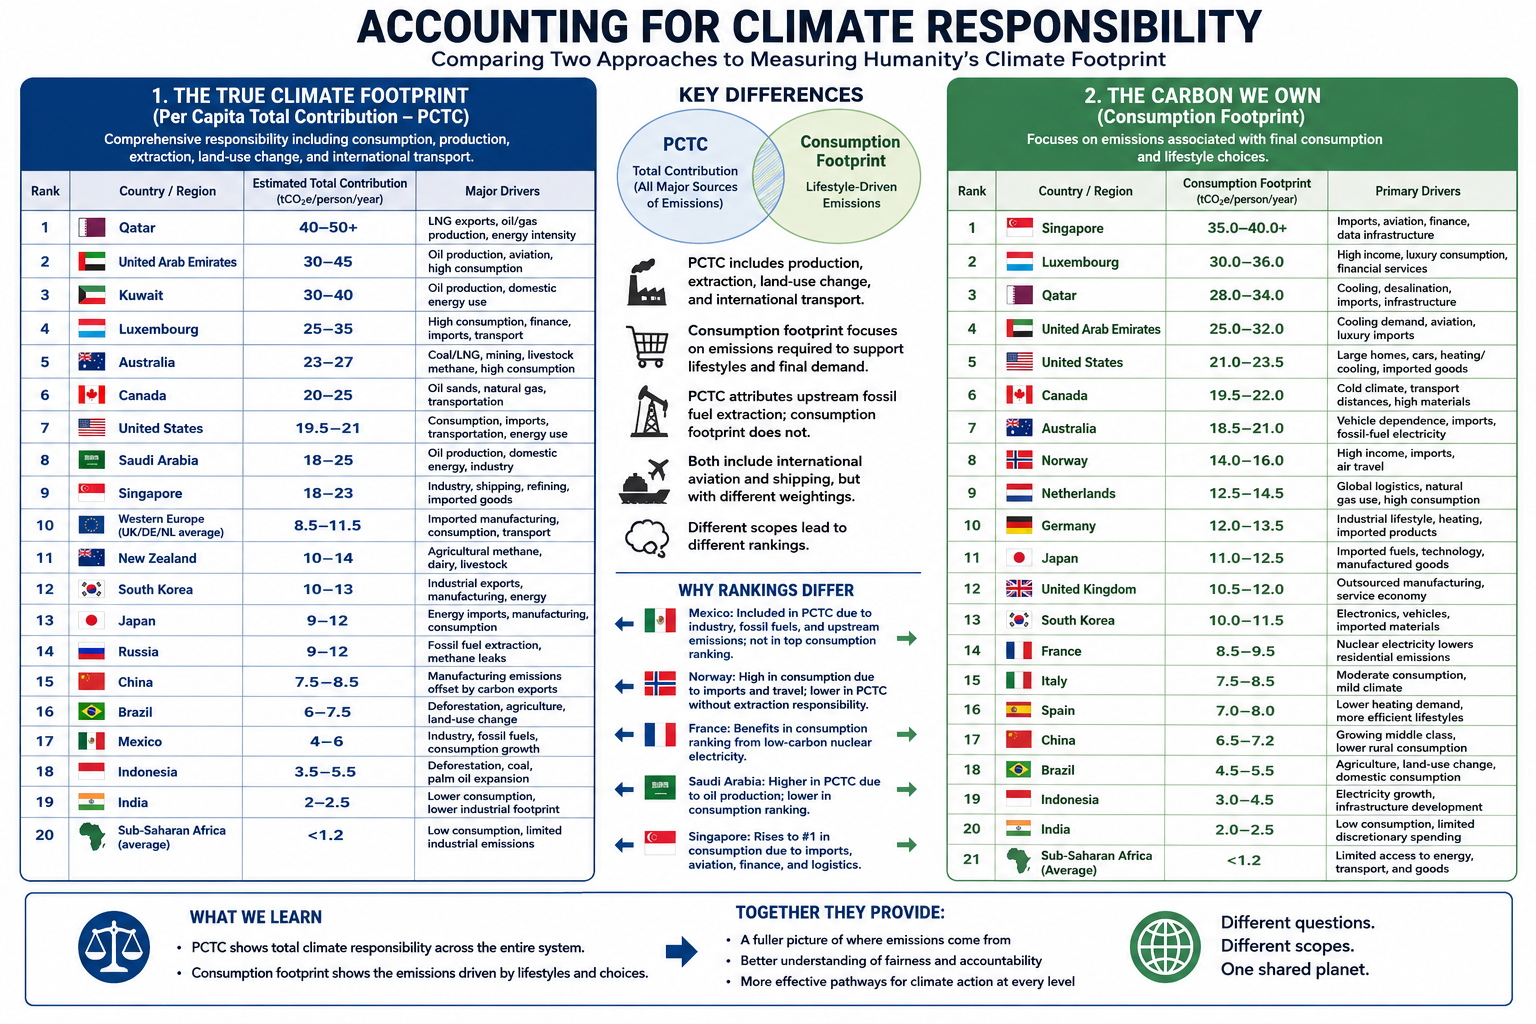
Comparing Two Approaches to Measuring Humanity’s Climate Footprint

Climate responsibility depends on how emissions are assigned. Traditional territorial accounting attributes emissions to the country where they occur, but globalization has made that approach increasingly incomplete. Modern supply chains, international trade, and service-based economies often separate where emissions are produced from who ultimately benefits from them.

To explore this problem from two different perspectives, I developed two complementary accounting frameworks.

The first paper, The True Climate Footprint: Measuring Per Capita Total Contribution Beyond Territorial Emissions, introduces the Per Capita Total Contribution (PCTC) framework. PCTC seeks to estimate an individual’s or nation’s complete climate responsibility by incorporating not only consumption, but also several major sources of emissions that are frequently omitted from conventional carbon accounting.

The True Climate Footprint: Measuring Per Capita Total Contribution

The PCTC framework includes:

  • Consumption-based emissions
  • Land-use change and deforestation
  • Upstream fossil fuel extraction (methane leakage, flaring, and coal mine emissions)
  • International aviation and maritime shipping
  • All major greenhouse gases (CO₂, CH₄, N₂O, and others expressed as CO₂-equivalent)
  • Responsibility associated with fossil fuel production where appropriate

The second paper, The Carbon We Own: Why Consumption Matters More, examines climate responsibility from a different perspective. Rather than estimating total climate contribution, it focuses specifically on the carbon footprint required to support modern lifestyles using a consumption-based accounting approach.

The Carbon We Own: Why Consumption Matters More

This framework emphasizes:

  • Multi-Regional Input-Output (MRIO) accounting
  • Direct household energy use
  • Embedded emissions in imported goods
  • Public and private services
  • Lifestyle and purchasing choices

Unlike PCTC, this framework intentionally places less emphasis on fossil fuel extraction and producer responsibility in order to better isolate the climate impacts associated with everyday consumption.

After completing the first paper, I wanted to examine the climate footprint from the perspective of the consumer rather than the entire climate system. The PCTC framework provides a comprehensive measure of total responsibility, but it does not distinguish as clearly between emissions driven by individual lifestyle choices and those associated with resource extraction or national production.

A consumption-based framework highlights decisions that individuals and societies can influence more directly. Choices such as lowering a home’s thermostat, improving insulation, selecting public transportation or electric vehicles instead of internal combustion vehicles, reducing air travel, or purchasing fewer carbon-intensive goods become more visible within the accounting. It also better captures the increasingly important role of service-based economies. While services may appear less energy-intensive than manufacturing, sectors such as healthcare, finance, telecommunications, cloud computing, and artificial intelligence rely on extensive digital infrastructure—including energy-hungry data centers—that can be substantially underrepresented in traditional emissions inventories.

Finally, I wanted a more detailed comparison among developed economies, particularly within Europe. Countries such as Norway and France illustrate why accounting methodology matters. Norway has one of the world’s cleanest domestic electricity systems, powered primarily by hydropower, yet it is also a major exporter of oil and natural gas. France, by contrast, derives much of its electricity from nuclear power, resulting in comparatively low-carbon domestic energy while maintaining a high standard of living. Comparing these countries under both frameworks reveals how different accounting methods assign responsibility and helps illustrate the strengths and limitations of each approach.

Taken together, these two papers do not compete—they answer different questions. Per Capita Total Contribution (PCTC) asks, What is humanity’s full climate responsibility? Consumption-based accounting asks, What emissions are required to sustain the lifestyle of the average resident? Used together, they provide a more complete understanding of climate responsibility than either framework alone.

Conclusion

Although The True Climate Footprint and The Carbon We Own both seek to improve upon traditional territorial emissions accounting, they answer different questions because they are built on different accounting frameworks.

The True Climate Footprint uses the Per Capita Total Contribution (PCTC) framework to estimate an individual’s or nation’s complete contribution to climate change. It extends beyond consumption to include land-use change, upstream fossil fuel extraction, international shipping and aviation, and the full spectrum of greenhouse gases. In some cases, it also attributes responsibility associated with fossil-fuel production, providing a broad measure of humanity’s total climate impact.

By contrast, The Carbon We Own focuses specifically on consumption-based climate responsibility. Using Multi-Regional Input-Output (MRIO) accounting, it assigns emissions to the final consumer by emphasizing direct household energy use, embedded emissions in imported goods, services, and lifestyle choices. It intentionally deemphasizes extraction and producer responsibility in order to better represent the carbon footprint required to sustain modern patterns of consumption.

Because these frameworks measure different aspects of climate responsibility, their rankings are not expected to be identical.

Mexico provides a useful illustration. Under the PCTC framework, Mexico’s estimated footprint includes domestic industry, fossil fuel production, growing consumption, and upstream emissions, resulting in an estimated contribution of approximately 4–6 tonnes of CO₂-equivalent per person per year. In the consumption-based analysis, however, Mexico does not appear among the highest-ranking countries because the focus is limited to end-user consumption, and the published rankings emphasize the world’s largest per-capita consumption footprints.

Similar differences appear elsewhere. Norway’s position changes substantially because one framework incorporates the climate responsibility associated with fossil fuel production, while the other emphasizes domestic consumption. France benefits in the consumption-based analysis because its low-carbon nuclear electricity reduces household emissions despite maintaining a high standard of living. Saudi Arabia ranks differently depending on whether responsibility is assigned to oil production or to energy consumption. Singapore rises dramatically under consumption accounting because imported goods, international aviation, finance, logistics, and digital infrastructure contribute heavily to its consumption footprint despite relatively limited domestic manufacturing.

These examples demonstrate that accounting methodology influences how climate responsibility is distributed. Production-based, consumption-based, and total-contribution frameworks each illuminate different dimensions of the global climate system.

Rather than viewing these approaches as competing methodologies, they should be regarded as complementary analytical tools. The Per Capita Total Contribution (PCTC) framework asks, What is a nation’s or individual’s total contribution to climate change? The consumption-based framework asks, What emissions are required to sustain the average resident’s lifestyle? Together, they provide a more complete understanding of climate responsibility than either approach can achieve alone, revealing both the systemic impacts of resource production and the powerful role of consumer demand in shaping the global climate.

bookmark_borderClimate Change: A Theoretical 200-Year Probability Envelope

by Daniel Brouse

Derived from the Nonlinear Acceleration Framework

Model Time Horizon:

2026–2226

Outcome Categories:

  1. Climate Stabilization / Managed Transition
  2. Increasing Climate Disruption
  3. Regional Habitability Stress
  4. Global System Stress
  5. Civilization-Scale Contraction
  6. Human Extinction Boundary

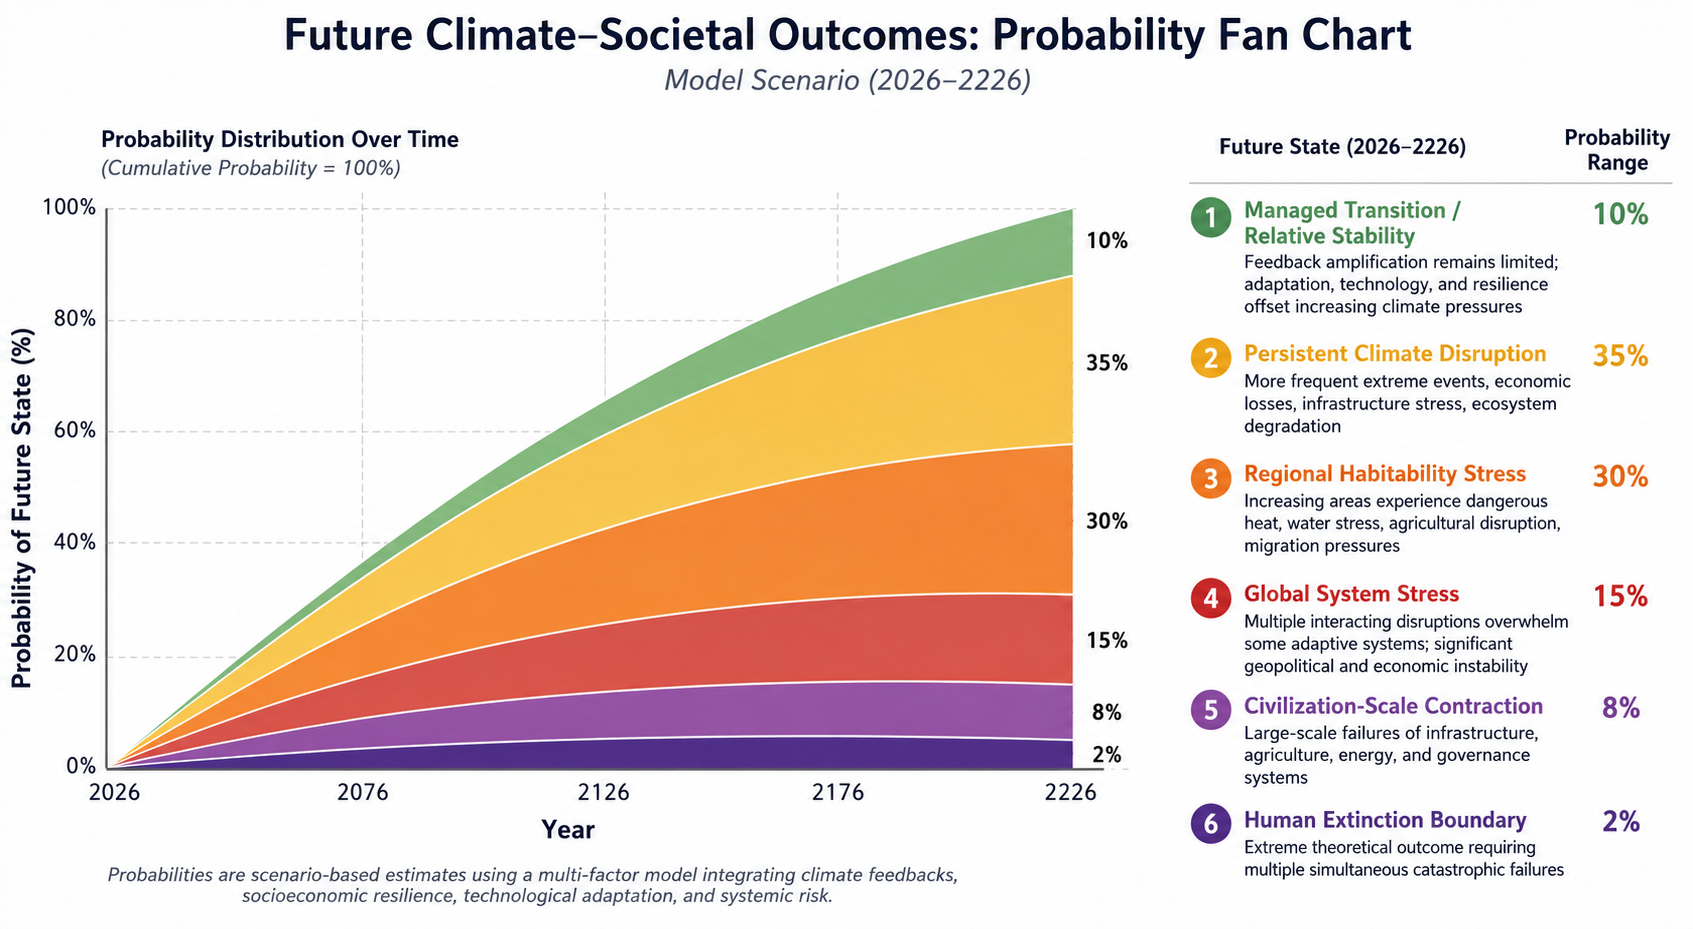
Probability Distribution (Model Scenario)

Future State (2026–2226)Probability RangeFramework Interpretation
1. Managed Transition / Relative Stability10%Feedback amplification remains limited; adaptation, technology, and resilience offset increasing climate pressures
2. Persistent Climate Disruption35%More frequent extreme events, economic losses, infrastructure stress, ecosystem degradation
3. Regional Habitability Stress30%Increasing areas experience dangerous heat, water stress, agricultural disruption, migration pressures
4. Global System Stress15%Multiple interacting disruptions overwhelm some adaptive systems; significant geopolitical and economic instability
5. Civilization-Scale Contraction8%Large-scale failures of infrastructure, agriculture, energy, and governance systems
6. Human Extinction Boundary2%Extreme theoretical outcome requiring multiple simultaneous catastrophic failures

Probability Envelope Visualization

Probability of Future States (2026–2226)

Managed Transition
██████████ 10%

Persistent Disruption
███████████████████████████████████ 35%

Regional Habitability Stress
██████████████████████████████ 30%

Global System Stress
███████████████ 15%

Civilization Contraction
████████ 8%

Human Extinction Boundary
██ 2%

How the Distribution Changes Over Time

The framework assumes that probability is not static.

The distribution evolves as system coupling changes.


Period 1: 2026–2050

Early Acceleration Phase

Dominant processes:

Climate Stress → Extreme Events → Infrastructure Costs → Adaptation Pressure

Estimated distribution:

OutcomeProbability
Managed transition20%
Persistent disruption50%
Regional stress25%
Global stress5%
Civilization contraction<1%
Extinction boundary<1%

Interpretation:

The system remains largely within existing civilization structures, but disruption increases.


Period 2: 2050–2100

Coupling Expansion Phase

Dominant processes:

Multiple Feedbacks → Compound Events → Reduced Recovery Time → Greater System Sensitivity

Estimated distribution:

OutcomeProbability
Managed transition10%
Persistent disruption40%
Regional stress35%
Global stress12%
Civilization contraction3%
Extinction boundary<1%

Interpretation:

The primary shift is from isolated events toward interacting disruptions.


Period 3: 2100–2200

System Transition Phase

Dominant processes:

Climate Stress × Ecosystem Stress × Infrastructure Stress

Estimated distribution:

OutcomeProbability
Managed transition5%
Persistent disruption25%
Regional stress35%
Global stress25%
Civilization contraction9%
Extinction boundary1%

Interpretation:

The probability envelope broadens because uncertainty increases as multiple systems interact.


Period 4: 2200–2226

Long-Term Equilibrium Selection

Possible pathways:

Pathway A: Adapted Earth System

Stress<ResilienceStress < Resilience

Outcome:

Stable but transformed civilization


Pathway B: High-Stress Earth System

Stress≈ResilienceStress \approx Resilience

Outcome:

Persistent disruption and regional instability


Pathway C: Cascading Failure

Stress>ResilienceStress > Resilience

Outcome:

Civilization contraction


The Framework’s Core Equation

A simplified representation:Future Risk=Climate Stress×Feedback Coupling×Acceleration×VulnerabilityResilienceFuture\ Risk = \frac{ Climate\ Stress \times Feedback\ Coupling \times Acceleration \times Vulnerability } { Resilience }


Interpretation of the Upper Boundary

The framework separates:

Planetary Habitability

from:

Human Civilization

The probability hierarchy is:P(Climate Disruption)>P(Regional Stress)>P(Civilization Collapse)>P(Human Extinction)P(Climate\ Disruption) > P(Regional\ Stress) > P(Civilization\ Collapse) > P(Human\ Extinction)

The model therefore treats human extinction as a low-probability upper boundary, not the central pathway.

The more probable outcome under increasing nonlinear acceleration is:

A progressively more difficult Earth for existing human systems to operate within.


Sensitivity Analysis

The largest factors shifting the probability envelope would be:

VariableEffect
Feedback coupling increasesMoves probability toward disruption
Acceleration increasesCompresses response time
Ecosystem degradation increasesRaises vulnerability
Adaptation improvesMoves probability toward stability
Resilience declinesRaises systemic risk
Feedbacks weakenMoves probability toward stabilization

Summary Distribution

The theoretical 200-year envelope:

Most Probable Region:

Persistent Disruption
        ↓
Regional Habitability Stress


Less Probable:

Global System Stress
        ↓
Civilization Contraction


Extreme Upper Boundary:

Human Extinction

Framework Conclusion

Under the Nonlinear Acceleration Framework, the primary risk is not a sudden transition from a habitable Earth to an uninhabitable planet.

The dominant theoretical risk pathway is:

Increasing Feedback Coupling → Accelerating Impacts → Reduced Recovery Time → Growing System Stress → Progressive Civilization Challenges

The extinction boundary exists as the extreme edge of the probability envelope, while the central concern is the increasing probability of a world where human systems must operate under rapidly changing environmental conditions.

bookmark_borderThe Evolution of the American Economy: Capitalism, State Capitalism, and Socialism

Introduction

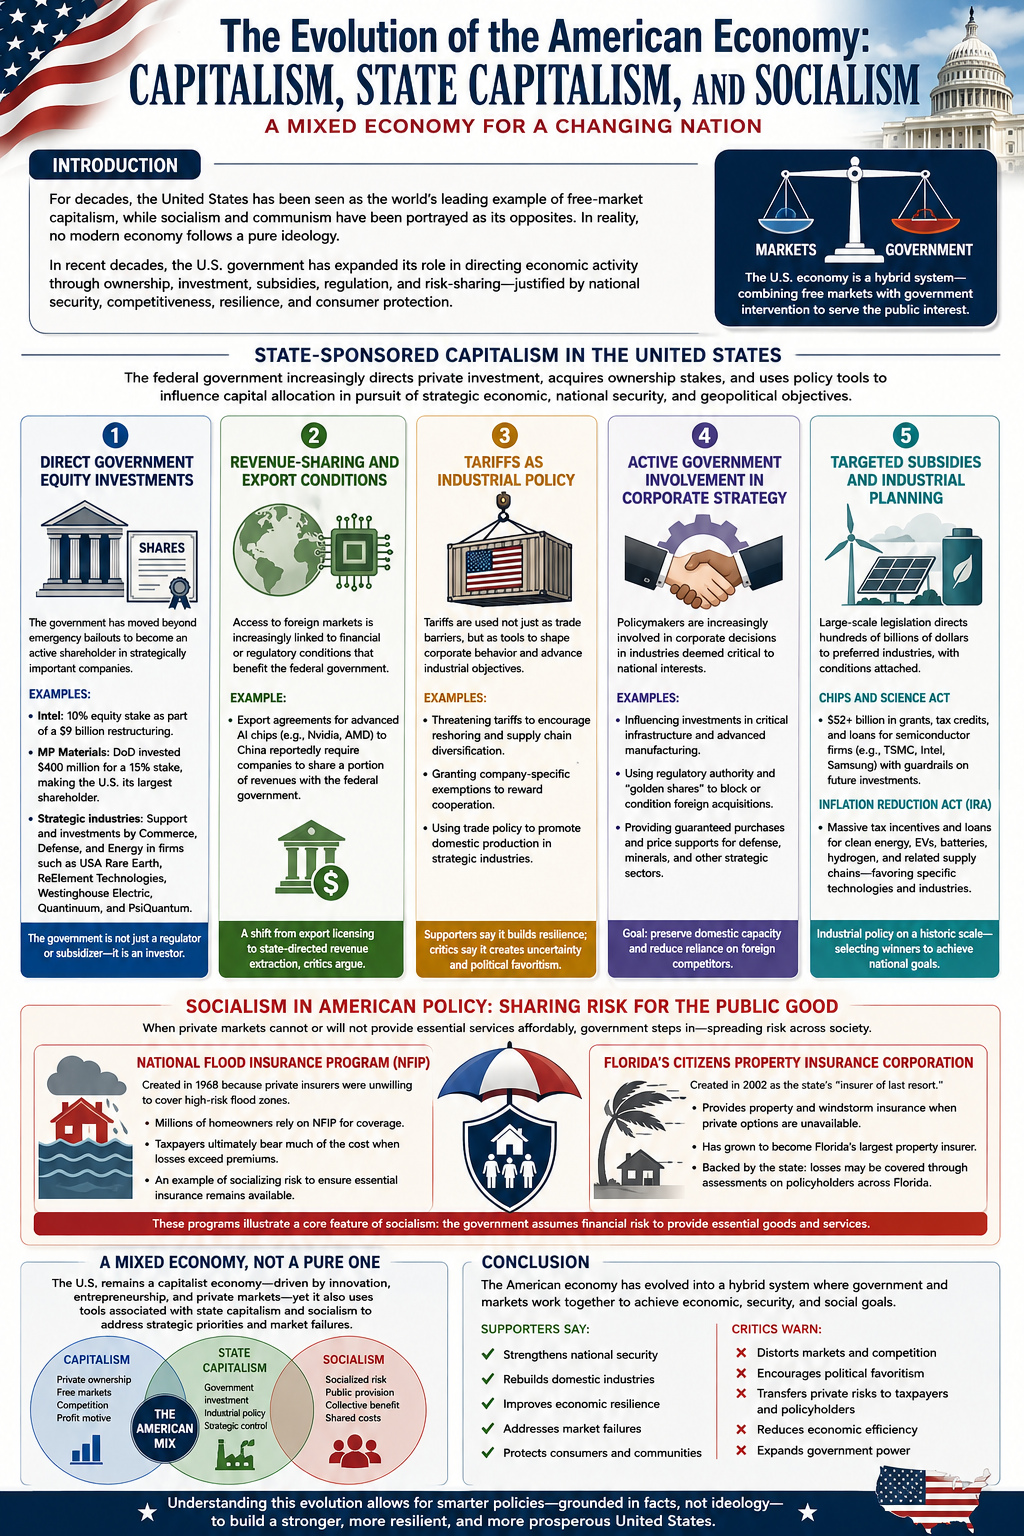
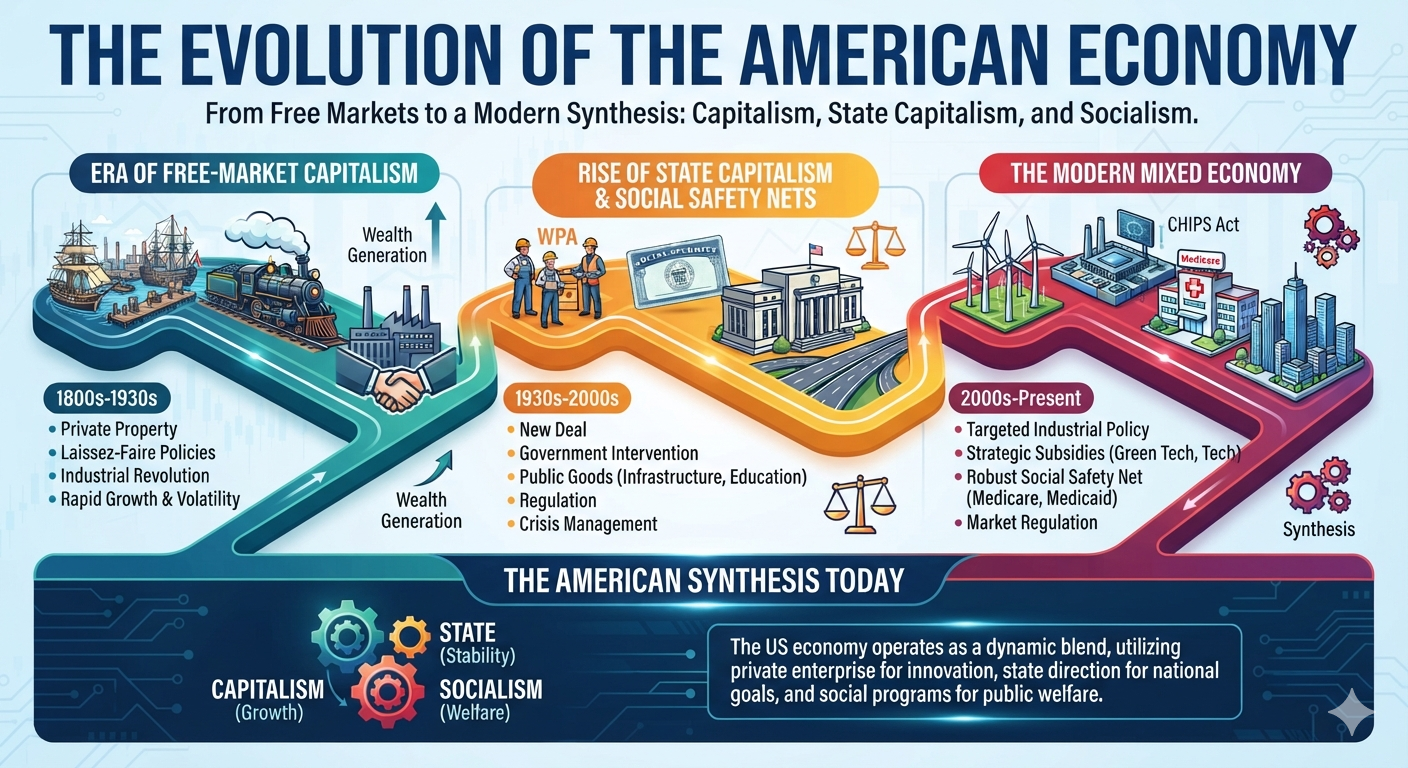
For much of its history, the United States has been portrayed as the world’s leading example of free-market capitalism, while socialism and communism have often been presented as fundamentally incompatible with American economic principles. In reality, no modern economy operates as a pure ideological model. Instead, governments continually adapt their economic policies in response to war, financial crises, technological competition, natural disasters, and changing national priorities.

Over the past several decades—and especially in recent years—the United States has significantly expanded the role of government in directing economic activity. Federal and state governments now provide targeted subsidies, acquire ownership stakes in private companies, shape investment decisions, guarantee markets for strategic industries, and assume financial risks that private markets are unwilling to bear. These policies are generally justified on the grounds of national security, economic competitiveness, supply-chain resilience, disaster recovery, or consumer protection.

This paper examines how these policies reflect characteristics traditionally associated with state-sponsored capitalism and socialism. Rather than arguing that the United States has abandoned capitalism, it demonstrates how the American economy has evolved into a hybrid system that combines free markets with substantial government intervention. Understanding this evolution provides important context for evaluating current economic policy and the changing relationship between government and private enterprise.

State-Sponsored Capitalism in the United States

State-sponsored capitalism (also called state capitalism) refers to an economic system in which the government plays an increasingly active role in directing private investment, acquiring ownership stakes in companies, or using public policy to influence capital allocation in pursuit of strategic economic, national security, or geopolitical objectives.

In recent years, the United States has moved further toward this model. While market mechanisms remain the foundation of the U.S. economy, successive administrations have expanded the federal government’s role through direct investments, industrial policy, subsidies, export controls, tariffs, and other forms of intervention designed to strengthen domestic manufacturing, secure critical supply chains, and enhance national competitiveness.

The principal mechanisms through which the federal government has pursued state-sponsored capitalism include the following:

1. Direct Government Equity Investments

Historically, federal ownership of private corporations was generally limited to temporary emergency bailouts. More recently, however, the government has begun acquiring direct equity positions in strategically important companies.

Examples include:

  • Intel: The federal government obtained a 10% equity stake in Intel as part of a restructuring package that included approximately $9 billion in federal support.
  • MP Materials: The Department of Defense invested approximately $400 million to acquire a 15% ownership stake in MP Materials, making the federal government its largest shareholder while supporting domestic rare-earth mineral production.
  • Strategic Industries: Federal agencies, including the Departments of Commerce, Defense, and Energy, have supported or invested in companies involved in critical technologies and infrastructure, including USA Rare Earth, ReElement Technologies, Westinghouse Electric Corporation, Quantinuum, and PsiQuantum.

These investments represent a notable departure from traditional industrial policy by making the government not only a regulator and subsidizer, but also an investor.

2. Revenue-Sharing and Export Conditions

The federal government has increasingly linked access to export markets with financial or regulatory conditions.

One example is the export framework governing advanced artificial intelligence chips. Agreements allowing companies such as Nvidia and AMD to export certain AI processors to China have reportedly included provisions requiring companies to share a portion of the resulting revenues with the federal government. Critics, including analysts at the Cato Institute, argue that this approach resembles state-directed revenue extraction rather than conventional export licensing.

3. Tariffs as Industrial Policy

Tariffs have become an increasingly important instrument of industrial strategy.

Rather than functioning solely as broad trade barriers, tariffs have also been used to influence corporate behavior.

Examples include:

  • Threatening tariffs to encourage companies to relocate manufacturing or diversify supply chains.
  • Granting company-specific exemptions or adjustments that reward firms aligning with national industrial objectives.
  • Using trade policy to encourage domestic production in strategically important industries.

Supporters argue these measures strengthen national resilience, while critics contend they increase uncertainty and allow greater political influence over private investment decisions.

4. Active Government Involvement in Corporate Strategy

Federal policymakers have become increasingly involved in major corporate decisions affecting industries considered strategically important.

Examples include:

  • Influencing investment decisions involving critical infrastructure and advanced manufacturing.
  • Exercising regulatory authority to discourage foreign acquisitions of strategically important companies.
  • Employing “golden share” mechanisms or comparable government veto powers in selected transactions involving national security interests.
  • Providing guaranteed purchase agreements or price supports for defense-related technologies, critical minerals, and other strategic industries.

These policies seek to preserve domestic industrial capacity while reducing dependence on foreign suppliers.

5. Targeted Subsidies and Industrial Planning

The expansion of state involvement did not begin with direct government ownership. Earlier legislation established a broad framework for government-directed industrial policy through grants, tax incentives, loans, and regulatory requirements.

The CHIPS and Science Act

The CHIPS and Science Act committed more than $52 billion in grants, tax credits, and loan guarantees to expand domestic semiconductor manufacturing. Major beneficiaries include Intel, TSMC, Samsung, and other semiconductor producers.

Recipients were also subject to “guardrail” provisions limiting certain future investments in countries considered strategic competitors.

The Inflation Reduction Act (IRA)

The Inflation Reduction Act created extensive tax credits, grants, and financing mechanisms supporting renewable energy, electric vehicles, battery manufacturing, hydrogen production, and related supply chains.

The legislation represents one of the largest industrial policy initiatives in U.S. history, directing hundreds of billions of dollars toward technologies identified by policymakers as priorities for the energy transition.

A New Economic Model?

Taken together, these policies illustrate a significant evolution in the relationship between the federal government and private enterprise. Rather than relying primarily on market incentives and regulatory oversight, the government has increasingly acted as investor, financier, customer, shareholder, trade negotiator, and strategic planner.

Supporters argue that these interventions are necessary to compete with state-directed economies such as China, strengthen national security, rebuild domestic manufacturing, and secure critical supply chains.

Critics counter that expanding government ownership, selective subsidies, preferential treatment, and direct intervention in private markets blur the traditional distinction between free-market capitalism and state-sponsored capitalism. They warn that such policies may distort competition, encourage political favoritism, and reduce market efficiency.

Whether viewed as a pragmatic response to global competition or a fundamental shift in American economic philosophy, the growing role of the federal government in directing private capital represents one of the most consequential developments in U.S. economic policy in decades.

Socialism

One characteristic commonly associated with socialism is the government assuming responsibility for providing goods or services that private markets are unable or unwilling to provide. In these cases, financial risks and costs are shared across society through taxes, mandatory assessments, or publicly backed insurance programs.

The U.S. insurance industry provides several examples of this approach.

The National Flood Insurance Program (NFIP)

The National Flood Insurance Program (NFIP), administered by the Federal Emergency Management Agency (FEMA), was established in 1968 because private insurers were largely unwilling to provide affordable flood insurance in many high-risk areas.

Rather than leaving homeowners without coverage, the federal government assumed much of the financial risk. Today, millions of property owners purchase flood insurance through the NFIP, with taxpayers ultimately bearing a substantial portion of catastrophic losses when claims exceed collected premiums. The program illustrates how the government has socialized a specific category of insurance risk that the private market has historically struggled to insure profitably.

Florida’s Citizens Property Insurance Corporation

Florida provides one of the clearest state-level examples of government intervention in insurance markets.

The Citizens Property Insurance Corporation was created by the Florida Legislature in 2002 as a government-established, not-for-profit insurer intended to serve as the state’s “insurer of last resort.” Its purpose is to provide property and windstorm insurance for homeowners, condominium owners, renters, and businesses that cannot obtain comparable coverage from private insurers.

As hurricanes have become more destructive, litigation costs have risen, and many private insurers have reduced their exposure or exited the Florida market altogether, Citizens has expanded dramatically. What began as a safety net has evolved into Florida’s largest property insurer, covering well over one million policies.

Unlike a private insurance company operating solely for profit, Citizens is backed by the state. If claims substantially exceed its financial reserves, Florida law allows Citizens to levy assessments on many insurance policies throughout the state to help cover losses. In effect, the financial risk is spread broadly among policyholders rather than borne exclusively by the individual customers who file claims.

A Mixed Economic Model

Programs such as the National Flood Insurance Program and Citizens Property Insurance Corporation illustrate how the United States operates as a mixed economy rather than a purely laissez-faire capitalist system. When private markets fail to provide essential services at affordable prices, governments have often stepped in to provide financing, insurance, or direct support.

Supporters argue that these programs protect homeowners, stabilize housing markets, and ensure that essential insurance remains available despite increasing climate and catastrophe risks.

Critics contend that publicly backed insurance can distort market signals, encourage development in high-risk areas, and shift financial burdens from individual property owners to taxpayers or other policyholders.

Regardless of one’s perspective, these programs demonstrate that government assumption of economic risk—one characteristic often associated with socialist policies—has become an established component of the American insurance system while coexisting with a predominantly private-market economy.

Conclusion

The American economy has never been completely free of government intervention, but the scope and nature of that intervention have changed substantially over time. Today, federal and state governments influence private markets through direct ownership, industrial policy, targeted subsidies, publicly backed insurance programs, trade policy, regulatory oversight, and strategic investments. These policies increasingly resemble characteristics associated with state-sponsored capitalism, while programs such as federally backed flood insurance and state-run insurers illustrate elements commonly associated with socialized risk.

Supporters argue that these interventions strengthen national security, rebuild domestic manufacturing, improve economic resilience, and address market failures that private enterprise alone cannot solve. Critics contend that expanding government involvement can reduce market efficiency, distort competition, encourage political favoritism, and transfer private risks to taxpayers.

The United States remains a capitalist economy, but it is no longer accurately described as a purely laissez-faire one. Instead, it has evolved into a mixed economic system in which free markets coexist with significant government participation. Recognizing this reality allows for a more informed discussion of public policy—one based not on political labels, but on the practical ways governments and markets increasingly work together to shape economic outcomes.

bookmark_borderIce in a Warming World: Climate Change, Giant Hail, and the Nonlinear Escalation of Severe Convective Storms

by Daniel Brouse

Climate Change and Hailstorms

One of the most common misconceptions about climate change is that a warmer planet should produce less ice. In reality, the opposite is increasingly true for severe thunderstorms. While winters are warming and snow cover is declining in many regions, the atmosphere is becoming more energetic, more moisture-laden, and more capable of producing exceptionally large hail.

Hailstorms illustrate one of the central themes found throughout modern climate science: global warming is not simply making the planet warmer—it is making the atmosphere more unstable. The climate system is undergoing a nonlinear increase in available energy, atmospheric moisture, and circulation instability. The result is not gradual change, but an acceleration toward more powerful and destructive weather extremes.

Hail is one manifestation of this broader transition.


Severe Convective Energy Events

Hailstorms are among the most energetic convective weather systems on Earth. They develop inside powerful thunderstorms where intense upward air currents repeatedly lift developing ice particles through layers of supercooled water.

Each trip through the storm adds another layer of ice.

If the updraft remains strong enough, hailstones continue growing until gravity finally overcomes the upward force.

The stronger the storm, the larger the hail.

Large hail has become one of the fastest-growing sources of weather-related insurance losses worldwide, producing billions of dollars in damage each year to:

  • Homes
  • Roofs
  • Windows
  • Solar panels
  • Vehicles
  • Crops
  • Electrical infrastructure
  • Aircraft

Unlike heavy rainfall, which loses much of its kinetic energy through atmospheric friction, hailstones maintain tremendous momentum. Baseball-sized hail can strike the ground at speeds exceeding 100 mph (160 km/h), while the largest hailstones exceed 150 mph.

At those velocities, hail becomes a dangerous projectile capable of causing severe injuries and fatalities.


A Warmer Atmosphere Produces Bigger Hail

The same physical processes described in previous papers—especially the increasing atmospheric water vapor driven by the Clausius-Clapeyron relationship—also fuel hail growth.

Every degree Celsius of warming allows the atmosphere to hold approximately 7% more water vapor.

That additional moisture provides thunderstorms with more latent heat energy.

When this latent heat is released during condensation, it strengthens thunderstorm updrafts dramatically.

The result is a positive feedback:

  • More warming
  • More atmospheric moisture
  • More latent heat release
  • Stronger thunderstorms
  • Stronger updrafts
  • Larger hail

This is another example of Earth’s climate system amplifying itself through reinforcing feedback loops rather than responding linearly.


Updrafts: Nature’s Giant Ice Factory

Imagine a lava lamp operating at maximum power.

Instead of blobs of wax rising through liquid, enormous columns of warm, moisture-rich air accelerate upward through the atmosphere.

Inside these towers:

  • Water droplets freeze.
  • Ice particles are lifted thousands of feet upward.
  • Supercooled water freezes onto existing hailstones.
  • The growing hailstone falls.
  • The updraft catches it again.
  • Another layer forms.

This process repeats many times.

The stronger the updraft, the longer the hailstone remains suspended.

Eventually the hailstone becomes too heavy.

Then gravity wins.

The result is giant hail capable of catastrophic destruction.

As climate warming strengthens convective energy, these powerful updrafts are becoming increasingly common.


Why Small Hail Is Declining

Climate change does not necessarily increase every type of hail.

In fact, many regions may experience fewer small hail events.

This occurs because freezing levels are rising.

As temperatures increase:

  • Snow melts sooner.
  • Ice melts higher in the atmosphere.
  • Small hailstones completely melt before reaching the ground.
  • Large hailstones survive.

The result is a dramatic shift in hail size distribution.

Instead of numerous harmless pea-sized hailstones, storms increasingly produce fewer—but much larger and more destructive—hailstones.

Current projections suggest that by the end of this century:

  • Large hail events may increase by 38–47%
  • Small hail events may decrease by 4–8%

This represents another example of the climate system shifting toward extremes rather than averages.


Geography Is Changing

Historically, the world’s most active hail regions included:

  • The U.S. Great Plains
  • Argentina
  • South Africa
  • Northern India
  • Central Europe

Today, climate models suggest these regions are changing.

Increasing hail environments are projected across:

  • The U.S. Midwest
  • Ohio Valley
  • Northeast
  • Southeastern United States
  • Canada
  • Northern Europe
  • New Zealand’s South Island

The traditional “Hail Alley” of the Great Plains is expected to expand eastward while favorable atmospheric conditions migrate poleward as global temperatures rise.

These geographic shifts mirror changes already observed in atmospheric rivers, jet stream behavior, and storm tracks.


Changing Seasons

The timing of severe hailstorms is also evolving.

Rather than occurring primarily during midsummer, favorable conditions are increasingly appearing during:

  • Early spring
  • Late fall
  • Even portions of winter

Warmer winters allow severe thunderstorms to develop during months that historically experienced relatively stable atmospheric conditions.

This creates new risks for agriculture.

Winter wheat and other cool-season crops become increasingly vulnerable to destructive hail during critical stages of development.


Climate Change Is Increasing Financial Losses

Few weather hazards have produced such rapidly escalating insured losses.

Since 2008:

  • U.S. hail-related insurance claims have increased approximately fivefold.
  • Annual insured losses now regularly exceed tens of billions of dollars.
  • Vehicle damage has become one of the largest components of weather-related insurance costs.

One of the most striking recent examples occurred in northern Italy during 2023.

A series of severe thunderstorms produced approximately $8.6 billion in damages while dropping a European-record hailstone measuring nearly 19 centimeters (7.5 inches) in diameter.

Across North America, giant hail is increasingly damaging:

  • Solar farms
  • Wind facilities
  • Data centers
  • Warehouses
  • Airports
  • Distribution centers

As urban development expands into storm-prone regions, exposure continues to rise even as the storms themselves become more intense.

The result is a compounding economic feedback between climate risk and infrastructure vulnerability.


Human Safety

Although hail is often viewed as primarily a property hazard, it is increasingly becoming a public health concern.

Large hail can:

  • Cause traumatic brain injuries
  • Fracture bones
  • Damage eyesight
  • Kill livestock
  • Trigger multi-vehicle accidents
  • Force aircraft into emergency landings

As giant hail events become more common, so do reports of injuries and fatalities.

The danger is amplified because hail often accompanies tornadoes, destructive straight-line winds, flash flooding, and frequent lightning, creating multiple simultaneous hazards.


A Symptom of a More Energetic Climate

Large hail is not an isolated phenomenon.

It is part of the same global pattern documented throughout this body of work.

The accelerating increase in atmospheric water vapor, ocean heat content, jet stream instability, atmospheric rivers, bomb cyclones, extreme rainfall, wildfire behavior, and severe convective storms all point to the same underlying driver:

An atmosphere containing more energy.

As Arctic amplification weakens the temperature gradient between the poles and the tropics, atmospheric circulation becomes increasingly distorted. Rossby waves become more amplified, blocking patterns persist longer, and weather systems slow or stall. At the same time, warmer oceans and land surfaces inject additional heat and moisture into the atmosphere, providing more fuel for explosive thunderstorms.

When these large-scale circulation changes coincide with abundant moisture and intense surface heating, the result is an environment capable of generating stronger updrafts, larger hail, heavier rainfall, more damaging winds, and more frequent tornado outbreaks. Hail therefore should not be viewed as an isolated weather event, but as one expression of a broader shift toward higher-energy atmospheric dynamics.


The Shift to Extremes

One consistent pattern emerges:

Climate Change → Energy Imbalance → More Atmospheric Moisture + Greater Instability → Stronger Storm Dynamics → More Frequent & More Severe Weather Extremes → Hotter Heat Waves → Wetter Atmospheric Rivers → Larger Wildfires → More Intense Flash Floods → Stronger Hurricanes → Giant Hailstorms

This is the hallmark of nonlinear climate change: a progressive shift from moderate conditions toward increasingly severe outcomes as Earth’s energy imbalance grows. Hail is another visible indicator that the climate system is moving beyond historical norms, where extremes become more common and their impacts more costly.

Understanding hail in this broader context helps connect individual weather disasters to the larger transformation underway in the Earth’s climate system. Rather than isolated anomalies, these events are increasingly linked by the same physical processes: rising atmospheric moisture, greater available energy, and amplifying feedbacks that are reshaping weather across the globe.

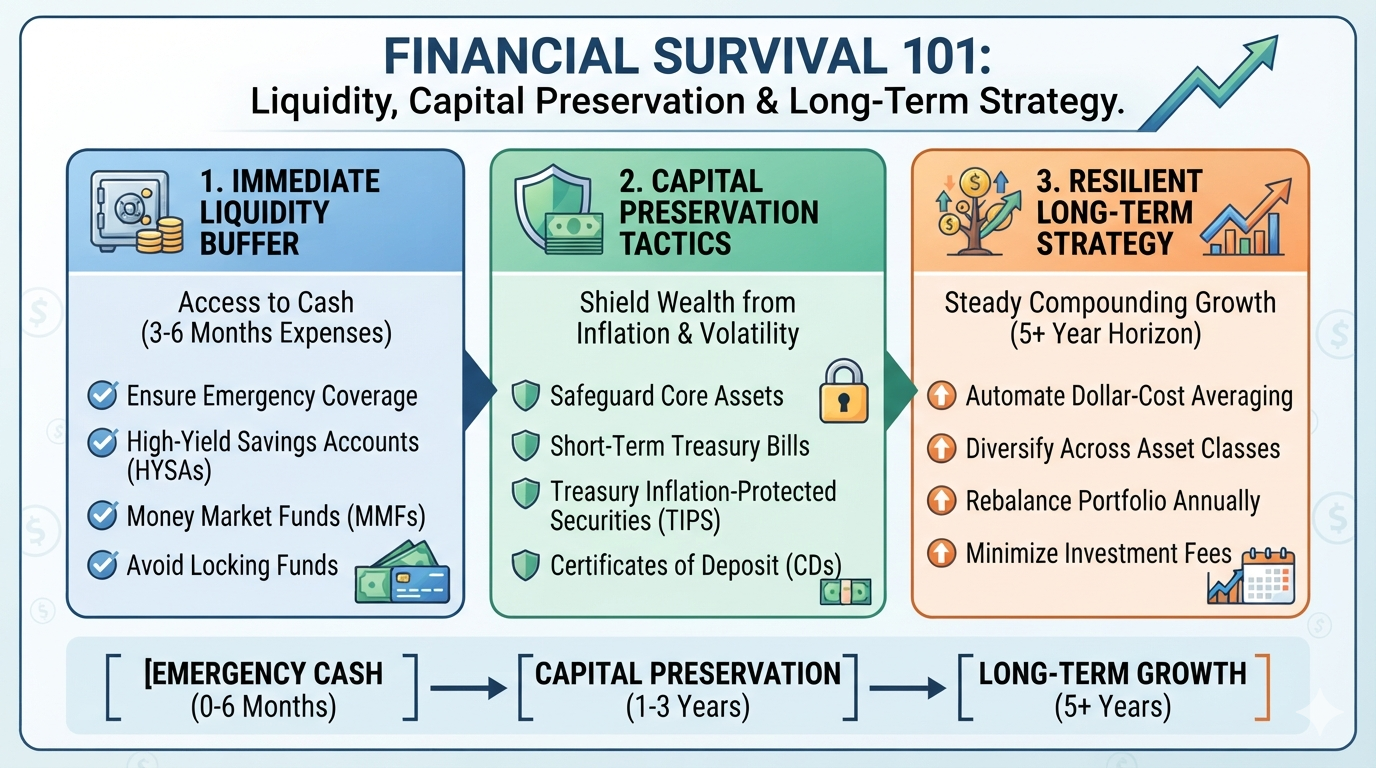
bookmark_borderFinancial Survival 101: Liquidity, Capital Preservation & Long-Term Strategy

Preparing for Economic Uncertainty Without Panic

By Daniel Brouse


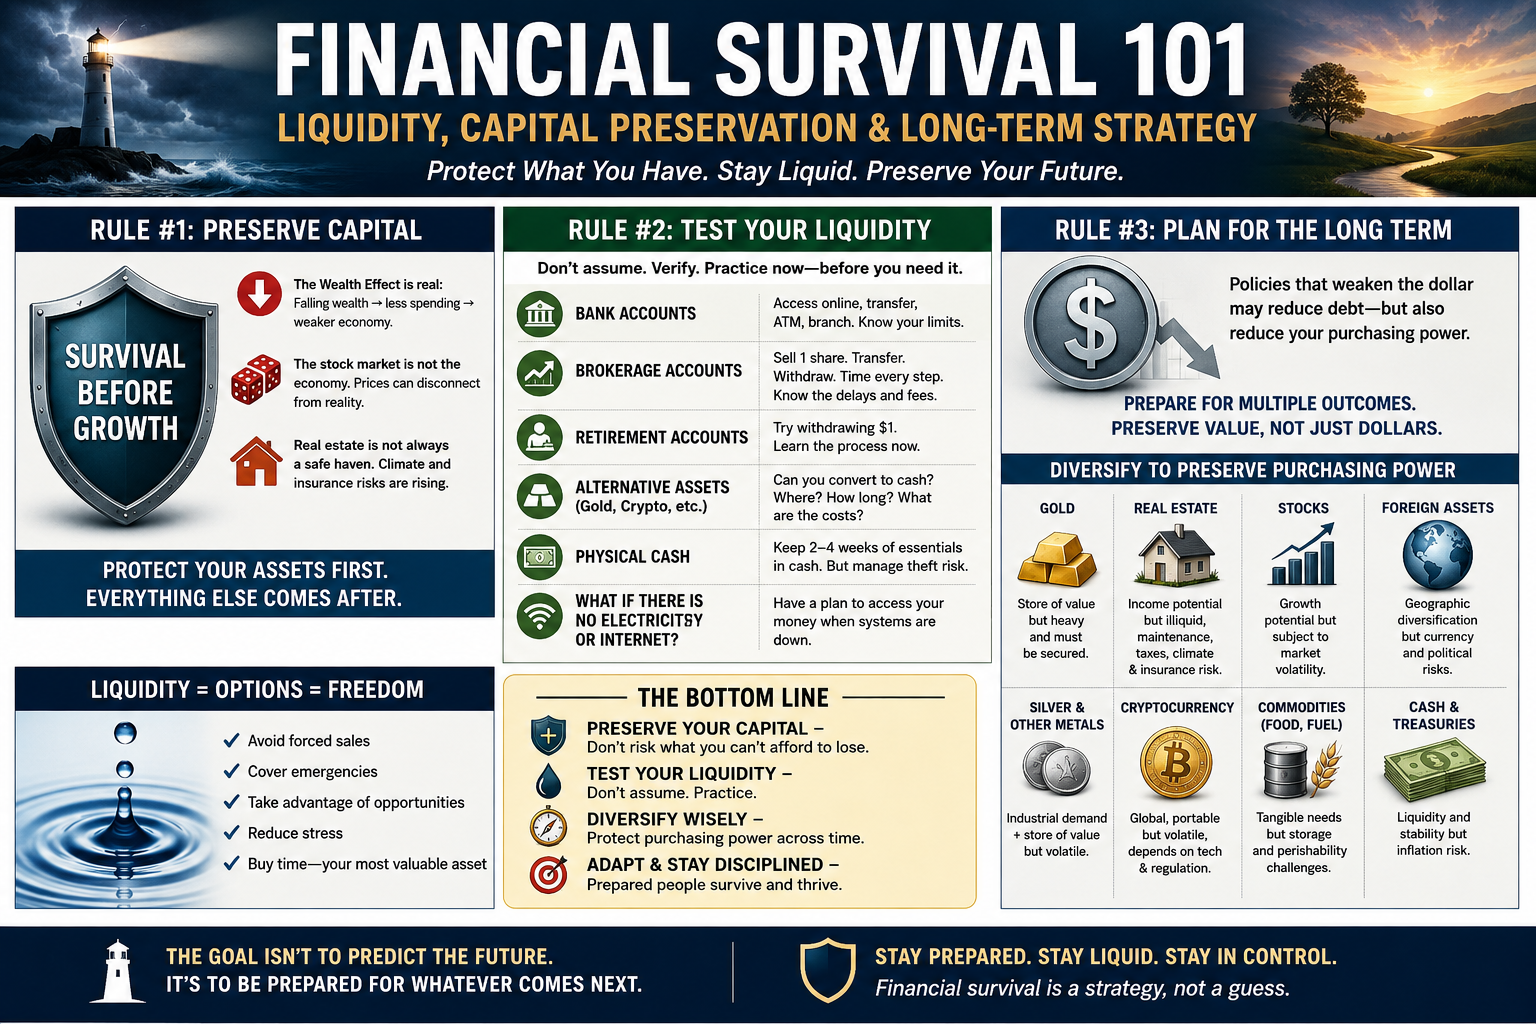
Capital Preservation Is Survival Rule #1

Capital preservation has always been a cornerstone of sound financial planning. In periods of heightened economic uncertainty, however, it becomes the overriding priority.

The goal is not to maximize returns at all costs. It is to ensure that you retain enough purchasing power and financial flexibility to navigate whatever comes next.

One concept increasingly influencing both Wall Street and Main Street is the Wealth Effect.

When household wealth rises—through higher stock prices, appreciating home values, or growing retirement accounts—people generally feel more confident. They spend more, borrow more, and invest more.

The opposite is equally true.

When people perceive themselves to be poorer, they begin cutting expenses. Vacations are postponed. New cars aren’t purchased. Home renovations are delayed. Restaurants see fewer customers. Businesses experience lower sales, which often leads to reduced hiring and layoffs.

The decline becomes self-reinforcing.

What begins as falling asset prices can eventually slow the broader economy.


The Stock Market Is Not the Economy

One of the biggest mistakes investors make is assuming that the stock market and the economy move together.

Over long periods they are related.

Over shorter periods they often are not.

Modern financial markets are increasingly driven by institutional trading, derivatives, leverage, algorithmic trading, and investor sentiment. Prices can become disconnected from underlying economic fundamentals for extended periods.

That means:

  • Rising stock prices do not necessarily mean the economy is healthy.
  • Falling stock prices do not automatically signal economic collapse.

Markets frequently overshoot in both directions.

Investors should avoid making emotional decisions based solely on market movements.


Real Estate Is Not Always a Safe Haven

For generations, real estate has been viewed as one of the safest long-term investments.

That assumption deserves closer examination.

Unlike stocks or bank deposits, real estate is highly illiquid. Selling a property can take weeks or months, and transactions involve significant costs, including commissions, taxes, legal fees, inspections, and financing contingencies.

Climate-related risks are adding another layer of uncertainty.

In many regions, insurance premiums have risen dramatically or insurers have withdrawn from markets altogether. Mortgage lenders are increasingly evaluating climate exposure, flood risk, wildfire danger, and long-term property resilience.

Some coastal communities, wildfire-prone regions, and flood zones are already experiencing declining property values, slower sales, or reduced insurance availability.

Examples include portions of:

  • California wildfire zones
  • Coastal Florida
  • Louisiana
  • Low-lying Atlantic and Gulf Coast communities

These trends do not mean that all real estate is at immediate risk. Many properties may remain attractive for decades. However, location-specific climate and insurance risks are becoming increasingly important considerations in short- and medium-term financial planning. Over the longer term, climate change is expected to affect virtually all real estate to varying degrees. The nature and severity of those risks will differ by location, but no property is likely to remain entirely insulated from changing climate conditions, rising insurance costs, evolving regulations, or shifting market preferences.

Real estate should no longer be evaluated solely by neighborhood, schools, and appreciation potential. Future insurability, financing availability, infrastructure resilience, and climate exposure are becoming equally important.


Step Two: Liquidity

What Good Are Assets If You Can’t Use Them?

After protecting capital comes a second priority:

Liquidity.

Liquidity measures how quickly an asset can be converted into usable cash without suffering significant losses.

During normal times, liquidity is often taken for granted.

During financial stress, it becomes priceless.

Many investors discover too late that assets they believed were readily available actually require days, weeks, or months to access.

That is why liquidity should be tested—not assumed.


Perform Your Own Liquidity Stress Test

Think of this as a financial fire drill.

You hope you’ll never need it.

But you’ll be grateful you’ve practiced.

Bank Accounts

Can you:

  • Access funds through online banking?
  • Use a debit card?
  • Transfer money electronically?
  • Withdraw cash from an ATM?
  • Obtain larger amounts from a local branch?
  • What is your backup plan if electricity, internet access, or electronic payments become unavailable?

Know your daily withdrawal limits.

Understand your bank’s policies before an emergency occurs.


Brokerage Accounts

Try the complete process:

  • Sell one share of a stock or ETF.
  • Transfer the proceeds to your checking account.
  • Withdraw cash.

Time every step.

Record:

  • Settlement delays
  • Transfer times
  • Bank holds
  • Fees
  • Unexpected obstacles

A brokerage balance isn’t liquid until the money reaches your wallet.


Retirement Accounts

Many retirement accounts allow withdrawals under certain circumstances.

Even if taxes or penalties apply, learn the mechanics now.

Understanding the paperwork, timing, and restrictions before an emergency reduces stress later.


Precious Metals

If you own gold or silver, ask yourself:

  • Where would I sell it?
  • How quickly could I receive payment?
  • Would I receive fair market value?
  • Would payment be immediate?

Owning precious metals is different from converting them into cash.

Practice the process.


Cryptocurrency

Crypto markets operate around the clock, but converting digital assets into spendable cash involves several steps.

Can you:

  • Sell cryptocurrency?
  • Transfer proceeds to your bank?
  • Withdraw physical cash?
  • What is your backup plan if electricity, internet access become temporarily unavailable?

Test a small transaction.

Don’t wait until markets become volatile.


Cash on Hand

Most financial planners recommend maintaining an emergency reserve.

Consider keeping enough physical cash to cover several weeks of essential expenses while avoiding excessive amounts that create theft or security risks.

Cash remains useful during temporary disruptions to banking networks, power outages, or payment systems.