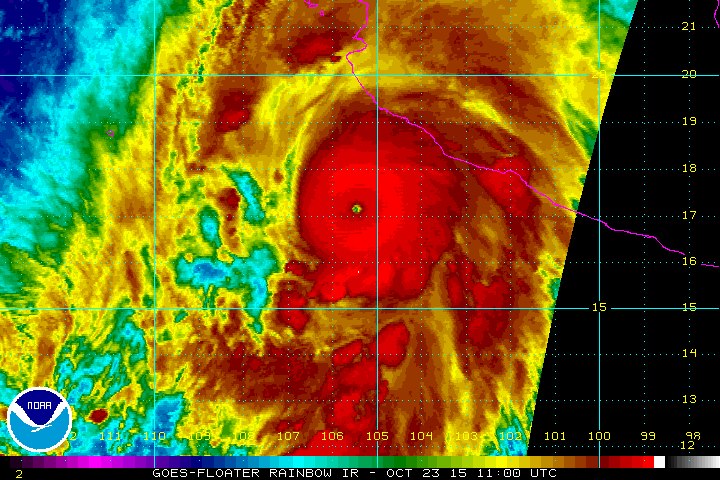
NOAA — Hurricane Patricia is the strongest hurricane on record in the National Hurricane Center’s area of responsibility (AOR) which includes the Atlantic and the eastern North Pacific basins. The minimum central pressure estimated from the aircraft data, 880 mb, is the lowest ever for our AOR. Maximum sustained winds remain near 200 mph (325 km/h) with higher gusts. Patricia is a category 5 hurricane on the Saffir-Simpson Hurricane Wind Scale. Some fluctuations in intensity are possible today, but Patricia is expected to remain an extremely dangerous category 5 hurricane through landfall.
A Hurricane Warning continues from San Blas to Punta San Telmo, and a Hurricane Watch and Tropical Storm Warning from east of Punta San Telmo to Lazaro Cardenas. Preparations to protect life and property should now be completed now.
Patricia is centered as of 7 a.m. CDT about 145 miles (235 km) southwest of Manzanillo, moving toward the north-northwest near 12 mph (19 km/h). A turn toward the north is expected later this morning, followed by a turn toward the north-northeast this afternoon. On the forecast track, the core of Patricia will make landfall in the hurricane warning area this afternoon or evening.
Preparations to protect life and property should be rushed to
completion. Tropical storm conditions are now beginning to spread across portions of the warning area. Hurricane conditions are expected to first reach the hurricane warning area this afternoon.
We are not saying that the Earth’s temperature is just going to rise. In general, as energy is added to a system, the fluctuations in the system increase. So, we expect more storms, more droughts, more wildfires, more floods, more fluctuations of all kinds. What we are saying is that weather conditions will become more volatile due to the impact of humans. (Extreme Weather Events)
— S. Mukherjee & D. Brouse (2004)
So many “1-in-1,000 year” rainfalls is unprecedented, said meteorologist Steve Bowen of Aon Benfield, a global reinsurance firm. “We have certainly had our fair share in the United States in recent years, and any increasing trend in these type of rainfall events is highly concerning,” Bowen said.
A “1-in-1,000 year event” means that there’s a 1 in 1,000 (or 0.1% chance) of it happening in any given year in a given location, the National Oceanic and Atmospheric Administration said.
“Rising water from flooding can carry viruses, bacteria, chemicals and other submerged objects picked up as it moves through stormwater systems, across industrial sites, yards, roads and parking lots,” the South Carolina Emergency Response Team said.
Low level ozone (Tropospheric Ozone) is deadly to plants and animals. The huge increase in human respiratory problems and asthma is largely attributed to ozone.
NASA has released a new study on ozone pollution:
Levels of “background ozone” — ozone pollution present in a region but not originating from local, human-produced sources — are high enough in Northern California and Nevada that they leave little room for local ozone production under proposed stricter U.S. ground-level ozone standards, finds a new NASA-led study.
The researchers, led by Min Huang of George Mason University, Fairfax, Virginia, used a novel technique that combined data acquired from two instruments on NASA’s Aura spacecraft in the summer of 2008. The technique more accurately determines levels of background ozone and their relative contribution to total surface ozone levels. Integrating Aura satellite data into the study increased the estimates of background ozone by an average of 2.4 parts per billion (ppb) over previous estimates, an amount that varied by 4 to 11 ppb over the two states. Huang conducted the study while a postdoctoral scholar at NASA’s Jet Propulsion Laboratory, Pasadena, California.
The new method of integrating satellite data may help provide states with a scientific basis to request exemptions to the federal air quality standards for ground-level ozone proposed by the U.S. Environmental Protection Agency. EPA proposed lowering the standard from the current 75 ppb set in 2008 to between 65 and 70 ppb, following a review of public data on the negative health effects of ozone pollution. EPA is required to announce a final decision by Oct. 1.
Background ozone can be produced from natural local sources such as wildfires, and transported via winds from distant sources, such as the stratosphere or another region or country.
Monthly-mean maximum daily 8-hour average background ozone concentration in parts per billion in California and Nevada, estimated by integrating data from NASA’s Aura spacecraft. Credit: NASA/JPL-Caltech/George Mason University
The NASA study found that, on average, background ozone sources generated about 48.3 ppb, or 77 percent, of the total ozone in the study region of California and Nevada. The findings are particularly important in Northern California and Nevada, where wildfires and ozone transported to the region from abroad can cause background ozone to exceed 60 ppb. The lowest background ozone levels were seen in Southern California, where topography helps trap local emissions.
“Our study shows background ozone plays a significant role in Western U.S. ozone levels under high-ozone conditions, and varies considerably by region, with higher values in many rural regions,” said Kevin Bowman, study co-author and principal investigator of Aura’s Tropospheric Emission Spectrometer (TES) instrument at JPL. “Some regions in the West have high background ozone levels that leave less than 10 parts per billion for local ozone production under the EPA’s most aggressive proposed ground-level ozone standards.”
To more accurately determine which sources are contributing the ozone, the team developed a multi-scale pollution assimilation system that ingests global ozone data from Aura’s TES instrument with nitrogen dioxide data from Aura’s Ozone Monitoring Instrument (OMI). Data from independent aircraft, ozonesondes (balloon-borne instruments that measure the concentration of ozone at various altitudes) and surface monitoring sites tested the system’s predictions. The team estimated the contribution of local and background ozone at surface monitoring sites when ozone levels exceeded EPA thresholds.
Ninety percent of ozone is found in Earth’s stratosphere, where it protects us from harmful ultraviolet radiation. The rest is found in Earth’s lower atmosphere, the troposphere, where it acts as a greenhouse gas. At ground level, however, ozone is a key component of smog, produced when nitrogen oxides photochemically react with sunlight in the presence of volatile organic compounds. Ground-level ozone also affects human and ecosystem health. Nitrogen dioxide, the most important ingredient in the production of ozone, comes primarily from cars and industrial emissions, as well as natural sources, such as wildfires.
Critics of EPA’s proposed new standard argue it would throw many areas out of compliance, resulting in economic burdens, and that much of the ozone in their regions comes from non-local pollution. When a county or area is found to be out of compliance, it must act to reduce its ozone emissions. Proponents of the new standard argue the reductions are essential to protect public health. EPA is not allowed to consider economic costs in its decision.
Contributions of background ozone (green bars) and local, human-produced emissions to ozone levels greater than 65 parts per billion (horizontal red dash line) at surface sites in various regions. Credit: NASA/JPL-Caltech/George Mason University
The Clean Air Act allows states to request an exemption to the ozone standard if they can show that the cause of an air-quality violation is due to ozone from outside the country or from natural causes. To date, only Wyoming has been granted an exceptional event clearance by EPA due to high background ozone levels.
“By assimilating NASA satellite data on ozone and nitrogen dioxide, our study improves calculations of total and background ozone levels from both non-local ozone and wildfires, data that may prove useful to policymakers,” said Huang. “Our method can potentially be applied broadly to predict air quality in other time periods and locations. We plan to conduct follow-up studies over longer time periods, especially during higher wildfire periods.”
Bowman points to a recent NASA study that showed pollution entering the western United States from Asia has offset expected reductions in mid-tropospheric ozone from local sources. “The partitioning between background and local human sources will likely change in the future, as emissions from outside the United States continue to increase, and contributions from drought-related wildfires grow due to climate change. These changes will require additional reductions in local human-produced emissions to meet EPA standards.”
Bowman said the results highlight the importance of a new international constellation of low-Earth orbiting and geostationary satellites that will continuously observe pollution over Asia, Europe and North America, including NASA’s planned Tropospheric Emissions: Monitoring of Pollution (TEMPO) mission. “This constellation will be a game changer in quantifying global sources of local pollution,” he said.
Study results were published recently in the Journal of Geophysical Research: Atmospheres. Other participating institutions include the University of Iowa, Iowa City; NOAA, College Park, Maryland; University of Colorado, Boulder; and NASA’s Goddard Space Flight Center, Greenbelt, Maryland. JPL is managed for NASA by the California Institute of Technology in Pasadena.
There is a lot of misleading information trending in social-media about Nestle and the California drought. The facts of the matter are:
Most of the water in California is used for agriculture. Nearly 50 billion cubic metres (13 trillion gallons) of water is used in California each year. Nestle bottled water plants only use 705 million gallons a year. Almond growers use about as much water each year as the entire city of Los Angeles. What percentage of California’s water is used by agriculture? 80 %.
The real cause of the problem is Human Induced Climate Change. As droughts increase in frequency and intensity, the sea level is rising. So not only are the droughts a problem, but salt water intrusion is also a problem. As these problems worsen, the solution is not to blame bottled water companies. Nor is the solution to build desalination plants. Not only do desalination plants contribute to global warming, they also are devastating to the ocean. “Fish and other marine organisms are killed on the intake screens (impingement); organisms small enough to pass through, such as plankton, fish eggs, and larvae, are killed during processing of the salt water .” [Heather Cooley, Newsha Ajami, Matthew Heberger, The Pacific Institute December 11, 2013]
The solution is for humans to take responsibility for the climate change and take action.
The extreme weather conditions have fueled wildfires in Northern California.
“I’m in shock. I want to cry. I’m looking at my neighbors’ places, and they’re all gone, and I’m still here,” Middletown homeowner Jim Maurer said. “We’re just shaking our heads.”
The AP reports: The fire and another in the Gold Rush country of the Sierra Nevada foothills, about 120 miles to the southeast, are the worst of a dozen burning in the state. Between them, they have destroyed at least 720 homes and hundreds of other structures and displaced 23,000 people, fire officials said.
Citing dry conditions from four years of drought, Mark Ghilarducci, director of the Governor’s Office of Emergency Services, called this summer’s fires some of the most volatile he’s seen in 30 years of emergency response work.
Q: What causes the most illness in the United States?
A: Bad air quality
The leading causes of bad air quality are Particulate Matter, Ground Level Ozone, Sulfur Dioxide (SO2) and Nitrogen Oxide (NOx).
Asthma is a chronic lung disease that affects an estimated 16.4 million adults and 7.0 million children in the United States, regardless of age, sex, race, or ethnicity.(1) Although the exact cause of asthma is unknown and it
cannot be cured, bad air quality is believed to be the main cause. In particular, low level ozone is causing an increase in asthma-like symptoms.(2) What many people believe are food allergies are just symptoms of respiratory and immune system damage caused by ozone.
Low level ozone (tropospheric ozone) is highly volatile and is created in large part due to vehicle emissions. “Ground level ozone is a serious problem in cities with lots of traffic, such as Los Angeles, Philadelphia, Houston and New York City. In 2013, according to the American Lung Association, nearly four in 10 people in the United States (38 percent) lived in areas with unhealthful levels of ozone.” (3) The use of ethanol in gasoline is causing a dramatic increase in low level ozone.(4)
The EPA monitors ozone levels and issues action alert days. “Action days are usually called when the AQI gets into the unhealthy ranges. Different air pollution control agencies call them at different levels. In some places, action days are called when the AQI is forecast to be Unhealthy for Sensitive Groups, or Code Orange. In this case, the groups that are sensitive to the pollutant should reduce exposure by reducing prolonged or heavy exertion outdoors. For ozone this includes: children and adults who are active outdoors, and people with lung disease, such as asthma. For particle pollution this includes: people with heart or lung disease, older adults and children.”(5)
“When ozone levels are very high, everyone should be concerned about ozone exposure.”(6)
NOAA reports: Three major hurricanes continue over the Pacific Ocean this morning.
Hurricane Ignacio is centered about 320 miles east of Hilo, Hawaii, with maximum sustained winds of 115 mph – a Category 3 hurricane on the Saffir-Simpson Hurricane Wind Scale. There are no coastal watches or warnings in effect, but interests in the Hawaiian Islands should continue to closely monitor the progress of Ignacio.
Hurricane Jimena is centered about 1430 miles east of Hilo, with maximum sustained winds of 150 mph – a strong Category 4 hurricane on the Saffir-Simpson Hurricane Wind Scale. There are no coastal watches or warnings in effect.
Hurricane Kilo is centered about 530 miles south of Midway Island, with maximum sustained winds of 135 mph – a Category 4 hurricane on the Saffir-Simpson Hurricane Wind Scale. There are no coastal watches or warnings in effect.
There are a growing number of scientist that have concluded climate change is severe. Recently, Jim Hansen, a professor at Columbia University’s Earth Institute, wrote:
“One conclusion we share in the latter paper is that ice sheet models that guided IPCC (Intergovernmental Panel on Climate Change) sea level projections and upcoming United Nations meetings in Paris are far too sluggish compared with the magnitude and speed of sea level changes in the paleoclimate record. An implication is that continued high emissions likely would result in multi-meter sea level rise this century and lock in continued ice sheet disintegration such that building cities or rebuilding cities on coast lines would become foolish.
The bottom line message we as scientists should deliver to the public and to policymakers is that we have a global crisis, an emergency that calls for global cooperation to reduce emissions as rapidly as practical. We conclude and reaffirm in our present paper that the crisis calls for an across-the-board rising carbon fee and international technical cooperation in carbon-free technologies. This urgent science must become part of a global conversation about our changing climate and what all citizens can do to make the world livable for future generations.”
A new study, written by James Hansen (NASA’s former lead climate scientist) and 16 co-authors, concludes that glaciers in Greenland and Antarctica will melt 10 times faster than previous estimates. The result could be a sea level rise of at least 10 feet in the next 50 years. Hanson said the new findings would be “substantially more persuasive than anything previously published.”
“We conclude that continued high emissions will make multi-meter sea level rise practically unavoidable and likely to occur this century. Social disruption and economic consequences of such large sea level rise could be devastating. It is not difficult to imagine that conflicts arising from forced migrations and economic collapse might make the planet ungovernable, threatening the fabric of civilization.”
WASHINGTON –The U.S. Environmental Protection Agency (EPA) today released one of the most comprehensive analyses to date on the economic, health and environmental benefits to the United States of global climate action. The peer-reviewed report, “Climate Change in the United States: Benefits of Global Action,” examines how future impacts and damages of climate change across a number of sectors in the United States can be avoided or reduced with global action. The report compares two future scenarios: a future with significant global action on climate change, where global warming has been limited to 2 degrees Celsius (3.6 degrees Fahrenheit), and a future with no action on climate change (where global temperatures rise 9 degrees Fahrenheit). The report then quantifies the differences in health, infrastructure and ecosystem impacts under the two scenarios, producing estimates of the costs of inaction and the benefits of reducing global GHG emissions.
“Will the United States benefit from climate action? Absolutely. This report shows us how costly inaction will be to Americans’ health, our environment and our society. But more importantly, it helps us understand the magnitude of benefits to a number of sectors of the U.S. with global climate action,” said EPA Administrator Gina McCarthy. “We can save tens of thousands of American lives, and hundreds of billions of dollars, annually in the United States by the end of this century, but the sooner we act, the better off America and future generations of Americans will be.”
The report examines how the impacts and damages of climate change across a number of sectors in the United States can be avoided with global action. The findings include:
• Global action on climate change reduces the frequency of extreme weather events and associated impacts. For example, by 2100 global action on climate change is projected to avoid an estimated 12,000 deaths annually associated with extreme temperatures in 49 U.S. cities, compared to a future with no reductions in greenhouse gas emissions. This is more than a 90 percent reduction from what we would expect with no action.
• Global action now leads to greater benefits over time. The decisions we make today will have long-term effects, and future generations will either benefit from, or be burdened by, our current actions. Compared to a future with unchecked climate change, climate action is projected to avoid approximately 13,000 deaths in 2050 and 57,000 deaths annually in 2100 from poor air quality. Delaying action on emissions reductions will likely reduce these and other benefits.
• Global action on climate change avoids costly damages in the United States. For nearly all of the 20 sectors studied, global action on climate change significantly reduces the economic damages of climate change. For example, without climate action, we estimated up to $10 billion in increased road maintenance costs each year by the end of the century. With action, we can avoid up to $7 billion of these damages.
• Climate change impacts are not equally distributed. Some regions of the United States are more vulnerable than others and will bear greater impacts. For example, without action on climate change, California is projected to face increasing risk of drought, the Rocky Mountain region will see significant increases in wildfires, and the mid-Atlantic and Southeast are projected to experience infrastructure damage from extreme temperatures, heavy rainfall, sea level rise, and storm surge.
• Adaptation can reduce damages and costs. For some sectors, adaptation can substantially reduce the impacts of climate change. For example, in a future without greenhouse gas reductions, estimated damages from sea-level rise and storm surge to coastal property in the lower 48 states are $5.0 trillion dollars through 2100. With adaptation along the coast, the estimated damages and adaptation costs are reduced to $810 billion.
The report is a product of the Climate Change Impacts and Risks Analysis (CIRA) project, led by EPA in collaboration with the Massachusetts Institute of Technology, the Pacific Northwest National Lab, the National Renewable Energy Laboratory, and other partners. The CIRA project is one of the first efforts to quantify the benefits of global action on climate change across a large number of U.S. sectors using a common analytic framework and consistent underlying data inputs. The project spans 20 U.S. sectors related to health, infrastructure, electricity, water resources, agriculture and forestry, and ecosystems.