bookmark_borderNew Jersey Requires Climate Change Risk Analysis for Building Permits

The New York Times reports, “With 130-Mile Coast, New Jersey Marks a First in Climate Change Fight

New Jersey will become the first state to require that builders take into account the impact of climate change, including rising sea levels, in order to win government approval for projects, Gov. Philip D. Murphy announced on Monday.

The move by Mr. Murphy, a Democrat, is part of a widening effort by states to use regulations to address worsening climate conditions and to aggressively counteract the Trump administration’s push to roll back environmental regulations.

“This is not abstract for us,” Mr. Murphy said in an interview. “This is real. The dangers are there.”

New Jersey’s initiative is believed to be the broadest, and most specific, attempt to leverage land-use rules to control where and what developers can build, and to limit the volume of emissions that are spewed into the air.

“It gives us the ability to say no, or to say, ‘You have to do it differently,’” said Kathleen Frangione, the governor’s chief policy adviser.

Mr. Murphy, through executive order, will require the state Department of Environmental Protection to begin the process of drafting new regulations to be adopted by January 2022. The changes do not require legislative approval, but could face legal and political challenges.

Do you need flood insurance?

  • Homeowners insurance does NOT cover flooding
  • Flood insurance is obtained through the government’s flood insurance program
  • Flood insurance does not cover the basement of a house
  • Flood insurance covers a lifetime maximum of $250,000 in coverage
    This means if you make a claim for $150,000 the maximum coverage for the life of the property drops to $100,000.

The Human Induced Climate Change Experiment

bookmark_borderThe True Costs (and Benefitlessness) of a Trump Economy

January 23, 2020

What are the costs and benefits to the United States under a Trump economy?

Financial Analysis: Current State of Affairs
First, start with a financial analysis — a snapshot of the current economic health of the nation. What would a financial analysis that is similar to an individual applying for a bank loan, or a married couple visiting a financial planner for their retirement plan, look like? What are the assets and liabilities? What type of assets and liabilities are in your portfolio? What are your saving patterns? Did you get a large gift from your parents or have you been showing a strong pattern of saving over time? What is your income? Have you made dubious loans to yourself? Where does your income come from? What is your credit history?

A financial analysis of the U.S.A. results in a failing grade.

Impacts of Fiscal and Monetary Policy
After examining the current state of affairs, examine the fiscal policies of the Executive Branch and the monetary policies pushed onto the Federal Reserve. The Trump administration has taken extremely negative positions with free-trade, as well as, jeopardized the standing of the world reserve currency.

Tariffs
The Trump administration has destroyed the United States leadership in free-trade. Huge taxes were placed upon the American public through the use of tariffs. The tariffs were put on goods and services from around the world and paid for by the American consumer. The placement of tariffs have circumvented congress’ oversight and consumer protection considerations. Not only do tariffs introduce new taxes on the population, they also destroy trade relationships with other countries. That is to say, tariffs and retaliatory tariffs cause foreign countries to look elsewhere for their imports. For example, China’s retaliatory tariffs on agriculture resulted in China developing new trade partnerships that do not include the USA.

Here is a partial list of Trump Tariffs:
Solar panels: 15 – 30%
Washing machines: 16 – 50%
Steel and aluminum: 10 – 25%
Chinese products: 15 – 50%
South Korean products: 25%

More tariffs were placed on India, Canada, Mexico, the European Union and others.

Tariffs not only have a direct impact on U.S. current affairs, but they will leave everlasting damage.

Inflation
The overall Trump economic policy has put the economy at risk of high inflation and interest rates.

Inflation Update: Immigration and the Wage Inflation Spiral (June 12, 2022)
An important factor in the 2022 record inflation situation can be traced back to the Trump immigration policy.

The US has stagnant population growth (as does the UK, EU, etc. Japan has a declining population.)

During the Trump administration, the US drastically curtailed immigration. The Biden administration continues to do so today.

The result has been wage inflation. The wage inflation that started in 2018 began the overall inflation spiral that continues today. A wage inflation spiral happens when the initial wage inflation is canceled out by the price inflation requiring further wage inflation to keep up with the price inflation… the increase prices require more wage inflation for employees to keep pace with the cost of living… the subsequent rise in wages results in the need to raise prices to pay the workers… and round and round we go.

The solutions are to either increase our population (through immigration) and/or increase our productivity by eliminating the need for humans.

How the Inflation Spiral Started: Immigration
The Trump administration’s policy on immigration and building The Wall have a devastating impact on the economy. The U.S. economy is a capitalistic system based on population growth. The birth rate in America is close to zero percent. In order to maintain the standard of living, the country needs to gain millions of people through immigration. The Trump policies have attempted to eliminate immigration.
— Daniel Brouse (2020)

* “Over the course of four years, the Trump administration set an unprecedented pace for executive action on immigration, enacting 472 administrative changes that dismantled and reconstructed many elements of the U.S. immigration system. Humanitarian protections were severely diminished. The U.S.-Mexico border became more closed off. Immigration enforcement appeared more random. And legal immigration became out of reach for many. All of this was accomplished nearly exclusively by the executive branch, with sweeping presidential proclamations and executive orders, departmental policy guidance, and hundreds of small, technical adjustments.” — Migration Policy Institute’s Four Years of Profound Change (2022>

* “After years of wage stagnation, we are finally seeing rising wages,” Donald Trump (State of the Union 2018)
“The Employment Cost Index, a measure of salary and benefit costs, registered a 2.6 percent gain for the full year, tied for the best since 2007.” — CNBC (January 31, 2018)

* From December of 2020 through January of 2022, nominal wages and salaries were up 4.5 percent, the fastest increase since 1983. — Bureau of Labor Statistics (BLS)

World Reserve Currency
“A nation that prints its own currency, and that currency is the world reserve currency, is not threatened by deficits. Until that currency stops being the reserve currency,” said Sidd Mukherjee.

The U.S. dollar as the world reserve currency has given the United States an unfair economic advantage. The U.S. has been able to “print” and borrow money in ways that break the rules of economics; however, the Trump administration has jeopardized the standing of the dollar as the world reserve currency.

The major economic powers of the world entered into a nuclear arms deal with Iran called the Joint Comprehensive Plan of Action (JCPOA). In October of 2017, Trump began pulling out of the agreement. On May 8, 2018, Trump announced the United States withdrawal from JCPOA and declared economic warfare on Iran. The warfare included “tough new sanctions” on Iran. The other countries to the treaty attempted to maintain the JCPOA by developing a new system to by-pass the world reserve currency.

Germany, France and Britain officially set up a European mechanism to facilitate non-dollar trade with Iran, the Instrument in Support of Trade Exchanges (Instex). Russia and other countries have since joined Instex.

Risk Management
The future of the nation is dependent on current risk management. “On the High Risk List; the fragmentation, overlap, and duplication annual report; natural disasters and climate change; and other topics,” reports the General Accounting Office of the USA. Pollution, in particular air pollution, is also a substantial risk. CO2, methane and other greenhouse gases have all increased under the Trump plan. Trump has withdrawn from the Paris Agreement and has consistently called climate change a hoax.

It’s never a good idea to say “never”… but, risk-management-denial always increases the probability of a worse case scenario.

Not only is our nation’s current cash-flow severely hemorrhaging due to extreme weather events (and other costs associated with climate change), but this is just the tip of the iceberg. Climate change denial is risk-management-denial.

Pollution and Climate Change Costs Unsustainable

Trump recently stated, “We have the cleanest air.” This is a boldfaced lie. Air pollution in the form of particulates and ozone are a severe health emergency in the United States.

“According to a 2009 report, around ’60 percent of Americans live in areas where air pollution has reached unhealthy levels that can make people sick.’ Air pollution can cause a variety of health problems including, but not limited to infections, behavioral changes, cancer, organ failure, and even premature death.” (Wikipedia) Air pollution is the number one cause of illness in the world and the second leading cause of death. The cost of air pollution can not be contained by one country — pollution knows no borders. It is estimated 8 million people a year die from air pollution.

A report by Stanford and Carnegie Mellon University states, “Air pollution negatively impacts the U.S. economy, costing the U.S. roughly 5 percent of its yearly gross domestic product (GDP) in damages ($790 billion in 2014). The highest costs come from early deaths, attributable to exposure to fine particulate matter (PM2.5).” The number had been falling up to 2016, but Trump has dramatically undermined clean air laws. As of December 2019, Trump had rolled back 95 environmental protection laws.

Air pollution also contributes to the climate change crisis, and in an exponential feedback loop, climate change contributes to air pollution. For instance, the wildfires in California and Australia were made more severe due to human induced climate change. The wildfires resulted in air pollution that costs billions of dollars in damages, illness and death. The wildfires also contributed to greenhouse gases and climate change that will result in more wildfires.

Though a huge cost, the climate change / air pollution feedback loop is just a small cost of climate change. Not only has the Trump administration not properly assessed the risk of climate change, the administration has undermined efforts to mitigate climate change. Even more brazen, the administration has enacted policies that hasten the devastation of global warming.

The costs of climate change are huge. The Hamilton Project and the Stanford Institute for Economic Policy Research reports, “Damages to the U.S. economy grow with temperature change at an increasing rate.” The Washington Post reports, “Climate change could cost the U.S. economy up to 10.5% of GDP by 2100.” The cost of not adapting to climate change will likely cripple the American economy.

The current costs, the costs of not adapting, and the costs of not preventing climate change are overwhelming to calculate. Take flood insurance as an example. Sea level rise and extreme weather events have redrawn floodmaps and bankrupted the National Flood Insurance Program. What flood insurance that is still available has started a series of exponential increases in premiums. Real estate along the coasts and flood prone areas will become worthless in the coming years.

The other costs associated with the Trump administration’s climate change policy is too long to list.  Fossil fuel elimination and climate change mitigation our essential for risk management.

Immigration and the Acquisition Of Private Property
The Trump administration’s policy on immigration and building The Wall have a devastating impact on the economy. First, the U.S. economy is a capitalistic system based on population growth. The birth rate in America is close to zero percent. In order to maintain the standard of living, the country needs to gain millions of people through immigration. The Trump policies have attempted to eliminate immigration.

Also of a long-term negative impact is the building of The Wall. Funds to build the wall were diverted against the will of congress. The funds were then used to seize private land. The land seizures and The Wall have had a major impact on nature preserves and indigenous sacred grounds. Just as detrimental are the eminent domain acquisitions of individuals’ land. Socialization of private property is an attack on the economic system. The costs to the economy and freedom are not quantifiable.

Income Inequality
The Trump administration’s policies have widened the economic divide and income inequality in the United States.  Trump said, “inequality is down.” The next day federal data was released and the Washington Post reported, “The separation between rich and poor from 2017 and 2018 was greater than it has ever been.”

“Wages are up, and inequality is down. Something that people don’t like writing about.” Trump said during a press conference following the United Nations General Assembly meeting in New York. Again, this is not true. The Economic Policy Institute reports, “Slow wage growth is a key sign of how far the U.S. economy remains from a full recovery. Nominal wage growth since the recovery officially began in mid-2009 has been low and flat.”

BENEFITS
There have not been any real benefits from Trump policies. Some people try to point to employment and tax cuts.

Employment
Employment and unemployment numbers became irrelevant as an economic indicator in the 1990’s. The internet and the worldwide web transformed the definition of employment. In addition, you would need to deduct all the jobs lost through the elimination of most temporary work visas. Many of these jobs have not been filled, especially in agriculture, horticulture and hospitality. Billions of dollars in wages and taxes have been eliminated through the Trump immigration policy. These numbers are not included in employment figures.

During the fourth quarter of 2016, 7.6 million people were unemployed. At the end of 2018, 9.0 million people remained unemployed. Yet, Trump claims to have created 5 million new jobs. Do the math.

In January 2020, Trump boasted at a campaign rally in Wildwood, NJ that “factory jobs were the best ever in the history of the United States.” Reuters reported, U.S. factory sector in deepest slump in more than 10 years. “The U.S. manufacturing sector fell into its deepest slump in more than a decade in December as the U.S.-China trade war kept a lid on factory output, orders and employment…. The Institute for Supply Management (ISM) said its index of national factory activity fell to 47.2 last month from 48.1 in November. It was the lowest reading since June 2009 and, coupled with readings for both new orders and factory employment at multi-year lows, thwarted expectations for a leveling off in the pace of decline in a sector buffeted by trade tensions. ”

Tax Cuts
The only beneficial tax cut that has been made by the administration was to lower corporate taxes. Corporate profits are already taxed as income to shareholders. The corporate tax is double taxation. A fair tax policy would not have corporate taxation. However, the other Trump trade and tax policies’ negative impacts far outweigh the positive impact of a reduction in corporate tax rates.

But, What About Obama?
Obama increased the national debt by about $1 trillion/year. Trump is increasing the national debt by about $1 trillion/year. What makes Trump worse than Obama — Trump is suppose to be a fiscally conservative Republican. Obama wasn’t suppose to be. So, for that reason, Trump’s deceit makes it worse than Obama. Trump is not stopping the problem. Worse yet, he is contributing to the problem at the same rate as Obama, as well as, putting the future economy at risk through bad trade and environmental policies. Trump is trying to con the American public into a false narrative on the economy.  In fact, this is not “the best economy ever. Rather, it is the worst economy ever.

Morning Brew reported, U.S. Budget Deficit to Exceed $1 Trillion in 2020. “The U.S. budget deficit will top $1 trillion this year, according to a new report from the nonpartisan Congressional Budget Office (CBO). What that means: The government will spend $1.02 trillion more than it collects in 2020. The widening deficit is a result of the 2017 tax cuts and an increase in spending on federal programs.”

By 2020, the debt to GDP ratio hit its highest level ever at 125%.

Conclusion
The national debt is unsustainable. The debt, risk-management-denial, deceit, nationalism, and greed will sink our ship.


ABOUT THE AUTHOR
The responsibility an economist accepts is to determine the “costs and benefits of our actions on society.” Then, attempt to convert the difference into dollars. Is economics opinion? That depends on your value of the costs and benefits of your actions on society.
bookmark_borderWorst Economy Ever: United States Financial Health in 2020 Hindsight

by Daniel Brouse
Economist, Pi Gamma Mu

January 22, 2020

The U.S. economy is the worst in history. There are several measures for the health of an economy. One of the best is the “debt to GDP” ratio. National debt divided by the nation’s gross domestic product = debt to GDP ratio.

During 2019, the nation’s debt to GDP ratio reached a record high (when the Fed’s balance sheet is included.)

Calculation:
23.177 trillion $ 2019 Debt
3.8 trillion $ assets on the Federal Reserve’s balance sheet
_______________
26.977‬ trillion
/ divided by the GDP
21.439 trillion
_______________
125.83% debt to GDP ratio

One hundred and twenty-five percent is the highest debt to GDP ratio in the history of the United States of America.

When an individual borrows money, their debt to income ratio usually can not exceed 36%. The debt to income ratio is a reliable indicator of the ability to repay a loan. Exceptions are made for young borrowers with likely prospects of wage growth. The growth rate of the US GDP has been flat and is projected to go lower.

When a nation borrows money, the debt to GDP ratio also determines the ability to repay the debt. Therefore, it is safe to say the U.S. is in the worst economic position ever.

It’s not really a good idea to compare the debt to GDP ratio to other countries or periods in time. A better rule of thumb would be a ratio under 40% and preferably close to 0; however, for those that are curious:
Denmark — 35%
Switzerland — 33%
Australia — 47%
China — 47%
UK — 87%
Mozambique — 119%

The USA historically has had a ratio in the 30% range from 1967 through 1984. The last time the ratio came close to today’s 125% was in 1945 – 1947 when the ratio hit 119% due to the effects of WWII, the recession, and President Truman’s economic policies.

Why the Fed’s Balance Sheet is Important
It is very important to include the assets on the Federal Reserve’s balance sheet in the calculation. The reason being — the Fed should not have any assets on its balance sheet. When the Fed buys assets from the Treasury, the government is in fact borrowing the money from itself. The government is “printing” money. The government is competing with the private sector to lend the government money. Interest rates are artificially low due to the lack of competition. Borrowing more money to repay debt is unsustainable.

The U.S. General Accounting Office (GAO)
The GAO has the best accountants in the world. The GAO says: “The Comptroller General testified before Congress about the government’s unsustainable fiscal outlook, the need for a long-term plan to address growing debt, and other aspects of the nation’s fiscal health.” The comptroller concludes the continued growth of public debt is unsustainable. “This statement is based on our prior work on the High Risk List; the fragmentation, overlap, and duplication annual report; natural disasters and climate change; and other topics.”

Worst Economy Ever
The U.S. economy is currently the worst in the nation’s history. At no time in history has our debt + Fed assets / GDP = 125%. The economy is unsustainable.

bookmark_borderThe Collapse Of Nature

Worldwide insect populations are in decline by as much as 80%. Insects are in a downward spiral threatening a “catastrophic collapse of nature’s ecosystems”, as reported by a global scientific review.

“Unless we change our ways of producing food, insects as a whole will go down the path of extinction in a few decades. The repercussions this will have for the planet’s ecosystems are catastrophic to say the least.”

The review was published in the journal Science Direct is entitled, “Worldwide decline of the entomofauna: A review of its drivers” by Francisco Sánchez-Bayo, Kris A.G.Wyckhuys, etal.

Highlights

• Over 40% of insect species are threatened with extinction.
• Lepidoptera, Hymenoptera and dung beetles (Coleoptera) are the taxa most affected.
• Four aquatic taxa are imperiled and have already lost a large proportion of species.
• Habitat loss by conversion to intensive agriculture is the main driver of the declines.
• Agro-chemical pollutants, invasive species and climate change are additional causes.

“If insect species losses cannot be halted, this will have catastrophic consequences for both the planet’s ecosystems and for the survival of mankind,” said Francisco Sánchez-Bayo.

“The main cause of the decline is agricultural intensification,” Sánchez-Bayo said. “That means the elimination of all trees and shrubs that normally surround the fields, so there are plain, bare fields that are treated with synthetic fertilisers and pesticides.”The demise of insects appears to have started at the beginning of the 20th century, accelerated during the 1950’s and 1960’s and reached “alarming proportions” over the last twenty years.

“If insect species losses cannot be halted, this will have catastrophic consequences for both the planet’s ecosystems and for the survival of mankind”

The Human Induced Climate Change Experiment

bookmark_borderMusic Modernization Act

by Daniel Brouse

For years, the music moguls, executives, record companies and other middlemen in music have been trying to pass this law – MMA

The new law creates a “modern” music management company [Collective Management Organization (CMO)] staffed mainly by existing music management.

All artists must pay the new entity.

The new law also creates royalties for producers… even if you don’t currently pay a producer, you do now. Even if you are a musician that produces your own music, you will pay these other producers.

There is no increase in gross income. There is no increase in revenue.

All existing artists that get a share of the money will now have to give royalties to music companies that weren’t getting paid for music recorded before 1972. Though they will be paid by you, you will not be allowed to cover their material without paying them again.

In conclusion:
Out of all artists/musicians share of the existing gross income,
artists will pay these other people… BY LAW.

(As a result, all independent artists will see a decrease in their net income/share.)

Meet your new boss. Same as the old boss… unless you are… I mean were an independent artist. In that case, meet your boss. You are no longer independent.

ONGOING COSTS TO MUSICIANS, ARTISTS and MUSIC
Ever since the 1920’s when the mafia would shakedown speakeasies for royalties, the music industry has attempted to control the distribution of music. In the 70’s, they tried to control the “taping” of music. In the 2000’s, they tried to control music downloads with lawsuits against NAPSTER and little old ladies.

“On September 8, 2003, the recording industry sued 261 American music fans for sharing songs on peer-to-peer (P2P) file sharing networks, kicking off an unprecedented legal campaign against the people that should be the recording industry’s best customers: music fans. Five years later, the recording industry has filed, settled, or threatened legal actions against at least 30,000 individuals. These individuals have included children, grandparents, unemployed single mothers, college professors….” (Electronic Frontier Foundation)

Now, they are trying to control “streaming” music. What does this mean? Radio stations that stream their programming? Musicians that stream their music to videos?
 
The ongoing problems and lawsuits of trying to define what they control will likely be detrimental to musicians and music for decades to come.

Question: Seems like if you produce your own stuff and register it all correctly, you get more for your work than current standards. Thoughts?

Answer: I wish. No… or at least unlikely… if you already do those things, you are already getting 100% of your royalties. The streaming companies already have all their deals with the record labels, such as, Sony and Warner. This new law was started years ago before those deals were cut. So now the money companies like spotify and apple pay out, will stay the same; however, part of your 100% money will be shifted to the labels (to pay their producers, engineers, pre-1972 publishing, etc. and this new management company.) It’s hard to say exactly how much you will lose… probably 25% or so. For most people it won’t matter. If you have been getting $7.43/year… you might only get 5/year now. The larger problem will be in their lawsuits against people like facebook. If they sue facebook over streaming music, you may lose your ability to stream for free… or youtube… or anybody that streams music. Not just live streams, but all digital music that streams. In theory, they could try to shut them down like NAPSTER.

Also see: S.2823 – Music Modernization Act
and
H.R. 1551: An Act to modernize copyright law, and for other purposes.

bookmark_borderRobo Call Scams and Spoofs

Sidd said:

Briefly, the idea is this: someone calls you up
spoofs the callerid on your phone
so that your phone displays bank phone number
then they reel of a bunch of information about you
….
but they then ask for security code on card, PIN, mothers maiden name

and it’s game over

when you get a call or voicemail purporting to be from your bank
manually dial the number on your card
like with your fingers

Don’t trust the net to find the phone number for your bank
scammers have been populating search results with fake numbers

If you pick the call up and someone claims to be from the bank
say, “cool, tanx. I’m going to hang up now and call the number
I have on my card and that you claim to be from.”

https://krebsonsecurity.com/2018/10/voice-phishing-scams-are-getting-more-clever/

Another spoof seen in the wild is getting a text message from UPS/USPS/FedEx/DHL/… with a link pretending to
be a tracking number for a package. Or an email.

If you click on that link, it goes to a website that installs malware.

Best way to handle is to write down the tracking number, go to the company web site and type it in.

other versions pretend to be your doctor/dentist/insurance company …

Careful out there, mind how you go. Give no information out to callers, and treat voicemail/email/texts with caution.

More Computer Internet Security, Privacy and Safety

bookmark_borderA Capitalist Growth Economy

International Economics 101

“On a finite planet, endless economic growth is impossible.”

1) The US is built on a “capitalist growth economy”
2) A capitalistic growth economy is dependent on population growth
3) Inbreeding of ignorant racists is not a growth economy strategy (such as Germany did through World War II)
4) Immigration (such as Germany is doing now) is the answer

The United States should learn from Germany’s lessons.

Trade Wars, Teriffs, Taxes and Trade Restriction

Financial Forecast and Economic Outlook

bookmark_borderMonetary Policy Report to the Congress

“The [Federal Open Market Committee] will continue to strike a balance between avoiding an overheating economy and bringing … price inflation to 2 percent on a sustained basis,” Chairman Jerome H. Powell said Congress as Fed chair.

The new Chairman of the Federal Reserve made his first testimony to Congress:

The Congress has assigned us the goals of promoting maximum employment and stable prices. Over the second half of 2017, the FOMC continued to gradually reduce monetary policy accommodation. Specifically, we raised the target range for the federal funds rate by 1/4 percentage point at our December meeting, bringing the target to a range of 1-1/4 to 1-1/2 percent. In addition, in October we initiated a balance sheet normalization program to gradually reduce the Federal Reserve’s securities holdings. That program has been proceeding smoothly. These interest rate and balance sheet actions reflect the Committee’s view that gradually reducing monetary policy accommodation will sustain a strong labor market while fostering a return of inflation to 2 percent.

n gauging the appropriate path for monetary policy over the next few years, the FOMC will continue to strike a balance between avoiding an overheated economy and bringing PCE price inflation to 2 percent on a sustained basis. While many factors shape the economic outlook, some of the headwinds the U.S. economy faced in previous years have turned into tailwinds: In particular, fiscal policy has become more stimulative and foreign demand for U.S. exports is on a firmer trajectory. Despite the recent volatility, financial conditions remain accommodative. At the same time, inflation remains below our 2 percent longer-run objective. In the FOMC’s view, further gradual increases in the federal funds rate will best promote attainment of both of our objectives. As always, the path of monetary policy will depend on the economic outlook as informed by incoming data.

From Semiannual Monetary Policy Report to the Congress, Chairman Jerome H. Powell, Before the Committee on Financial Services, U.S. House of Representatives, Washington, D.C.

bookmark_borderThe Economic Monsters: Inflation and Interest Rates

Economist

  1. Economic Forecast = Inflation (2018)
  2. Inflation Bites (2022)
  3. U.S. Mass Consumption Results in Global Economic Disparity, Inequity, and Poverty (2023)
  4. Investment Recommendation: Savings Bonds / I Bonds (2023)
  5. Your National Debt (2023)
  6. Economic Facts on Immigration, Budget Deficits and Inflation (2024)
  7. The Federal Reserve and the Chevron Decision (2024)
  8. Drill, Baby, Drill: The Existential Threat of Trump Economics (2024)
  9. The National Debt and the Printing of Money (2024)

Part I: Economic Forecast = Inflation

In 2006 and 2007, we forecast the impending “great recession”. Our investment advice was to sell all your real estate. If you could not sell it, leverage it to the hilt (so you had your cash out before failure.)

Turned out to be an accurate forecast.

In 2017 and 2018, we are forecasting inflation and rising interest rates. Buy real estate now and lock-in your 30-year interest rates ASAP. [WARNING: Do not buy real estate on or near floodplain. See disclaimer below.] [WARNING: This paper was first published in 2018. Since that time the forecast has reached fruition. It is too late to beat rising interest rates.]

WHY?

* Quantitative Easing and the Troubled Asset Relief Program (TARP) was started during the height of the 2008 financial crisis. In essence, it allowed the Treasury to print money.

* In 2017 Donald Trump started enacting policies that mirrored his personal finances — borrow too much money and don’t plan on paying it back. Mr. Trump has been involved in 6 bankruptcies.

* When the government borrows lots of money without a payback plan, they compete with the private sector to borrow money resulting in a rise in interest rates. This phenomena is known as crowding out (economics). (1)

* President Trump bragged about wage inflation during his State Of The Union (SOTU) address. When wages go up without an increase in productivity, the prices of goods and services inflate.(2)

* “Make America Great Again” policies make the American dollar weak. Tariffs and trade protectionism undermine the value of the dollar and contribute to inflation. (3)

* President Trump replaced the Chairwoman of the Federal Reserve with a new chair who is not an economist. A first in U.S. history.

* Tax cuts without spending cuts result in a budget deficit. The nation’s debt is now bigger than its gross domestic product. Net interest payments on the debt are estimated to total $276.2 billion this fiscal year, or 6.8% of all federal outlays. The tax cuts are expected to make this payment explode.

* The Federal Reserves primary weapon for fighting inflation is to raise interest rates. (4)

You could say inflation and rising interest rates are a two-headed monster. When the government creates money, it is “inflationary.” The government fights inflation by raising interest rates. Rising interest rates exponentially increase the national debt. When the government borrows, it competes with consumer borrowing causing interest rates to rise.

The name given to the worst-case scenario is hyper-inflation. We don’t expect hyperinflation in the US in the near future; however, higher interest rates in the US will result in hyperinflation in other parts of the world. (See Part III below.)

WARNING: Do not buy real estate on or near floodplain.
Do not invest in real estate that is located near floodplain. Make sure your property has land ingress and egress from the closest 1,000-year-floodplain. Do not invest in any property located near a coast. Do not invest in a property that is below sea level. Do not invest in real estate located in Florida.

“Mostly stay away from the coasts because of both wind and rain issues from weather systems spinning inland. Even if you are not in a floodplain, a couple feet of rain in a day will cut off roads and overwhelm your sump pumps. Not to speak of wind taking power and telecom down.” — Sidd Mukerhjee (February 5, 2018)

For more information on Flood Insurance please see “Who Pays For Flood Insurance?“

NOTES
(1) “In economics, crowding out is argued by some economists to be a phenomenon that occurs when increased government involvement in a sector of the market economy substantially affects the remainder of the market, either on the supply or demand side of the market.

One type frequently discussed is when expansionary fiscal policy reduces investment spending by the private sector. The Government is “crowding out” investment because it is demanding more Loanable Funds and it is increasing interest rates from the borrowing, but that was broadened to multiple channels that might leave total output little changed or smaller.” — Olivier Jean Blanchard (2008) “crowding out,” The New Palgrave Dictionary of Economics, 2nd Edition. Abstract and Roger W. Spencer & William P. Yohe, 1970. “The ‘Crowding Out’ of Private Expenditures by Fiscal Policy Actions,” Federal Reserve Bank of St. Louis Review, October, pp. 12-24

(2) “After years of wage stagnation, we are finally seeing rising wages,” Donald Trump (State of the Union 2018)
“The Employment Cost Index, a measure of salary and benefit costs, registered a 2.6 percent gain for the full year, tied for the best since 2007.” — CNBC (January 31, 2018)

(3) “Recently, Trump levied steep tariffs on imported solar panel technology and washing machines, which immediately boosted prices for U.S. consumers.” — The Hill (February 6, 2018)

(4) “Federal Reserve officials followed through on an expected interest-rate increase and raised their forecast for economic growth in 2018, even as they stuck with a projection for three (rate) hikes in the coming year.

“This change highlights that the committee expects the labor market to remain strong, with sustained job creation, ample opportunities for workers and rising wages,” Chair Janet Yellen told reporters Wednesday in Washington following the decision. In her final scheduled press conference, Yellen noted that her nominated successor, Jerome Powell, has been part of the consensus shaping the Fed’s gradual rate-hike strategy.” — “Fed Raises Rates, Eyes Three 2018 Hikes as Yellen Era Nears End” (December 13, 2017)


Part II: Inflation Bites

In March of 2020, the global pandemic put the Fed on hold. Then, the Fed reversed course, did not increase rates, and did substantially more (trillions) quantitative easing (see chart below.) In addition, the federal government borrowed trillions of dollars with no repayment plan. A large portion of this money was given to consumers as stimulus. The consumers shifted the demand curve causing a sharp rise in prices. “A demand curve shift refers to fundamental changes in the balance of supply and demand that alter the quantity demanded at the same price,” says The Balance Economic Theory. Consumers continued to spend beyond their means raising consumer debt. “Household debt in the third quarter of 2022, increasing by $351 billion (2.2%) to $16.51 trillion. Balances now stand $2.36 trillion higher than at the end of 2019, before the pandemic recession,” as reported by the Federal Reserve Bank of New York.

UPDATE: January 30, 2022
Inflation has hit 7% — the highest rate in 40 years.

The Fed has signaled that they are:
1) stopping quantitative easing in March
2) raising interest rates in March

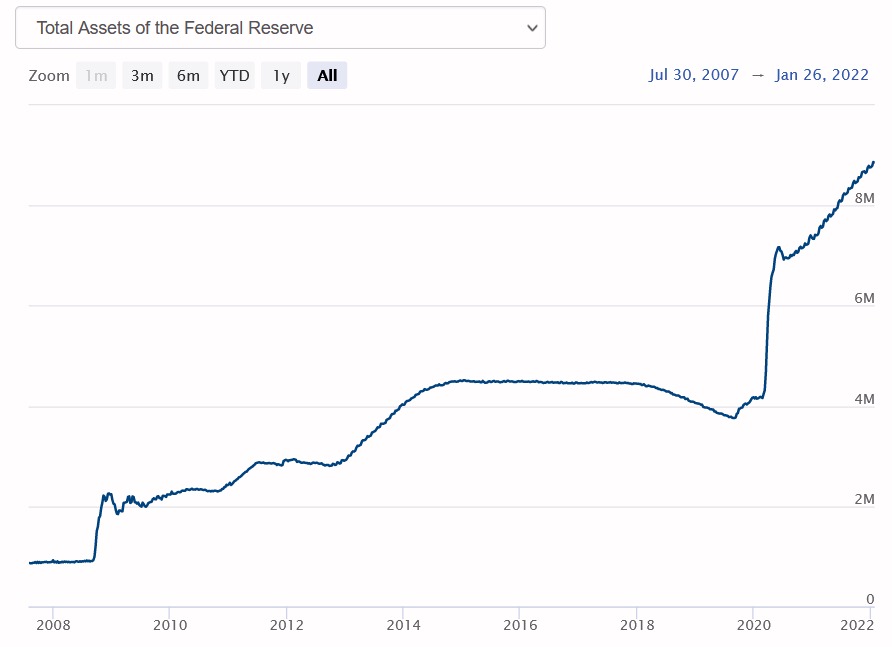
Stopping quantitative easing means the Fed will no longer be supporting low Treasury yields by buying bonds. To date, they have bought over 8 trillion in Treasuries and other instruments that undercut interest rates. When the Fed stops buying Treasuries, the demand will go down and rates will go up.

Federal Reserve Balance Sheet 2022

The market has increased their forecast on the Fed raising rates to 4-5 times in 2022. When the Fed raises rates that banks charge each other, the banks charge you higher interest rates.

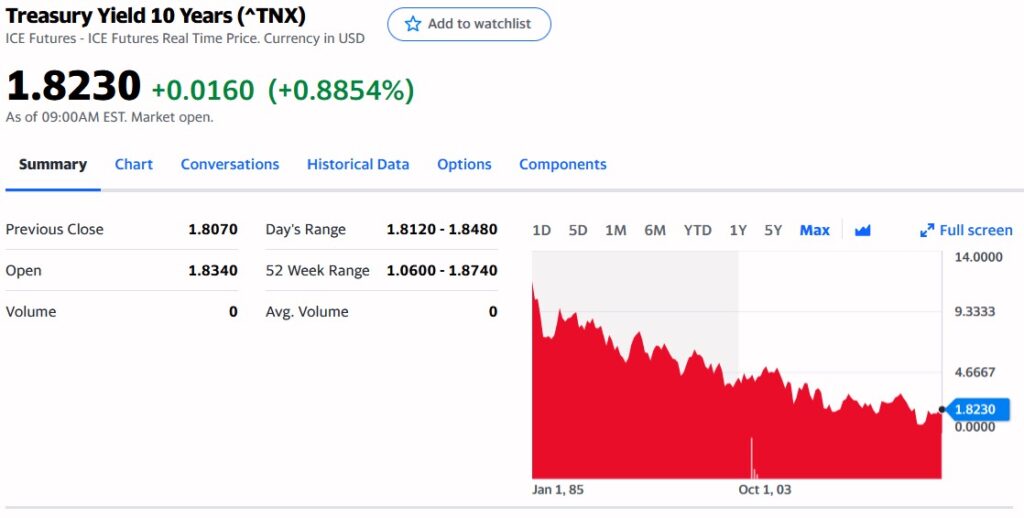
The 10 Year Treasury Note is the best indicator to watch for mortgage interest rates. It will reflect both the ending of quantitative easing and the increase in Fed funds rates. That is to say, if the Fed raises rates 1/4%, mortgage interest rates will likely rise 1/2%. That changes the forecast for mortgage rates in 2022 to rise 2 to 2.5%.

Borrow any long term money today before it is too late. [WARNING: This paper was first published in 2018. Since that time the forecast has reached fruition. It is too late to beat rising interest rates.] After rates rise for the next several years, there will be a recession. So, a long time before you may see conditions like we’ve had for the last 14 years.

10 Year Treasury Notes Interest Rates


Part III: U.S. Mass Consumption Results in Global Economic Disparity, Inequity, and Poverty

In Part I we mention the worst-case inflation scenario is hyper-inflation. We don’t expect hyperinflation in the US in the near future; however, higher interest rates in the US will result in hyperinflation in other parts of the world.

As long as the US Dollar is the world’s reserve currency, it is unlikely that the US will see hyperinflation. The US Congress defines the world’s reserve currency as, “a currency held by central banks in significant quantities. It is widely used to conduct international trade and financial transactions, eliminating the costs of settling transactions involving different currencies.”

When there is inflation in the US, the US Federal Reserve Bank raises interest rates. The rise in US interest rates results in other countries’ investors putting their money in dollar denominated US interest bearing investments. That is to say, foreign investors buy dollars with their home currencies. The result is a widened disparity in the exchange rates between the currencies. The US dollar increases in value and the foreign currency depreciates in value. There is a benefit to the US consumer — imported goods and services are cheaper. The disadvantage to the foreign countries is the dollar disparity causes a much greater rise in their domestic inflation as all their imports experience both the local inflation rate as well the inflation in buying dollars. In an even worse case scenario, the foreign country has debt that has to be repaid in dollars. In essence, their debt is multiplied by a factor equal to the decline in the value of their currency.

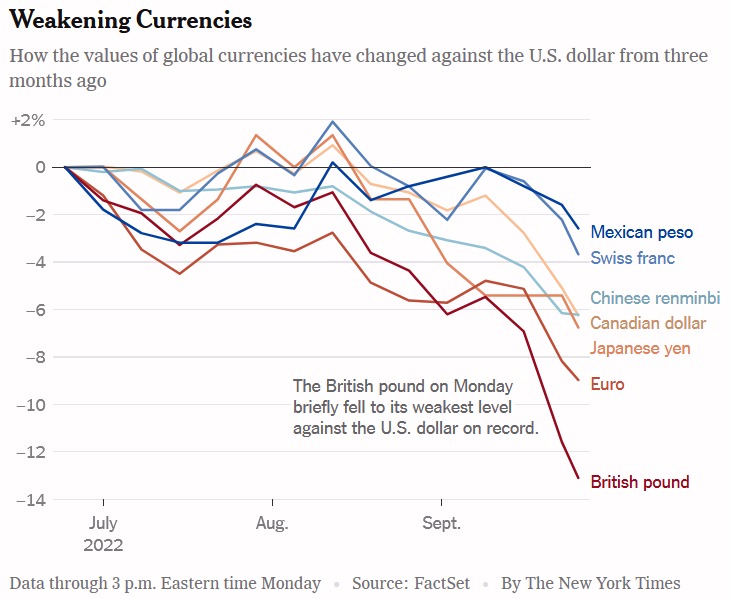
In September of 2022, the New York Times reported, “The Federal Reserve’s determination to crush inflation at home by raising interest rates is inflicting profound pain in other countries — pushing up prices, ballooning the size of debt payments and increasing the risk of a deep recession”

“Those interest rate increases are pumping up the value of the dollar — the go-to currency for much of the world’s trade and transactions — and causing economic turmoil in both rich and poor nations. In Britain and across much of the European continent, the dollar’s acceleration is helping feed stinging inflation.”

Weakening Currencies

Also in September of 2022, the Nikkei Asia reported, “Superstrong dollar threatens debt crisis across emerging economies. Mexico pressured to follow Fed hikes, while Sri Lanka’s repayment costs soar.”

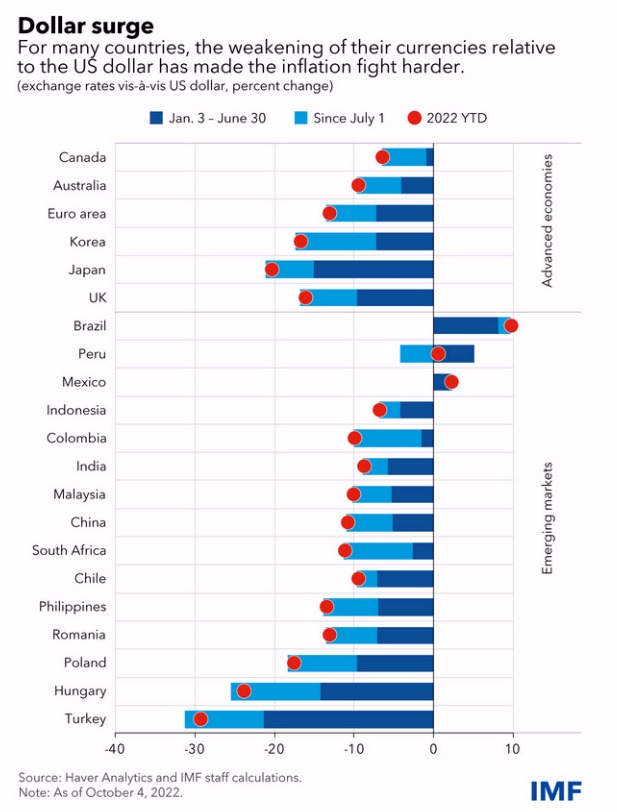
In October of 2022, the IMF reported, “The dollar is at its highest level since 2000, having appreciated 22 percent against the yen, 13 percent against the Euro and 6 percent against emerging market currencies since the start of this year. Such a sharp strengthening of the dollar in a matter of months has sizable macroeconomic implications for almost all countries, given the dominance of the dollar in international trade and finance.”

Dollar Surge
Dollar Surge

Conclusion

The United States has unsustainable mass consumption. US consumers are destroying the world’s environment and economies. The excessive demand of US consumers has resulted in the exploitation of natural resources, the largest emissions of pollution and greenhouse gases, inflation, currency disparity, and the largest redistribution of wealth in the world. Americans’ mass consumption is responsible for creating the greatest income disparity, wealth inequity, and poverty.

Part V: Your National Debt (2023)

ALSO SEE: Immigration and the Wage Inflation Spiral
Anthropologic Climate Change and Pollution

Business, Finance, and Economics

bookmark_borderClimate Science Special Report: Human Induced

The Fourth National Climate Assessment (NCA4), Volume I has determined that climate change is being unduly accelerated by human activities.

The report is an authoritative assessment of the science of climate change, with a focus on the United States. It represents the first of two volumes of the Fourth National Climate Assessment, mandated by the Global Change Research Act of 1990.

The report’s summary states:

Global annually averaged surface air temperature has increased by about 1.8°F (1.0°C) over the last 115 years (1901–2016). This period is now the warmest in the history of modern civilization. The last few years have also seen record-breaking, climate-related weather extremes, and the last three years have been the warmest years on record for the globe. These trends are expected to continue over climate timescales.This assessment concludes, based on extensive evidence, that it is extremely likely that human activities, especially emissions of greenhouse gases, are the dominant cause of the observed warming since the mid-20th century. For the warming over the last century, there is no convincing alternative explanation supported by the extent of the observational evidence.In addition to warming, many other aspects of global climate are changing, primarily in response to human activities. Thousands of studies conducted by researchers around the world have documented changes in surface, atmospheric, and oceanic temperatures; melting glaciers; diminishing snow cover; shrinking sea ice; rising sea levels; ocean acidification; and increasing atmospheric water vapor.

For example, global average sea level has risen by about 7–8 inches since 1900, with almost half (about 3 inches) of that rise occurring since 1993. Human-caused climate change has made a substantial contribution to this rise since 1900, contributing to a rate of rise that is greater than during any preceding century in at least 2,800 years. Global sea level rise has already affected the United States; the incidence of daily tidal flooding is accelerating in more than 25 Atlantic and Gulf Coast cities.

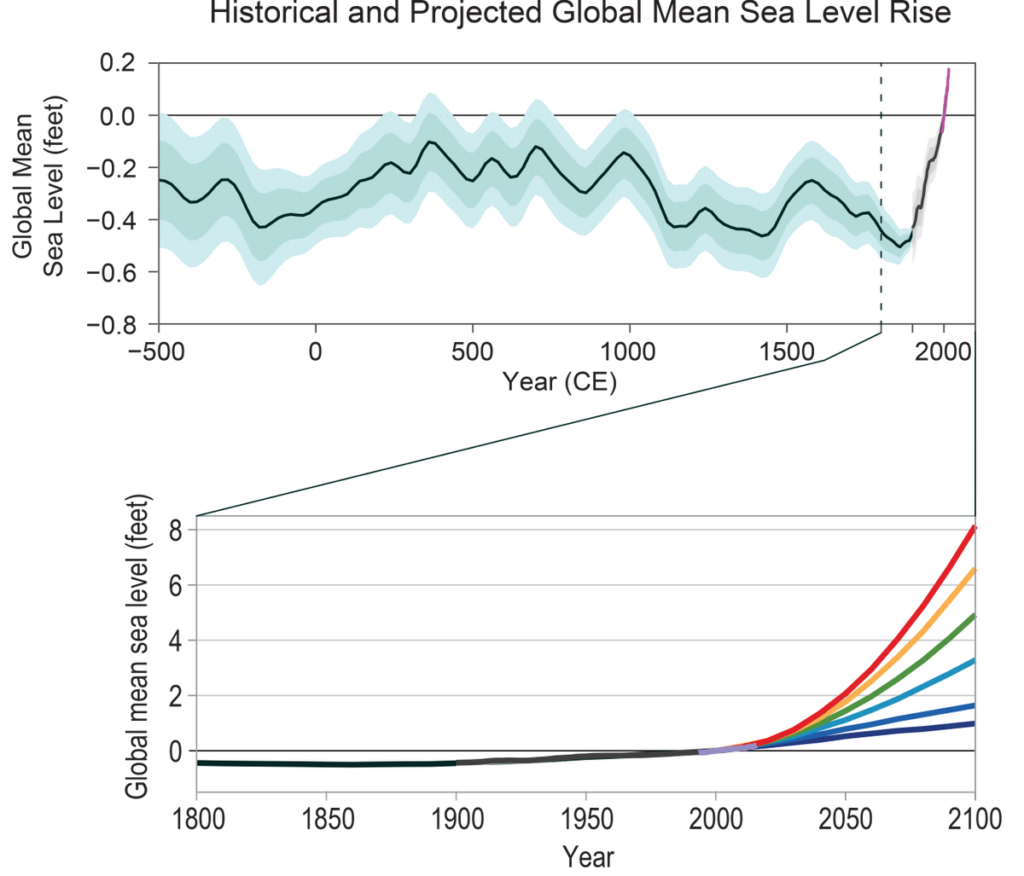
Global average sea levels are expected to continue to rise—by at least several inches in the next 15 years and by 1–4 feet by 2100. A rise of as much as 8 feet by 2100 cannot be ruled out. Sea level rise will be higher than the global average on the East and Gulf Coasts of the United States.

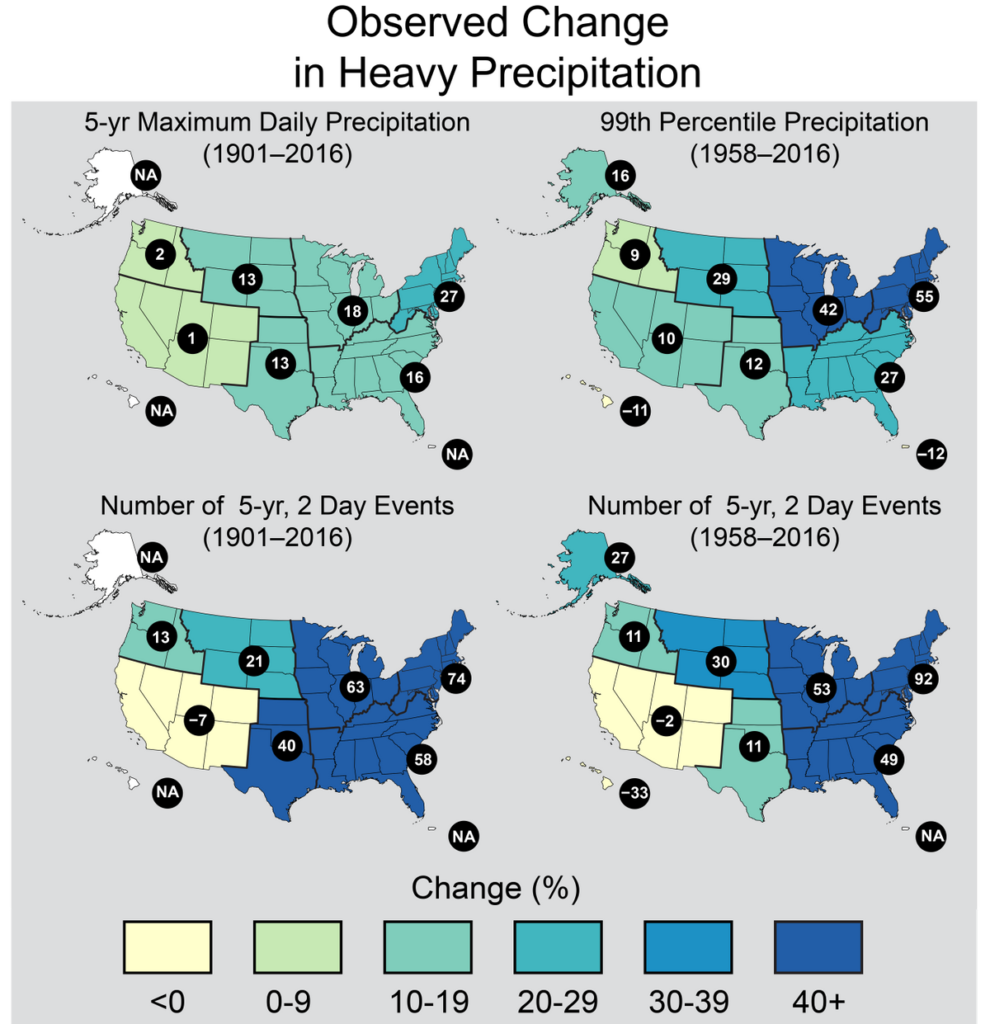
Changes in the characteristics of extreme events are particularly important for human safety, infrastructure, agriculture, water quality and quantity, and natural ecosystems. Heavy rainfall is increasing in intensity and frequency across the United States and globally and is expected to continue to increase. The largest observed changes in the United States have occurred in the Northeast.

Heatwaves have become more frequent in the United States since the 1960s, while extreme cold temperatures and cold waves are less frequent. Recent record-setting hot years are projected to become common in the near future for the United States, as annual average temperatures continue to rise. Annual average temperature over the contiguous United States has increased by 1.8°F (1.0°C) for the period 1901–2016; over the next few decades (2021–2050), annual average temperatures are expected to rise by about 2.5°F for the United States, relative to the recent past (average from 1976–2005), under all plausible future climate scenarios.

The incidence of large forest fires in the western United States and Alaska has increased since the early 1980s and is projected to further increase in those regions as the climate changes, with profound changes to regional ecosystems.

Annual trends toward earlier spring melt and reduced snowpack are already affecting water resources in the western United States and these trends are expected to continue. Under higher scenarios, and assuming no change to current water resources management, chronic, long-duration hydrological drought is increasingly possible before the end of this century.

The magnitude of climate change beyond the next few decades will depend primarily on the amount of greenhouse gases (especially carbon dioxide) emitted globally. Without major reductions in emissions, the increase in annual average global temperature relative to preindustrial times could reach 9°F (5°C) or more by the end of this century. With significant reductions in emissions, the increase in annual average global temperature could be limited to 3.6°F (2°C) or less.

The global atmospheric carbon dioxide (CO2) concentration has now passed 400 parts per million (ppm), a level that last occurred about 3 million years ago, when both global average temperature and sea level were significantly higher than today. Continued growth in CO2 emissions over this century and beyond would lead to an atmospheric concentration not experienced in tens to hundreds of millions of years. There is broad consensus that the further and the faster the Earth system is pushed towards warming, the greater the risk of unanticipated changes and impacts, some of which are potentially large and irreversible.

The observed increase in carbon emissions over the past 15–20 years has been consistent with higher emissions pathways. In 2014 and 2015, emission growth rates slowed as economic growth became less carbon-intensive. Even if this slowing trend continues, however, it is not yet at a rate that would limit global average temperature change to well below 3.6°F (2°C) above preindustrial levels.

Introduction

New observations and new research have increased our understanding of past, current, and future climate change since the Third U.S. National Climate Assessment (NCA3) was published in May 2014. This Climate Science Special Report (CSSR) is designed to capture that new information and build on the existing body of science in order to summarize the current state of knowledge and provide the scientific foundation for the Fourth National Climate Assessment (NCA4).

Since NCA3, stronger evidence has emerged for continuing, rapid, human-caused warming of the global atmosphere and ocean. This report concludes that “it is extremely likely that human influence has been the dominant cause of the observed warming since the mid-20th century. For the warming over the last century, there is no convincing alternative explanation supported by the extent of the observational evidence.”

The last few years have also seen record-breaking, climate-related weather extremes, the three warmest years on record for the globe, and continued decline in arctic sea ice. These trends are expected to continue in the future over climate (multidecadal) timescales. Significant advances have also been made in our understanding of extreme weather events and how they relate to increasing global temperatures and associated climate changes. Since 1980, the cost of extreme events for the United States has exceeded $1.1 trillion; therefore, better understanding of the frequency and severity of these events in the context of a changing climate is warranted.

Periodically taking stock of the current state of knowledge about climate change and putting new weather extremes, changes in sea ice, increases in ocean temperatures, and ocean acidification into context ensures that rigorous, scientifically-based information is available to inform dialogue and decisions at every level. This climate science report serves as the climate science foundation of the NCA4 and is generally intended for those who have a technical background in climate science. In this Executive Summary, green boxes present highlights of the main report. These are followed by related points and selected figures providing more scientific details. The summary material on each topic presents the most salient points of chapter findings and therefore represents only a subset of the report’s content. For more details, the reader is referred to the individual chapters. This report discusses climate trends and findings at several scales: global, nationwide for the United States, and for ten specific U.S. regions (shown in Figure 1 in the Guide to the Report). A statement of scientific confidence also follows each point in the Executive Summary. The confidence scale is described in the Guide to the Report. At the end of the Executive Summary and in Chapter 1: Our Globally Changing Climate, there is also a summary box highlighting the most notable advances and topics since NCA3 and since the 2013 Intergovernmental Panel on Climate Change (IPCC) Fifth Assessment Report.

Global and U.S. Temperatures Continue to Rise

Long-term temperature observations are among the most consistent and widespread evidence of a warming planet. Temperature (and, above all, its local averages and extremes) affects agricultural productivity, energy use, human health, water resources, infrastructure, natural ecosystems, and many other essential aspects of society and the natural environment. Recent data add to the weight of evidence for rapid global-scale warming, the dominance of human causes, and the expected continuation of increasing temperatures, including more record-setting extremes. (Ch. 1)

Changes in Observed and Projected Global Temperature

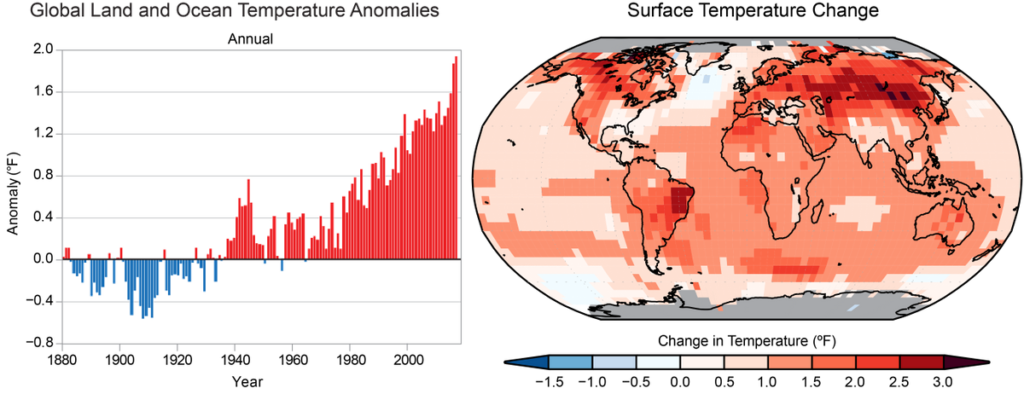
  • Global annual average temperature (as calculated from instrumental records over both land and oceans) has increased by more than 1.2°F (0.65°C) for the period 1986–2016 relative to 1901–1960; the linear regression change over the entire period from 1901–2016 is 1.8°F (1.0°C) (very high confidence; Fig. ES.1). Longer-term climate records over past centuries and millennia indicate that average temperatures in recent decades over much of the world have been much higher, and have risen faster during this time period than at any time in the past 1,700 years or more, the time period for which the global distribution of surface temperatures can be reconstructed (high confidence). (Ch. 1)

Figure 1

(left) Global annual average temperature has increased by more than 1.2°F (0.7°C) for the period 1986–2016 relative to 1901–1960. Red bars show temperatures that were above the 1901–1960 average, and blue bars indicate temperatures below the average. (right) Surface temperature change (in °F) for the period 1986–2016 relative to 1901–1960. Gray indicates missing data. From Figures 1.2. and 1.3 in Chapter 1.

  • Many lines of evidence demonstrate that it is extremely likely that human influence has been the dominant cause of the observed warming since the mid-20th century. Over the last century, there are no convincing alternative explanations supported by the extent of the observational evidence. Solar output changes and internal natural variability can only contribute marginally to the observed changes in climate over the last century, and there is no convincing evidence for natural cycles in the observational record that could explain the observed changes in climate. (Very high confidence) (Ch. 1)

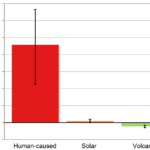
    Figure 2

    The likely range of the human contribution to the global mean temperature increase over the period 1951–2010 is 1.1° to 1.4°F (0.6° to 0.8°C), and the central estimate of the observed warming of 1.2°F (0.65°C) lies within this range (high confidence). This translates to a likely human contribution of 92%–123% of the observed 1951–2010 change. The likely contributions of natural forcing and internal variability to global temperature change over that period are minor (high confidence). (Ch. 3; Fig. ES.2)

  • Natural variability, including El Niño events and other recurring patterns of ocean–atmosphere interactions, impact temperature and precipitation, especially regionally, over timescales of months to years. The global influence of natural variability, however, is limited to a small fraction of observed climate trends over decades. (Very high confidence) (Ch. 1)
  • Global climate is projected to continue to change over this century and beyond. The magnitude of climate change beyond the next few decades will depend primarily on the amount of greenhouse (heat-trapping) gases emitted globally and on the remaining uncertainty in the sensitivity of Earth’s climate to those emissions (very high confidence). With significant reductions in the emissions of greenhouse gases, the global annually averaged temperature rise could be limited to 3.6°F (2°C) or less. Without major reductions in these emissions, the increase in annual average global temperatures relative to pre-industrial times could reach 9°F (5°C) or more by the end of this century. (Ch.1; Fig ES.3)
  • If greenhouse gas concentrations were stabilized at their current level, existing concentrations would commit the world to at least an additional 1.1°F (0.6°C) of warming over this century relative to the last few decades (high confidence in continued warming, medium confidence in amount of warming. (Ch.4)

Figure 3

The two panels above show annual historical and a range of plausible future carbon emissions in units of gigatons of carbon (GtC) per year (left) and the historical observed and future temperature change that would result for a range of future scenarios relative to the 1901–1960 average, based on the central estimate (lines) and a range (shaded areas, two standard deviations) as simulated by the full suite of CMIP5 global climate models (right). By 2081–2100, the projected range in global mean temperature change is 1.1°–4.3°F under the even lower scenario (RCP2.6; 0.6°–2.4°C, green), 2.4°–5.9°F under the lower scenario (RCP4.5; 1.3°–3.3°C, blue), 3.0°–6.8°F under the mid-high scenario (RCP6.0; 1.6°–3.8°C, not shown) and 5.0°–10.2°F under the higher scenario (RCP8.5; 2.8°–5.7°C, orange). See the main report for more details on these scenarios and implications. Based on Figure 4.1 in Chapter 4.

Changes in Observed and Projected U.S. Temperature

  • Annual average temperature over the contiguous United States has increased by 1.2°F (0.7°C) for the period 1986–2016 relative to 1901–1960 and by 1.8°F (1.0°C) based on a linear regression for the period 1901–2016 (very high confidence). Surface and satellite data are consistent in their depiction of rapid warming since 1979 (high confidence). Paleo-temperature evidence shows that recent decades are the warmest of the past 1,500 years (medium confidence). (Ch. 6)
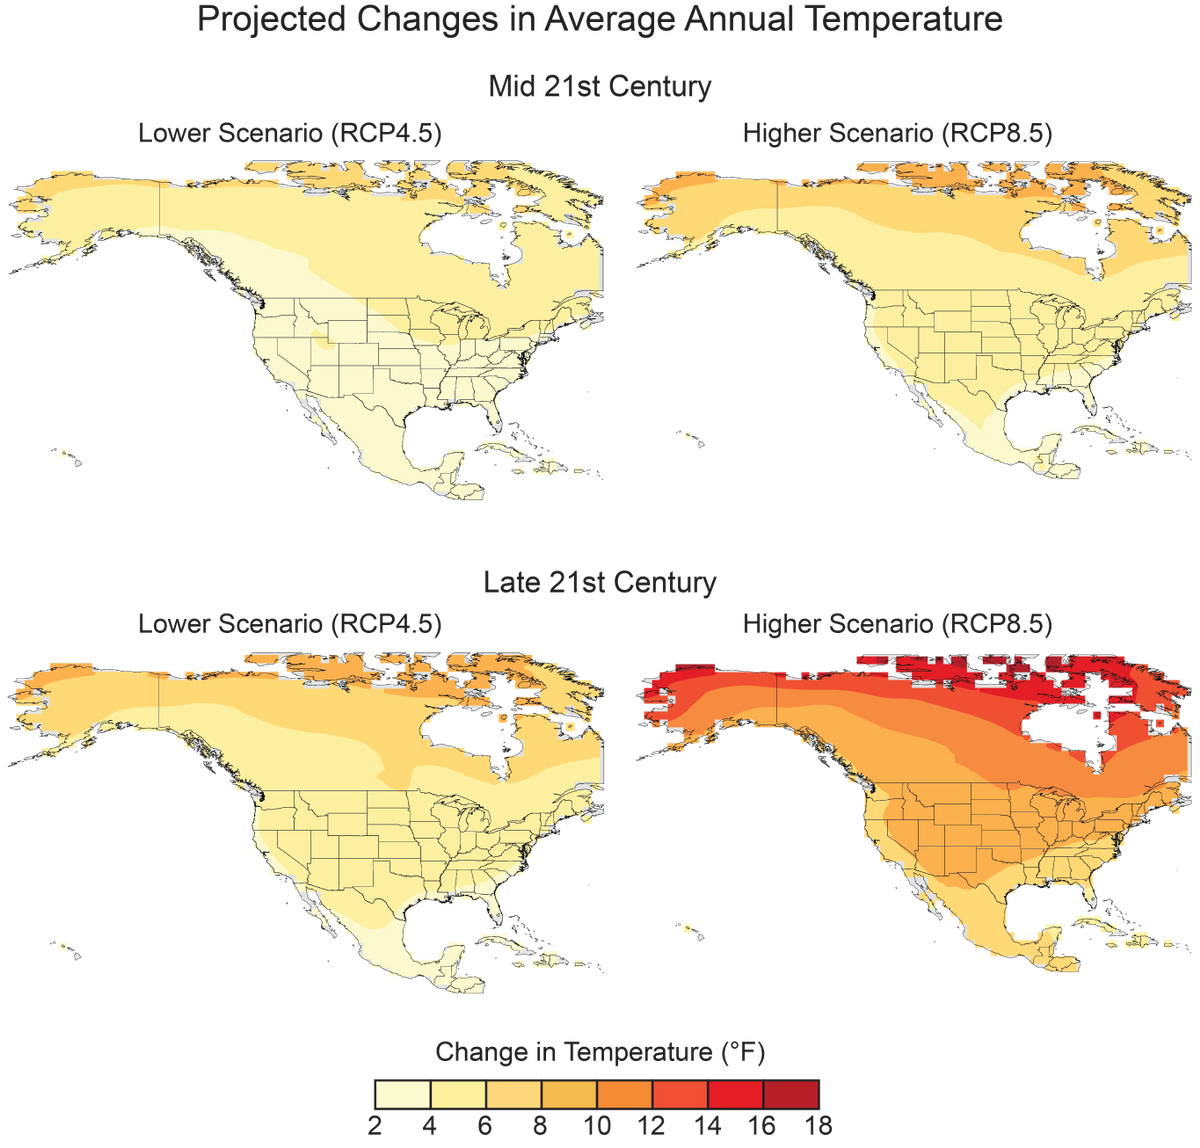
  • Annual average temperature over the contiguous United States is projected to rise (very high confidence). Increases of about 2.5°F (1.4°C) are projected for the period 2021–2050 relative to the average from 1976–2005 in all RCP scenarios, implying recent record-setting years may be “common” in the next few decades (high confidence). Much larger rises are projected by late century (2071–2100): 2.8°–7.3°F (1.6°–4.1°C) in a lower scenario (RCP4.5) and 5.8°–11.9°F (3.2°–6.6°C) in a higher scenario (RCP8.5) (high confidence). (Ch. 6; Fig. ES.4)
  • In the United States, the urban heat island effect results in daytime temperatures 0.9°–7.2°F (0.5°–4.0°C) higher and nighttime temperatures 1.8°– 4.5°F (1.0°–2.5°C) higher in urban areas than in rural areas, with larger temperature differences in humid regions (primarily in the eastern United States) and in cities with larger and denser populations. The urban heat island effect will strengthen in the future as the structure and spatial extent as well as population density of urban areas change and grow (high confidence). (Ch. 10)

Figure 4

These maps show the projected changes in annual average temperatures for mid- and late-21st century for two future pathways. Changes are the differences between the average projected temperatures for mid-century (2036–2065; top), and late-century (2070-2099; bottom), and those observed for the near-present (1976–2005). See Figure 6.7 in Chapter 6 for more details.

Many Temperature and Precipitation Extremes Are Becoming More Common

Temperature and precipitation extremes can affect water quality and availability, agricultural productivity, human health, vital infrastructure, iconic ecosystems and species, and the likelihood of disasters. Some extremes have already become more frequent, intense, or of longer duration, and many extremes are expected to continue to increase or worsen, presenting substantial challenges for built, agricultural, and natural systems. Some storm types such as hurricanes, tornadoes, and winter storms are also exhibiting changes that have been linked to climate change, although the current state of the science does not yet permit detailed understanding.

Observed Changes in Extremes

Figure 5

The frequency of cold waves has decreased since the early 1900s, and the frequency of heat waves has increased since the mid-1960s (the Dust Bowl era of the 1930s remains the peak period for extreme heat in the United States). (Very high confidence). (Ch. 6)

  • The frequency and intensity of extreme heat and heavy precipitation events are increasing in most continental regions of the world (very high confidence). These trends are consistent with expected physical responses to a warming climate. Climate model studies are also consistent with these trends, although models tend to underestimate the observed trends, especially for the increase in extreme precipitation events (very high confidence for temperature, high confidence for extreme precipitation). (Ch. 1)

Figure 6


These maps show the percentage change in several metrics of extreme precipitation by NCA4 region, including (upper left) the maximum daily precipitation in consecutive 5-year periods; (upper right) the amount of precipitation falling in daily events that exceed the 99th percentile of all non-zero precipitation days (top 1% of all daily precipitation events); (lower left) the number of 2-day events with a precipitation total exceeding the largest 2-day amount that is expected to occur, on average, only once every 5 years, as calculated over 1901–2016; and (lower right) the number of 2-day events with a precipitation total exceeding the largest 2-day amount that is expected to occur, on average, only once every 5 years, as calculated over 1958–2016. The number in each black circle is the percent change over the entire period, either 1901–2016 or 1958–2016. Note that Alaska and Hawai‘i are not included in the 1901–2016 maps owing to a lack of observations in the earlier part of the 20th century. (Figure source: CICS-NC / NOAA NCEI). Based on Figure 7.4 in Chapter 7.

  • Recent droughts and associated heat waves have reached record intensity in some regions of the United States; however, by geographical scale and duration, the Dust Bowl era of the 1930s remains the benchmark drought and extreme heat event in the historical record. (Very high confidence) (Ch. 8)
  • Northern Hemisphere spring snow cover extent, North America maximum snow depth, snow water equivalent in the western United States, and extreme snowfall years in the southern and western United States have all declined, while extreme snowfall years in parts of the northern United States have increased. (Medium confidence). (Ch. 7)
  • There has been a trend toward earlier snowmelt and a decrease in snowstorm frequency on the southern margins of climatologically snowy areas (medium confidence). Winter storm tracks have shifted northward since 1950 over the Northern Hemisphere (medium confidence). Potential linkages between the frequency and intensity of severe winter storms in the United States and accelerated warming in the Arctic have been postulated, but they are complex, and, to some extent, contested, and confidence in the connection is currently low. (Ch. 9)
  • Tornado activity in the United States has become more variable, particularly over the 2000s, with a decrease in the number of days per year with tornadoes and an increase in the number of tornadoes on these days (medium confidence). Confidence in past trends for hail and severe thunderstorm winds, however, is low (Ch. 9)

Projected Changes in Extremes

  • The frequency and intensity of extreme high temperature events are virtually certain to increase in the future as global temperature increases (high confidence). Extreme precipitation events will very likely continue to increase in frequency and intensity throughout most of the world (high confidence). Observed and projected trends for some other types of extreme events, such as floods, droughts, and severe storms, have more variable regional characteristics. (Ch. 1)
  • Both extremely cold days and extremely warm days are expected to become warmer. Cold waves are predicted to become less intense while heat waves will become more intense. The number of days below freezing is projected to decline while the number above 90°F will rise. (Very high confidence) (Ch. 6)
  • The frequency and intensity of heavy precipitation events in the United States are projected to continue to increase over the 21st century (high confidence). There are, however, important regional and seasonal differences in projected changes in total precipitation: the northern United States, including Alaska, is projected to receive more precipitation in the winter and spring, and parts of the southwestern United States are projected to receive less precipitation in the winter and spring (medium confidence). (Ch. 7)
  • The frequency and severity of landfalling “atmospheric rivers” on the U.S. West Coast (narrow streams of moisture that account for 30%–40% of the typical snowpack and annual precipitation in the region and are associated with severe flooding events) will increase as a result of increasing evaporation and resulting higher atmospheric water vapor that occurs with increasing temperature. (Medium confidence) (Ch. 9)
  • Projections indicate large declines in snowpack in the western United States and shifts to more precipitation falling as rain than snow in the cold season in many parts of the central and eastern United States (high confidence). (Ch. 7)
  • Substantial reductions in western U.S. winter and spring snowpack are projected as the climate warms. Earlier spring melt and reduced snow water equivalent have been formally attributed to human-induced warming (high confidence) and will very likely be exacerbated as the climate continues to warm (very high confidence). Under higher scenarios, and assuming no change to current water resources management, chronic, long-duration hydrological drought is increasingly possible by the end of this century (very high confidence). (Ch. 8)
  • The human effect on recent major U.S. droughts is complicated. Little evidence is found for a human influence on observed precipitation deficits, but much evidence is found for a human influence on surface soil moisture deficits due to increased evapotranspiration caused by higher temperatures. (High confidence) (Ch. 8)
  • The incidence of large forest fires in the western United States and Alaska has increased since the early 1980s (high confidence) and is projected to further increase in those regions as the climate warms, with profound changes to certain ecosystems (medium confidence). (Ch. 8)
  • Both physics and numerical modeling simulations generally indicate an increase in tropical cyclone intensity in a warmer world, and the models generally show an increase in the number of very intense tropical cyclones. For Atlantic and eastern North Pacific hurricanes and western North Pacific typhoons, increases are projected in precipitation rates (high confidence) and intensity (medium confidence). The frequency of the most intense of these storms is projected to increase in the Atlantic and western North Pacific (low confidence) and in the eastern North Pacific (medium confidence). (Ch. 9)

Oceans Are Rising, Warming, and Becoming More Acidic

Oceans occupy two-thirds of the planet’s surface and host unique ecosystems and species, including those important for global commercial and subsistence fishing. Understanding climate impacts on the ocean and the ocean’s feedbacks to the climate system is critical for a comprehensive understanding of current and future changes in climate.

Global Ocean Heat

  • Ocean heat content has increased at all depths since the 1960s and surface waters have warmed by about 1.3° ± 0.1°F (0.7° ± 0.08°C) per century globally since 1900 to 2016. Under higher scenarios, a global increase in average sea surface temperature of 4.9° ± 1.3°F (2.7° ± 0.7°C) is projected by 2100. (Very high confidence). (Ch. 13)

Global and Regional Sea Level Rise

  • Human-caused climate change has made a substantial contribution to GMSL rise since 1900 (high confidence), contributing to a rate of rise that is greater than during any preceding century in at least 2,800 years (medium confidence). (Ch. 12; Fig. ES.8)
  • Relative to the year 2000, GMSL is very likely to rise by 0.3–0.6 feet (9–18 cm) by 2030, 0.5–1.2 feet (15–38 cm) by 2050, and 1.0–4.3 feet (30–130 cm) by 2100 (very high confidence in lower bounds; medium confidence in upper bounds for 2030 and 2050; low confidence in upper bounds for 2100). Future emissions pathways have little effect on projected GMSL rise in the first half of the century, but significantly affect projections for the second half of the century (high confidence). (Ch. 12)

Figure 8

The top panel shows observed and reconstructed mean sea level for the last 2,500 years. The bottom panel shows projected mean sea level for six future scenarios. The six scenarios—spanning a range designed to inform a variety of decision makers—extend from a low scenario, consistent with continuation of the rate of sea level rise over the last quarter century, to an extreme scenario, assuming rapid mass loss from the Antarctic ice sheet. Note that the range on the vertical axis in the bottom graph is approximately ten times greater than in the top graph. Based on Figure 12.2 and 12.4 in Chapter 12. See the main report for more details.

  • Emerging science regarding Antarctic ice sheet stability suggests that, for higher scenarios, a GMSL rise exceeding 8 feet (2.4 m) by 2100 is physically possible, although the probability of such an extreme outcome cannot currently be assessed. Regardless of emission pathway, it is extremely likely that GMSL rise will continue beyond 2100 (high confidence). (Ch. 12)
  • Relative sea level rise in this century will vary along U.S. coastlines due, in part, to changes in Earth’s gravitational field and rotation from melting of land ice, changes in ocean circulation, and vertical land motion (very high confidence). For almost all future GMSL rise scenarios, relative sea level rise is likely to be greater than the global average in the U.S. Northeast and the western Gulf of Mexico. In intermediate and low GMSL rise scenarios, relative sea level rise is likely to be less than the global average in much of the Pacific Northwest and Alaska. For high GMSL rise scenarios, relative sea level rise is likely to be higher than the global average along all U.S. coastlines outside Alaska. Almost all U.S. coastlines experience more than global mean sea level rise in response to Antarctic ice loss, and thus would be particularly affected under extreme GMSL rise scenarios involving substantial Antarctic mass loss (high confidence). (Ch. 12)

Coastal Flooding

Figure 9

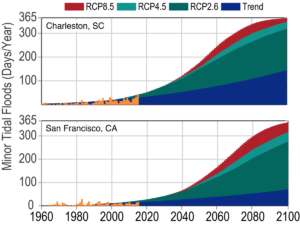
As sea levels have risen, the number of tidal floods each year that cause minor impacts (also called “nuisance floods”) have increased 5- to 10-fold since the 1960s in several U.S. coastal cities (very high confidence). Rates of increase are accelerating in over 25 Atlantic and Gulf Coast cities (very high confidence). Tidal flooding will continue increasing in depth, frequency, and extent this century (very high confidence). (Ch. 12)

  • Assuming storm characteristics do not change, sea level rise will increase the frequency and extent of extreme flooding associated with coastal storms, such as hurricanes and nor’easters (very high confidence). A projected increase in the intensity of hurricanes in the North Atlantic (medium confidence) could increase the probability of extreme flooding along most of the U.S. Atlantic and Gulf Coast states beyond what would be projected based solely on relative sea level rise. However, there is low confidence in the projected increase in frequency of intense Atlantic hurricanes, and the associated flood risk amplification, and flood effects could be offset or amplified by such factors, such as changes in overall storm frequency or tracks. (Ch.12; Fig. ES. 9)

Global Ocean Circulation

  • The potential slowing of the Atlantic meridional overturning circulation (AMOC; of which the Gulf Stream is one component)—as a result of increasing ocean heat content and freshwater-driven buoyancy changes—could have dramatic climate feedbacks as the ocean absorbs less heat and CO2 from the atmosphere. This slowing would also affect the climates of North America and Europe. Any slowing documented to date cannot be directly tied to human-caused forcing, primarily due to lack of adequate observational data and to challenges in modeling ocean circulation changes. Under a higher scenario (RCP8.5), models show that the AMOC weakens over the 21st century (low confidence). (Ch. 13)

Global and Regional Ocean Acidification

  • Higher-latitude systems typically have a lower buffering capacity against changing acidity, exhibiting seasonally corrosive conditions sooner than low-latitude systems. The rate of acidification is unparalleled in at least the past 66 million years (medium confidence). Under the higher scenario (RCP8.5), the global average surface ocean acidity is projected to increase by 100% to 150% (high confidence). (Ch. 13)
  • Acidification is regionally greater than the global average along U.S. coastal systems as a result of upwelling (e.g., in the Pacific Northwest) (high confidence), changes in freshwater inputs (e.g., in the Gulf of Maine) (medium confidence), and nutrient input (e.g., in urbanized estuaries) (high confidence). (Ch. 13)

Ocean Oxygen

  • Increasing sea surface temperatures, rising sea levels, and changing patterns of precipitation, winds, nutrients, and ocean circulation are contributing to overall declining oxygen concentrations at intermediate depths in various ocean locations and in many coastal areas. Over the last half century, major oxygen losses have occurred in inland seas, estuaries, and in the coastal and open ocean (high confidence). Ocean oxygen levels are projected to decrease by as much as 3.5% under the higher scenario (RCP8.5) by 2100 relative to preindustrial values (high confidence). (Ch. 13)

Climate Change in Alaska and across the Arctic Continues to Outpace Global Climate Change

Residents of Alaska are on the front lines of climate change. Crumbling buildings, roads, and bridges and eroding shorelines are commonplace. Accelerated melting of multiyear sea ice cover, mass loss from the Greenland Ice Sheet, reduced snow cover, and permafrost thawing are stark examples of the rapid changes occurring in the Arctic. Furthermore, because elements of the climate system are interconnected (see Box ES.1), changes in the Arctic influence climate conditions outside the Arctic.

Arctic Temperature Increases

  • Rising Alaskan permafrost temperatures are causing permafrost to thaw and become more discontinuous; this process releases additional carbon dioxide and methane resulting in additional warming (high confidence). The overall magnitude of the permafrost-carbon feedback is uncertain (Ch. 2); however, it is clear that these emissions have the potential to compromise the ability to limit global temperature increases. (Ch. 11)
  • Atmospheric circulation patterns connect the climates of the Arctic and the contiguous United States. Evidenced by recent record warm temperatures in the Arctic and emerging science, the midlatitude circulation has influenced observed arctic temperatures and sea ice (high confidence). However, confidence is low regarding whether or by what mechanisms observed arctic warming may have influenced the midlatitude circulation and weather patterns over the continental United States. The influence of arctic changes on U.S. weather over the coming decades remains an open question with the potential for significant impact. (Ch. 11)

Arctic Land Ice Loss

  • Arctic land ice loss observed in the last three decades continues, in some cases accelerating (very high confidence). It is virtually certain that Alaska glaciers have lost mass over the last 50 years, with each year since 1984 showing an annual average ice mass less than the previous year. Over the satellite record, average ice mass loss from Greenland was −269 Gt per year between April 2002 and April 2016, accelerating in recent years (high confidence). (Ch. 11)

Arctic Sea Ice Loss

  • Arctic sea ice loss is expected to continue through the 21st century, very likely resulting in nearly sea ice-free late summers by the 2040s (very high confidence). (Ch. 11)
  • It is very likely that human activities have contributed to observed arctic surface temperature warming, sea ice loss, glacier mass loss, and northern hemisphere snow extent decline (high confidence). (Ch. 11)

Figure 10

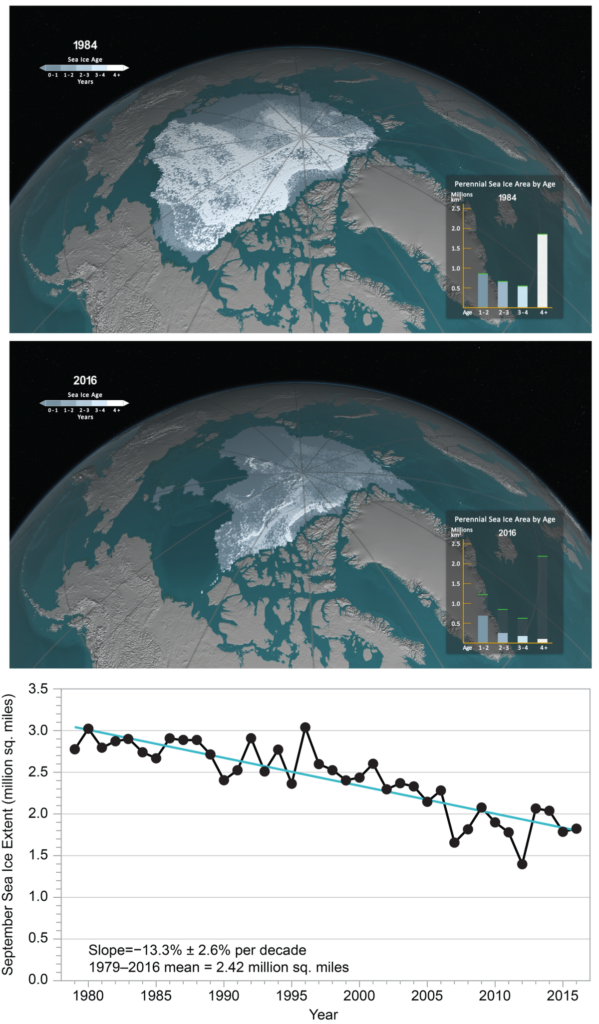
September sea ice extent and age shown for (top) 1984 and (middle) 2016, illustrating significant reductions in sea ice extent and age (thickness). The bar graph in the lower right of each panel illustrates the sea ice area (unit: million km2) covered within each age category (> 1 year), and the green bars represent the maximum extent for each age range during the record. The year 1984 is representative of September sea ice characteristics during the 1980s. The years 1984 and 2016 are selected as endpoints in the time series; a movie of the complete time series is available at http://svs.gsfc.nasa.gov/cgi-bin/details.cgi?aid=4489. (bottom) The satellite-era arctic sea ice areal extent trend from 1979 to 2016 for September (unit: million mi2). From Figure 11.1 in Chapter 11.

Limiting Globally Averaged Warming to 2°C (3.6°F) Will Require Major Reductions in Emissions

Human activities are now the dominant cause of the observed trends in climate. For that reason, future climate projections are based on scenarios of how human activities will continue to affect the climate over the remainder of this century and beyond (see Sidebar: Scenarios Used in this Assessment). There remains significant uncertainty about future emissions due to changing economic, political, and demographic factors. For that reason, this report quantifies possible climate changes for a broad set of plausible future scenarios through the end of the century. (Ch. 2, 4, 10, 14)

  • Global mean atmospheric carbon dioxide (CO2) concentration has now passed 400 ppm, a level that last occurred about 3 million years ago, when global average temperature and sea level were significantly higher than today (high confidence). Continued growth in CO2 emissions over this century and beyond would lead to an atmospheric concentration not experienced in tens of millions of years (medium confidence). The present-day emissions rate of nearly 10 GtC per year suggests that there is no climate analog for this century any time in at least the last 50 million years (medium confidence). (Ch. 4)
  • Warming and associated climate effects from CO2 emissions persist for decades to millennia. In the near-term, changes in climate are determined by past and present greenhouse gas emissions modified by natural variability. Reducing net emissions of CO2 is necessary to limit near-term climate change and long-term warming. Other greenhouse gases (e.g., methane) and black carbon aerosols exert stronger warming effects than CO2 on a per ton basis, but they do not persist as long in the atmosphere (Ch. 2); therefore, mitigation of non-CO2 species contributes substantially to near-term cooling benefits but cannot be relied upon for ultimate stabilization goals. (Very high confidence) (Ch. 14)
  • Stabilizing global mean temperature to less than 3.6°F (2°C) above preindustrial levels requires substantial reductions in net global CO2 emissions prior to 2040 relative to present-day values before 2040 and likely requires net emissions to become zero or possibly negative later in the century. After accounting for the temperature effects of non-CO2 species, cumulative global CO2 emissions must stay below about 800 GtC in order to provide a two-thirds likelihood of preventing 3.6°F (2°C) of warming. Given estimated cumulative emissions since 1870, no more than approximately 230 GtC may be emitted in the future in order to remain under this temperature limit. Assuming global emissions are equal to or greater than those consistent with the RCP4.5 scenario, this cumulative carbon threshold would be exceeded in approximately two decades. (Ch. 14)
  • Achieving global greenhouse gas emissions reductions before 2030 consistent with targets and actions announced by governments in the lead up to the 2015 Paris climate conference would hold open the possibility of meeting the long-term temperature goal of limiting global warming to 3.6°F (2°C) above preindustrial levels, whereas there would be virtually no chance if net global emissions followed a pathway well above those implied by country announcements. Actions in the announcements are, by themselves, insufficient to meet a 3.6°F (2°C) goal; the likelihood of achieving that depends strongly on the magnitude of global emissions reductions after 2030. (High confidence) (Ch. 14)
  • Climate intervention or geoengineering strategies such as solar radiation management are measures that attempt to limit or reduce global temperature increases. Further assessments of the technical feasibilities, costs, risks, co-benefits, and governance challenges of climate intervention or geoengineering strategies, which are as yet unproven at scale, are a necessary step before judgments about the benefits and risks of these approaches can be made with high confidence. (High confidence) (Ch. 14)
  • In recent decades, land-use and land-cover changes have turned the terrestrial biosphere (soil and plants) into a net “sink” for carbon (drawing down carbon from the atmosphere), and this sink has steadily increased since 1980 (high confidence). Because of the uncertainty in the trajectory of land cover, the possibility of the land becoming a net carbon source cannot be excluded (very high confidence). (Ch. 10)

There is a Significant Possibility for Unanticipated Changes

Humanity’s effect on the Earth system, through the large-scale combustion of fossil fuels and widespread deforestation and the resulting release of carbon dioxide (CO2) into the atmosphere, as well as through emissions of other greenhouse gases and radiatively active substances from human activities, is unprecedented. There is significant potential for humanity’s effect on the planet to result in unanticipated surprises and a broad consensus that the further and faster the Earth system is pushed towards warming, the greater the risk of such surprises.

There are at least two types of potential surprises: compound events, where multiple extreme climate events occur simultaneously or sequentially (creating greater overall impact), and critical threshold or tipping point events, where some threshold is crossed in the climate system (that leads to large impacts). The probability of such surprises—some of which may be abrupt and/or irreversible—as well as other more predictable but difficult-to-manage impacts, increases as the influence of human activities on the climate system increases. (Ch. 15)

  • Positive feedbacks (self-reinforcing cycles) within the climate system have the potential to accelerate human-induced climate change and even shift the Earth’s climate system, in part or in whole, into new states that are very different from those experienced in the recent past (for example, ones with greatly diminished ice sheets or different large-scale patterns of atmosphere or ocean circulation). Some feedbacks and potential state shifts can be modeled and quantified; others can be modeled or identified but not quantified; and some are probably still unknown. (Very high confidence in the potential for state shifts and in the incompleteness of knowledge about feedbacks and potential state shifts). (Ch. 15)
  • The physical and socioeconomic impacts of compound extreme events (such as simultaneous heat and drought, wildfires associated with hot and dry conditions, or flooding associated with high precipitation on top of snow or waterlogged ground) can be greater than the sum of the parts (very high confidence). Few analyses consider the spatial or temporal correlation between extreme events. (Ch. 15)
  • While climate models incorporate important climate processes that can be well quantified, they do not include all of the processes that can contribute to feedbacks (Ch. 2), compound extreme events, and abrupt and/or irreversible changes. For this reason, future changes outside the range projected by climate models cannot be ruled out (very high confidence). Moreover, the systematic tendency of climate models to underestimate temperature change during warm paleoclimates suggests that climate models are more likely to underestimate than to overestimate the amount of long-term future change (medium confidence). (Ch. 15)