bookmark_borderCanada Floods

Three people have died and 100,000 have been forced to evacuate due to flooding in Calgary, Alberta, Canada. The water level reached as high as the 10th level of the hockey stadium.

“This is incredible. I’ve seen a little bit of flooding in Calgary before. I don’t think any of us have seen anything like this before. The magnitude is just extraordinary,” a local resident said.

“We’re all very concerned that if gets much more than this it could have real impact on infrastructure and other services longer term, so we’re hoping things will subside a bit.”

The mayor said, “We’ve sat at the same level for many, many hours now. There is one scenario that would it go even higher than this, so you’ll either see the Bow river continue at this level for many hours or you will see it grow even higher, and we’re prepared for that eventuality.”

bookmark_borderDeath Toll in Indian Monsoon Flooding

The severe weather event in India has a rising death toll. Currently at 500, it is expected to rise to over 1,000. More than 60,000 people have been stranded.

” Uttrakhand state Chief Minister Vijay Bahguna said 556 bodies have been noticed buried deep in slush and the army was trying to recover them. He spoke to CNN-IBN television channel on Friday.

Rescuers also Friday found 40 bodies floating in the Ganges near Haridwar, a Hindu holy city, said police officer Rajiv Swaroop.

Bahguna said the eventual toll would be in the hundreds. Rakesh Sharma, another state official, had said Thursday the death toll might reach the thousands but the exact figure would not be known until the entire region is checked.

Home Minister Sushilkumar Shinde told reporters in New Delhi that 34,000 people have been evacuated so far and another 50,000 were stranded in the region. Roads and bridges were washed away by the floods or blocked by debris.”

More information on the effects of global warming and climate change.

bookmark_borderColorado Wildfires

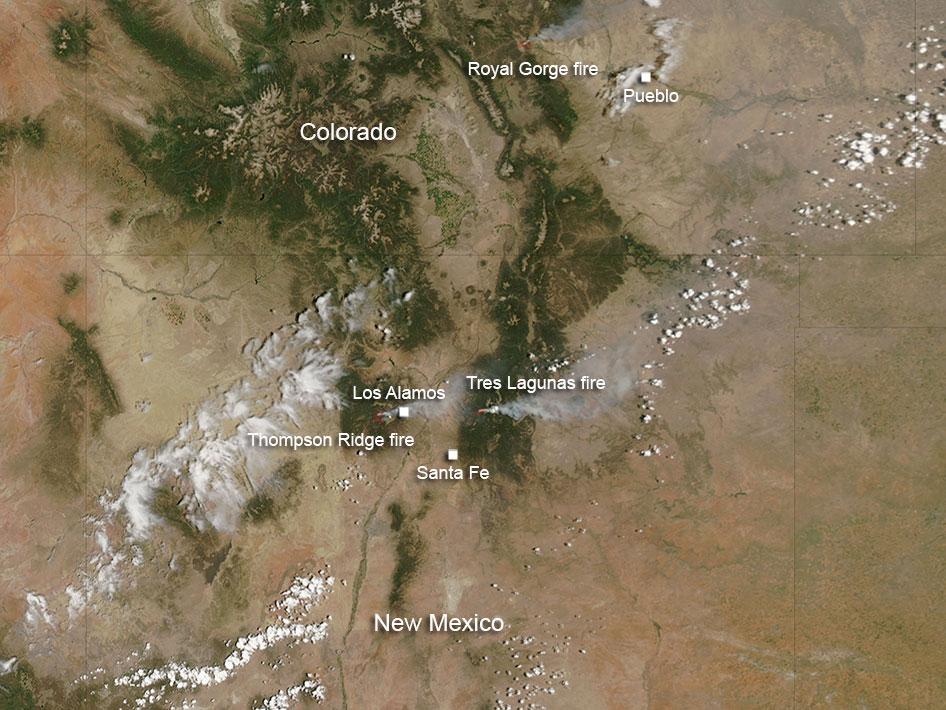
Over 500 homes have been destroyed in the Colorado wildfires. According to NASA: The Royal Gorge fire in Colorado was first reported at 1 p.m. Tuesday June 11, south of the Royal Gorge Bridge and Arkansas River. It is estimated at 3800 acres. At present the Arkansas River has been closed from Spike Buck through Canon City. The Royal Gorge Bridge and Park has been evacuated.

Resources on scene include: 150 firefighters and Law Enforcement officers from both federal and local departments. Resources ordered include: 2-Single Engine Airtanker and 1 Heavy Air Tanker.

The cause of the fire is under investigation.

The New Mexico fires include Thompson Ridge and Tres Lagunas fires. There is another fire in New Mexico south of the area where these fires are located, and that fire is known as the Silver fire. It is not visible in this image, although in the larger image that is included, it is visible.

The Thompson Ridge fire started on May 31, 2013. The cause was human in nature. It is located on the Valles Caldera National Preserve about two miles northeast of La Cueva, New Mexico. The fire is in steep rugged terrain and is burning mixed conifer and ponderosa pine. It has currently burned over 21,000 acres and is 50% contained. However, the growth potential for this fire is high due to rugged terrain, low humidity and dry conditions. Total personnel working this fire is 991.

The Tres Lagunas fire which started on May 30, 2013 was caused by human error and a downed power line. Currently it has burned over 10,000 acres. This fire is 10 miles north of Pecos, New Mexico.

There is a red flag warning for the area today which heralds hot, dry conditions with temperatures remaining well above normal. Stronger and gustier west/southwest winds are expected today with low humidity. All these conditions can contribute to fire growth. At this time the fire is 77% contained.

At present 14 Hand Crews, 5 Helicopters, 17 engines, 2 bulldozers, and 4 water tenders are fighting this fire.

This natural-color satellite image was collected by the Moderate Resolution Imaging Spectroradiometer (MODIS) on June 11, 2013. Actively burning areas, detected by MODIS’s thermal bands, are outlined in red.

NASA image courtesy Jeff Schmaltz, MODIS Rapid Response Team. Caption: NASA/Goddard, Lynn Jenner
colorado-wildfires-2013

bookmark_borderSevere Weather Events: Tornadoes

Because a tornado is part of a severe convective storm, and these storms occur all over the Earth, tornadoes are not limited to any specific geographic location. In fact, tornadoes have been documented in every state of the United States, and on every continent, with the exception of Antarctica (even there, a tornado occurrence is not impossible). In fact, wherever the atmospheric conditions are exactly right, the occurrence of a tornadic storm is possible. More on the conditions necessary for tornado formation can be found at the NOAA National Severe Storms Laboratory Tornado Page.

U.S. Statewide Average Tornado Map


Between April 25 and April 28, 2011, a record-breaking total of 362 tornadoes tore through the southeastern and central United States. Could climate change fuel such an unprecedented cluster of twisters? A number of commentators have addressed the question, but the most concise answer I’ve heard yet comes in the 36th minute of an On Point interview with NOAA tornado expert Harold Brooks.

On Point: When you look at the architecture of the weather that produced these storms can you tie it to global climate change? We’ve seen warning after warning saying that we may see an increase in storm conditions because of climate change.

Brooks: Well, the planet has undoubtedly warmed in the last 50 to 100 years. And it will undoubtedly continue to warm as greenhouse gases play a greater role. It’s not really clear what the connection is between tornadoes [and climate change] in particular. Some of the ingredients we look for in the production of supercells, such as the warm moist air at low levels, are going to increase in intensity and frequency and be supportive of supercell storms. On the other hand, one of the main predictions of climate change is that the equator to pole temperature difference will decrease because the poles will warm more than the equator. That’s related to the change of the winds with height term, which is one of the things that helps organize storms and make them more likely to produce tornadoes. That’s predicted to lessen as we go along. So we’ve got some ingredients that will be increasing in intensity and some that will be decreasing. If we look historically at the record and try to make some adjustments over the last 50 years for what we know is changes in reporting, we really see no correlation between occurrence and intensity and global surface temperatures or even the US national temperature.

bookmark_borderOklahoma Tornado

One of the most severe tornadoes in recorded history wiped out part of Oklahoma. Lt. Gov. Todd Lamb described it like a “two-mile-wide lawnmower blade going over a community.”

A hospital and an elementary school were both leveled. At least 9 children were killed.

State Highway Patrol Trooper Betsy Randolph said it was “mass devastation. “I’m talking everywhere you looked, the debris field was so high, and so far and so wide, wounded people walking around the streets. They were bloody; there were people that had stuff sticking out of them from things that were flying around in the air. There were cars crumpled up like little toys and thrown on top of buildings. Buildings that were two and three stories tall that were leveled.”

“People are wandering around like zombies,” a reporter said. “It’s like they’re not realizing how to process what had just happened.”

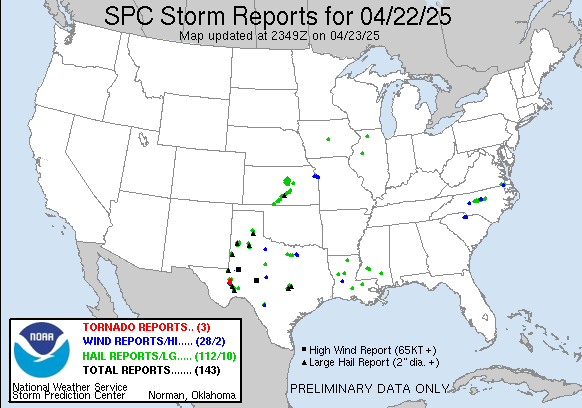
yesterday Reports Graphic

Tornado Reports (CSV) (Raw Tornado CSV)(?)
Time Location County State Lat Lon Comments
1956 NEWCASTLE MCCLAIN OK 3525 9760 LIFTED AROUND 336 PM. ESTIMATED PATH LENGTH OF 20 MILES THRU NEWCASTLE, MOORE, AND SOUTH OKC. PRELIMINARY DAMAGE RATING OF AT LEAST EF4. (OUN)
2056 3 S AVANT OSAGE OK 3645 9606 MULTIPLE SPOTTERS AND BROADCAST MEDIA REPORT A LARGE TORNADO ON THE GROUND THAT FIRST DEVELOPED NEAR AVANT AND CONTINUED NORTHEASTWARD INTO WASHINGTON COUNTY. A TORNADO (TSA)
2112 3 SW DEARING MONTGOMERY KS 3703 9574 BRIEF TOUCHDOWN ALONG HIGHWAY 166 NEAR COUNTY ROAD 3500. (ICT)
2130 1 W MEEKER LINCOLN OK 3550 9691 REPORTED BY KWTV (OUN)
2135 4 W TALALA ROGERS OK 3653 9577 REPORTED BY OKLAHOMA HIGHWAY PATROL (TSA)
2139 2 NE OWENS BROWN TX 3186 9891 TORNADO REPORTED BY HAM RADIO OPERATOR (SJT)
2205 5 SW MANTER STANTON KS 3747 10195 A LANDSPOUT TORNADO WAS REPORTED. ANOTHER PREVIOUS LANDSPOUT THAT OCCURRED AROUND 450PM HAD DISSIPATED. (DDC)
2205 1 S MANTER STANTON KS 3751 10188 A POSSIBLE LANDSPOUT TORNADO WAS REPORTED. ANOTHER PREVIOUS LANDSPOUT THAT OCCURRED AROUND 450PM HAD DISSIPATED. (DDC)
2210 5 SSE THE SAUNDERS ELEV STANTON KS 3740 10200 LANDSPOUT TORNADO REPORTED NEAR THE STATE LINE. (DDC)
2241 1 S RINGGOLD MONTAGUE TX 3381 9795 BRIEF TORNADO REPORTED 1 MILE SOUTH OF RINGGOLD. (FWD)
2245 BLANKET BROWN TX 3182 9879 DPS REPORTED A TORNADO ON THE GROUND IN THE COMMUNITY OF BLANKET. (SJT)
2253 10 NE MONTE VISTA ALAMOSA CO 3768 10601 BRIEF LANDSPOUT LASTED FOR ABOUT 5-6 MINUTES IN OPEN FIELD. (PUB)
2300 5 NNE ZEPHYR BROWN TX 3174 9876 TORNADO REPORTED AT RR-1467 AND CO-291 BY AMATEUR RADIO OPERATOR. (SJT)
2330 8 S QUAPAW OTTAWA OK 3684 9479 DAMAGE TO A DIESEL SHOP. NUMEROUS POWER POLES SNAPPED. SEMI TRAILERS BLOWN OFF THE ROAD. 50 TO 60 FOOT TREE ALSO BLOCKING A ROADWAY 3 MILES EAST OF TWIN BRIDGES LIKELY (TSA)
2336 3 E PROCTOR ADAIR OK 3597 9472 TORNADO REPORTED BY TRAINED SPOTTER AND COLOCATED WITH A STRONG RADAR CIRCULATION. TREES DOWN ON HIGHWAY 62. TORNADO MAY HAVE CONTINUED TO NEAR THE ILLINOIS RIVER BRIDG (TSA)
2349 2 N SILOAM SPRINGS BENTON AR 3622 9454 PHOTO OF A SMALL TORNADO RECEIVED. TREE DAMAGE WAS REPORTED IN THE AREA. TIME ESTIMATED VIA RADAR. (TSA)
0025 PRIDDY MILLS TX 3167 9852 S.O. REPORTS A TORNADO NEAR PRIDDY UPROOTED TREES. (FWD)
0029 HANNIBAL MARION MO 3971 9138 (LSX)
0032 HANNIBAL MARION MO 3971 9138 A SMALL HOLE IN THE ROOF AT THE HANNIBAL – LAGRANGE SCIENCE BUILDING WAS UNCOVERED AND NOT THE ENTIRE ROOF. (LSX)
0036 HANNIBAL MARION MO 3971 9138 THERE ARE SEVERAL LARGE TREES SNAPPED. – SEVERE DANAGE TO TWO MACHINE SHEDS NEAR HIGHWAY MM. SHINGLES REMOVED AT SOME BUILDINGS IN DOWNTOWN AREA. (LSX)
0132 5 WSW BOKOSHE LE FLORE OK 3516 9487 REPORT FROM LAW ENFORCEMENT RADIO OF A TORNADO BETWEEN MCCURTAIN AND BOKOSHE COLOCATED WITH A STRONG RADAR CIRCULATION. BROADCAST MEDIA REPORTED POWER FLASHES IN THE AR (TSA)
0150 CAMERON LE FLORE OK 3513 9453 LAW ENFORCEMENT RADIO REPORTED A TORNADO NEAR CAMERON COLOCATED WITH A STRONG RADAR CIRCULATION. IT MAY HAVE CONTINUED TO THE ROCK ISLAND VICINITY. EMERGENCY MANAGEMENT (TSA)

bookmark_borderSolar Radiation Storms

Solar radiation storms continue. It takes about two days for the effects to reach Earth.

A solar flare is a sudden brightening observed over the Sun’s surface or the solar limb, which is interpreted as a large energy release of up to 6 × 1025 joules of energy (about a sixth of the total energy output of the Sun each second or 160,000,000,000 megatons of TNT equivalen.) They are mainly followed by a colossal coronal mass ejection also known as a CME. The flare ejects clouds of electrons, ions, and atoms through the corona of the sun into space. These clouds typically reach Earth a day or two after the event.

X-rays and UV radiation emitted by solar flares can affect Earth’s ionosphere and disrupt long-range radio communications. Direct radio emission at decimetric wavelengths may disturb operation of radars and other devices operating at these frequencies.

The radiation risks posed by coronal mass ejections are a major concern in discussions of a manned mission to Mars, the moon, or other planets. Energetic protons can pass through the human body, causing biochemical damage,[10] presenting a hazard to astronauts during interplanetary travel. Some kind of physical or magnetic shielding would be required to protect the astronauts. Most proton storms take at least two hours from the time of visual detection to reach Earth’s orbit. A solar flare on January 20, 2005 released the highest concentration of protons ever directly measured,[11] giving astronauts as little as 15 minutes to reach shelter.

Region 1748 has been quiet but current analysis shows it still has the potential for more large events. SWPC forecasters are watching this region very carefully as it rotates further on the disk and into a more geoeffective position.

A CME, from the X1 flare on 15 May, is expected to arrive here late on 17 May but very little effects are forecast.

Solar Flare, May 15, 2013

bookmark_borderCoastal Change: Hurricanes and Extreme Storm Hazards

Part of the Human Induced Climate Change Experiment

One of the goals of the USGS Coastal and Marine Geology Program is a national assessment of coastal change hazards. Hurricanes provide a powerful force that generates dangerous waves and currents capable of moving large amounts of sand, destroying buildings and infrastructure, and reshaping our nation’s coastline. Our research focuses on understanding the magnitude and variability of the impacts of hurricanes and extreme storms on the sandy beaches of the United States. The overall objective is to improve the capability to predict coastal change that results from severe storms. Such a capability will support management of coastal infrastructure, resources, and safety.

Hurricane Sandy Example

As Hurricane Sandy moved northward along the U.S. Atlantic coast in October 2012, U.S. Geological Survey scientists worked to determine where and how the storm’s waves and surge might dramatically reshape the beaches and dunes that stand between the storm and coastal developments. Through a complex modeling process that uses coastal elevations, wave forecasts, and potential storm surge, they predicted coastal change hazards, such as shoreline and dune erosion, that might be expected during a Sandy landfall.

Using the latest storm information available, USGS predicted the likelihood of a range of coastal change impacts within the region affected by the storm:

  • Dune erosion was very likely for the majority of the sandy beaches along the Maryland and Delaware coasts with widespread overwash also very likely in many areas.
  • Most of the New Jersey coast was very likely to experience extensive beach and dune erosion and many areas were very likely to overwash.
  • Along the south shore of Long Island, New York, the models predicted extensive beach and dune erosion as well as intermittent overwash.

Hurricane Sandy, the largest Atlantic hurricane on record, made landfall on October 30, 2012, and impacted a long swath of the Mid-Atlantic coastline. Many areas that had been hit by Hurricane Irene in August 2011 were again battered by strong waves and surge. The barrier islands were breached in a number of places and erosion of the beach and dunes occurred all along the Mid-Atlantic coast. This was the most destructive storm to impact this coastline since an extremely powerful nor’easter in December of 1992.

Following landfall, oblique aerial photography and lidar surveys of beach elevations were used to document the changes that occurred as a result of the storm. In addition, field measurements of the beaches and dunes were collected immediately after the storm. Comparisons of data collected before the storm show the nature, magnitude and spatial variability of the coastal response. These data will be used to further refine predictive models for storm-induced erosion.

Response Activities

Pre-landfall

Post-landfall (approx. 3-14 days)

bookmark_borderPrepare For Severe Weather

FEMA has issued an announcement for residents of the Northeastern United States to be prepared for severe weather.

FEMA encourages all individuals in areas where severe weather is expected to monitor NOAA Weather Radio, and local news for severe weather updates and warnings and to always follow the direction provided by local officials. When natural disasters like severe weather and tornadoes strike, the first responders are local emergency and public works personnel, volunteers, humanitarian organizations, and numerous private interest groups who provide emergency assistance required to protect the public’s health and safety and to meet immediate human needs.

Everyone should become familiar with the terms used to identify a severe weather hazard and discuss with your family what to do if a watch or warning is issued. Some of the more common terms used to describe severe weather and tornado hazards include the following:

  • Severe Thunderstorm Watch – Tells you when and where severe thunderstorms are likely to occur. Watch the sky and stay tuned to NOAA Weather Radio, commercial radio or television for information.
  • Severe Thunderstorm Warning – Issued when severe weather has been reported by spotters or indicated by radar. Warnings indicate imminent danger to life and property to those in the path of the storm.
  • Tornado Watch – Tornadoes are possible. Remain alert for approaching storms. Watch the sky and stay tuned to NOAA Weather Radio, commercial radio or television for information.
  • Tornado Warning – A tornado has been sighted or indicated by weather radar. Take shelter immediately.

For a complete listing of weather-related forecasts in your area, visit www.weather.gov

If you are in an area that is in the track of the storm system but has not yet been affected by the severe weather, it’s never too early to prepare:

  • Keep up to date with local conditions – Follow TV and radio reports from your area, or visit www.weather.gov (http://mobile.weather.gov on your phone) for the latest forecast.
  • Check your family’s emergency supply kit – Make sure you have food, water, medications, and other necessities to sustain you and your family for at least 72 hours. This includes a battery-powered radio, flashlight, extra batteries, cell phone charger, medicines, non-perishable food, and first aid supplies.
  • Listen to the instructions of local officials. Local officials make decisions on sheltering in place or going to your pre-designated safe meeting location.

For more information on severe weather and tornado preparedness tips, visit www.ready.gov or www.listo.gov to find out how you can protect your family during emergencies.

Follow FEMA online at blog.fema.gov, www.twitter.com/fema, www.facebook.com/fema, and www.youtube.com/fema.  Also, follow Administrator Craig Fugate’s activities at www.twitter.com/craigatfema. 

The social media links provided are for reference only. FEMA does not endorse any non-government websites, companies or applications. 

FEMA’s mission is to support our citizens and first responders to ensure that as a nation we work together to build, sustain, and improve our capability to prepare for, protect against, respond to, recover from, and mitigate all hazards.

bookmark_borderGlobal Warming And Climate Volatility

As part of the Human Induced Climate Change Experiment, we have been predicting the effects of global warming on climate volatility. Indeed, we have seen a marked severity in volatile weather systems.

2012 went down as the hottest year in recorded history. Though we are only several days into January, the year is already setting records. There has been snow in the deserts of China, record heat and wildfires in Australia… while record cold temperatures have killed hundreds in India.

bookmark_borderNorthern Hemisphere Snow Cover is Retreating

PHILADELPHIA, PA — What is up with the weather? Yes, we have seen some freaky storms over the past few years. Global warming is expected to cause volatile weather patterns. Indeed, that is what we have been experiencing; however, overall the Northern Hemisphere is showing a steady decline in snowfall.

NOAA:

Northern Hemisphere Snow Cover Extent
Average of monthly snow cover extent anomalies over Northern Hemisphere lands (including Greenland) since Nov 1966. Right: Seasonal snow cover extent over Northern Hemisphere lands since winter 1966-67. Calculated from NOAA snow maps. From BAMS State of the Climate in 2009 report.

Northern Hemisphere average annual snow cover has declined in recent decades. This pattern is consistent with warmer global temperatures. Some of the largest declines have been observed in the spring and summer months.