bookmark_borderRocky Mountain Snow

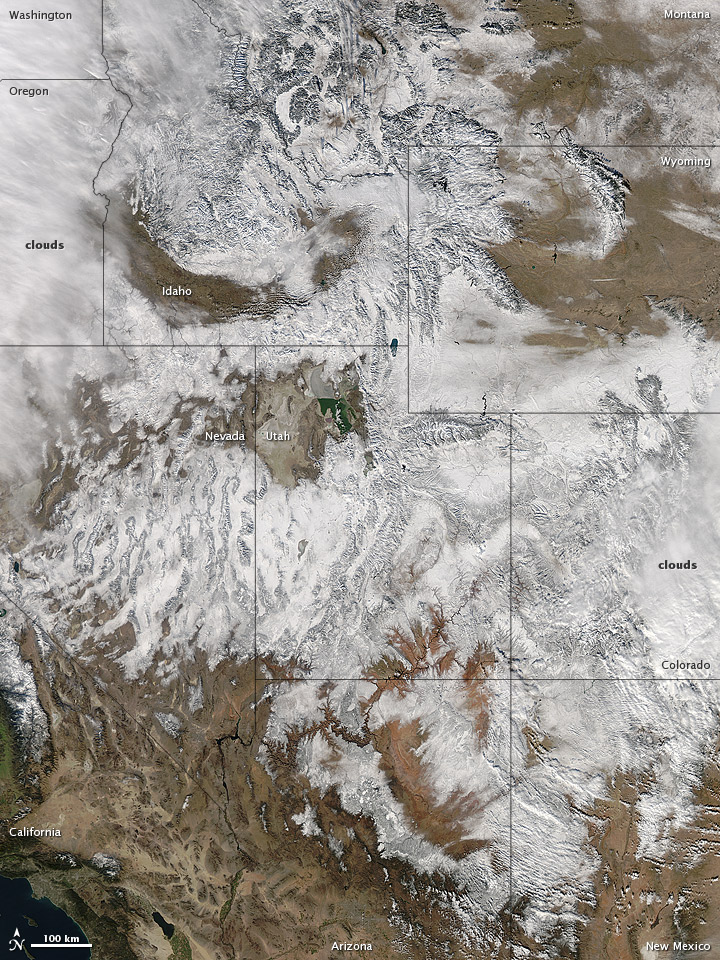
In time for the 2012 winter solstice, a storm dropped snow over most of the Rocky Mountains in the United States. On December 20, the National Weather Service reported snow depths exceeding 100 centimeters (39 inches) in some places—the result of the recent snowfall plus accumulation from earlier storms.

The Moderate Resolution Imaging Spectroradiometer (MODIS) on NASA’s Aqua satellite captured this natural-color image on December 19, 2012. Clouds had mostly cleared from the region, though some cloud cover lingered over parts of the Pacific Northwest and Colorado. Showing more distinct contours than the clouds, the snow cover stretched across the Rocky Mountains and the surrounding region, from Idaho to Arizona and from California to Colorado.

Snowfall did not stop in Colorado, as the storm continued moving eastward across the Midwest. By December 20, 2012, a combination of heavy snow and strong winds had closed schools, iced roads, and delayed flights, complicating plans for holiday travelers.

Though troublesome for travel, the snow brought much-needed moisture; multiple cities had set new records for consecutive days without measurable snow, CBS news reported. As of December 18, the U.S. Drought Monitor stated that a substantial portion of the continental United States continued to suffer from drought, and “exceptional” drought conditions extended from South Dakota to southern Texas.

Reference
CBS News. (2012, December 20) Snowstorm blows out of Rockies, into Midwest. Accessed December 20, 2012.
National Weather Service. (2012, December 20) National Snow Analyses. Accessed December 20, 2012.
University of Nebraska-Lincoln. (2012, December 18) U.S. Drought Monitor. Accessed December 20, 2012.

NASA image courtesy Jeff Schmaltz, LANCE MODIS Rapid Response. Caption by Michon Scott.

Instrument:
Aqua – MODIS

Rocky Mountain Snowstorm

bookmark_borderUnder Low Pressure

Hurricane Sandy is one of the most chaotic systems ever to come up the East coast. A meteorologist for Philadelphia radio station KYW believes it has the lowest recorded barometric pressure of any storm to hit the Mid-Atlantic United States.

Normally, low barometric pressure results in much stronger winds than Sandy’s category 1 status; however, this storm is no normal storm. It is a Frankenstorm.

Weather Channel meterologist Stu Ostro, said Sandy is a “meteorologically mind-boggling combination of ingredients.”

About Chaos Theory

bookmark_borderWhen Storms Collide

October 29, 2012 — The worst case scenario is about to take place for the New Jersey Shore. Hurricane Sandy is expected make landfall during high tide. Part of the Atlantic City boardwalk has already been washed away.

Hurricane Sandy, October 29, 2012

October 26, 2012 — Though hurricane Sandy has been downgraded, there is a chance the Northeastern United States could be walloped. Another storm approaching from the Midwest might converge with Sandy. One computer model estimates $5 billion dollars in damage should this occur.

Hurricane Sandy Satellite Image

Hudson to Baltimore Canyon Southern Florida NE Gulf N of 25N E of 87W Gulf from 22N to 25N E of 87W including Straits of Florida NW Gulf including Stetson Bank N Central Gulf including Flower Garden Banks Marine Sanctuary W Central Gulf from 22N to 26N W of 94W Central Gulf from 22N to 26N between 87W and 94W Atlantic from 27N to 31N W of 77W Atlantic from 27N to 31N between 70W and 77W Atlantic from 27N to 31N between 65W and 70W Bahamas N of 22N including the Cay Sal Bank Atlantic from 22N to 27N E of Bahamas to 70W Tropical N Atlantic from 15N to 19N between 55W and 60W Caribbean N of 18N between 76W and 85W including the Cayman Basin Caribbean N of 18N between 76W and 85W including the Cayman Basin Caribbean approaches to the Windward Passage Atlantic S of 22N W of 70W including approaches to the Windward Passage Cape Fear to 31 N Hatteras Canyon to Cape Fear Baltimore Canyon to Hatteras Canyon Baltimore Canyon to the Hague Line South of New England Georges Bank Gulf of Maine Newport/Morehead City, NC Brownsville, TX Corpus Christi, TX Houston/Galveston, TX New Orleans, LA Lake Charles, LA Mobile, AL Tallahassee, FL Tampa, FL Miami, FL Key West, FL Florida Keys Miami, FL Melbourne, FL Jacksonville, FL Charleston, SC Wilmington, NC Baltimore/Washington, DC Wakefield, VA Philadelphia/Mt. Holly, PA/NJ New York, NY Boston, MA Gray/Portland, ME Intra Coastal Waters from Schoodic Point ME to Stonington ME Coastal Waters from Schoodic Point ME to Stonington ME out 25 NM Waters from Eastport ME to Stonington ME from 25 to 40 NM Waters from Eastport ME to Stonington ME from 25 to 40 NM Northeast Minnesota and Northern Wisconsin Northern Michigan Northern Michigan Northern Michigan East Central Wisconsin - Green Bay East Central Wisconsin - Green Bay Southern and Southeastern Wisconsin Northeastern Illinois and Northwestern Indiana - Chicago Northern Indiana and Northwestern Ohio Southwestern Michigan Northeast Michigan - Gaylord Northeast Michigan - Gaylord Northeast Michigan - Gaylord Southeastern Michigan - Detroit Southeastern Michigan - Detroit Southeastern Michigan - Detroit Northern Ohio Western New York - Buffalo Western New York - Buffalo Northern Michigan Point Conception To Guadalupe Island Point Arena to Point Conception Point St. George to Point Arena Cape Lookout to Point St. George Cape Flattery to Cape Lookout Los Angeles, CA San Diego, CA San Francisco Bay Area/Monterey, CA Eureka, CA Medford, OR Portland, OR Seattle, WA Los Angeles Area Los Angeles Area Los Angeles Area Los Angeles Area Los Angeles Area Los Angeles Area South Central California San Francisco Area Western Nevada North Central California Northwest California Coast Southwest Oregon and Northern California Northeast Oregon and Southeast Washington Northwest Oregon Northwest Washington Eastern Washington and Northern Idaho Southern Nevada, Southeastern California and Northwestern Arizona - Las Vegas Southwestern California - San Diego Central Arizona and California Deserts Southeast Arizona Northern Arizona Utah Northern and Northeastern Nevada Southwestern Idaho and Eastern Oregon Southeastern Idaho Western Montana and Central Idaho Central Montana - Great Falls Northeastern Montana Southeastern Montana Western Wyoming Southeastern Wyoming and Western Nebraska Northeastern Colorado Western Colorado and Eastern Utah Southeastern Colorado Northern and Central New Mexico Southern New Mexico and extreme Western Texas - El Paso Texas and Oklahoma Lubbock and South Plains Texas Western Texas and Southeastern New Mexico Western South Dakota and Northeastern Wyoming Northwestern Kansas and East Central Colorado - Goodland Central Nebraska - North Platte North Central Kansas and South Central Nebraska Southeastern South Dakota, Southwestern Minnesota, and Northwestern Iowa Northern and Northeastern South Dakota Western North Dakota Eastern Nebraska and Southwestern Iowa - Omaha Valley Northeastern Kansas Southeastern Kansas Southwestern Kansas - Dodge City Central Oklahoma Eastern Oklahoma and Northwestern Arkansas Dallas and Fort Worth Central Texas - San Angelo Austin and San Antonio Texas Corpus Christi, Victoria, and Laredo Texas Southern Texas Texas - Houston/Galveston Southeast Texas and Southwest Louisiana Northern Louisiana and Eastern Texas - Shreveport Arkansas Southwestern Missouri Northwestern Missouri Central Iowa Southern Minnesota Northeastern North Dakota and Northwestern Minnesota Northeast Minnesota and Northern Wisconsin Southwestern Wisconsin, Southeastern Minnesota, and Northeast Iowa Eastern Iowa and Northwestern Illinois - Quad Cities Eastern Missouri - West Central Illinois Western Tennessee, Eastern Arkansas and Northern Mississippi - Memphis Central Mississippi Southeastern Louisiana Middle Tennessee Northern Alabama Central Alabama Mobile - Pensacola West Central Florida East Central Florida Panhandle of Florida and Southwestern Georgia Northeast Florida and Southeast Georgia Northern and Central Georgia Low Country of South Carolina and Georgia Northeastern South Carolina and Southeastern North Carolina - Wilmington Central South Carolina and CSRA Western North Carolina and Northwest South Carolina Eastern Tennessee Eastern Kentucky Central Kentucky Southern Illinois and Indiana, Southeastern Missouri and Western Kentucky Central and East Central Illinois Central Indiana Northeastern Illinois and Northwestern Indiana - Chicago Southern and Southeastern Wisconsin East Central Wisconsin - Green Bay Northern Michigan Northeast Michigan - Gaylord Northeast Michigan - Gaylord Southeastern Michigan - Detroit Southwestern Michigan Northern Indiana and Northwestern Ohio Southwestern Ohio Northern Kentucky West Virginia Western Virginia, Southeast West Virginia, and Northwest North Carolina Central North Carolina - Raleigh Eastern North Carolina Eastern Virginia, Southern Maryland and Northeast North Carolina Washington D.C., Central Maryland, Northern Virginia, Eastern West Virginia Western Pennsylvania, East Central Ohio and Extreme Western Maryland Northern Ohio Central Pennsylvania New Jersey, Delaware, and Southeastern Pennsylvania New York City and Surrounding Areas South Central New York and Northeastern Pennsylvania Western New York - Buffalo Eastern New York and Western New England Areas Boston and Surrounding Areas Northern Vermont and New York Southern Maine and New Hampshire Northern Maine Juneau, AK Fairbanks, AK Anchorage, AK Western US Arctic Offshore Eastern US Arctic Offshore Bering Sea offshore 171 degrees West to 180 degrees and north of 56 degrees North Bering Sea offshore 171 degrees West to 180 degrees and south of 56 degrees North Pribilof Islands (St. Paul and St. George) Bering Sea offshore east of 171 degrees West Gulf of Alaska offshore north of 57 degrees North and west of 144 degrees West Gulf of Alaska offshore south of 57 degrees North north of 55 degrees North and west of 144 degrees West Gulf of Alaska north of 55 degrees North and east of 144 degrees West Juneau, AK Honolulu, HI Hawaiian Offshore Waters Hawaiian Offshore Waters

bookmark_borderActs Of God

Natural Disasters in August, 2012

Tropical Storm IsaacAugust 29, 2012
Tropical Storm Isaac
 Hurricane IsaacAugust 28, 2012
Hurricane Isaac
Trinity Ridge FireAugust 28, 2012
Trinity Ridge Fire
Tropical Storm BolavenAugust 28, 2012
Tropical Storm Bolaven
Tropical Storm IsaacAugust 28, 2012
Tropical Storm Isaac
Wildfires in SiberiaAugust 28, 2012
Wildfires in Siberia
Tropical Storm IsaacAugust 27, 2012
Tropical Storm Isaac
Typhoon BolavenAugust 26, 2012
Typhoon Bolaven
Wildfires in AlgeriaAugust 25, 2012
Wildfires in Algeria
Typhoon BolavenAugust 24, 2012
Typhoon Bolaven
Tropical Storm IsaacAugust 23, 2012
Tropical Storm Isaac
Wildfires in CaliforniaAugust 23, 2012
Wildfires in California
Typhoon TembinAugust 20, 2012
Typhoon Tembin
Wildfires in CaliforniaAugust 19, 2012
Wildfires in California
 Wildfire on ChiosAugust 18, 2012
Wildfire on Chios
Typhoon Kai-takAugust 17, 2012
Typhoon Kai-tak
Typhoon Kai-takAugust 16, 2012
Typhoon Kai-tak
Plume from Batu TaraAugust 15, 2012
Plume from Batu Tara
Thick Smoke over WyomingAugust 14, 2012
Thick Smoke over Wyoming
Wildfires in IdahoAugust 14, 2012
Wildfires in Idaho
Tropical Storm Kai-takAugust 13, 2012
Tropical Storm Kai-tak
Western WildfiresAugust 13, 2012
Western Wildfires
Tropical Storm ErnestoAugust 8, 2012
Tropical Storm Ernesto
2012 Arctic CycloneAugust 7, 2012
2012 Arctic Cyclone
Hurricane ErnestoAugust 7, 2012
Hurricane Ernesto
 Mount Tongariro EruptsAugust 7, 2012
Mount Tongariro Erupts
Typhoon HaikuiAugust 7, 2012
Typhoon Haikui
Tropical Storm ErnestoAugust 6, 2012
Tropical Storm Ernesto
Typhoon HaikuiAugust 6, 2012
Typhoon Haikui
Halstead Fire, IdahoAugust 3, 2012
Halstead Fire, Idaho
 Typhoons Saola and DamreyAugust 1, 2012
Typhoons Saola and Damrey

bookmark_borderIsaac

Isaac The Storm
Isaac The Storm


tab Eastern Pacific tab tab Atlantic tab
tab
Click for Eastern Pacific
TC Activity
Graphical Tropical Weather Outlook   |   Active Storms   |   Marine Forecasts


Atlantic – Caribbean Sea – Gulf of Mexico
Tropical Weather Outlook (en Español*)
800 AM EDT MON AUG 27 2012
Tropical Weather Discussion
805 AM EDT MON AUG 27 2012
Tropical Storm ISAAC RSS Feed icon NESDIS Satellite | NDBC Obs | Storm Archive
…ISAAC GETTING A LITTLE BETTER ORGANIZED AS IT MOVES WEST-NORTHWESTWARD OVER THE EASTERN GULF OF MEXICO… …U.S. Warnings in Effect…


8:00 AM EDT Mon Aug 27
Location: 25.7°N 84.7°W
Moving: WNW at 14 mph
Min pressure: 988 mb
Max sustained: 65 mph
Public
Advisory
#25A

800 AM EDT
Aviso
Publico
#25A

800 AM EDT
Forecast
Advisory
#25

0900 UTC
Forecast
Discussion
#25

500 AM EDT
Wind Speed
Probabilities
#25

0900 UTC
NWS Local
Statements
US Watch/
Warning

800 AM EDT
Hurricane Wind Speed Probability
Hurricane Wind
Speed Probability
50-knot Wind Speed Probability
50-knot Wind
Speed Probability
34-knot Wind Speed Probability
Trop Storm Wind
Speed Probability
Max Wind Speed Probability Table
Maximum Wind
Speed Probability
Google Maps API Warnings and Track Forecast Cone
Warnings/Cone
Interactive Map
Warnings and 5-Day Cone
Warnings/Cone
Static Images
Surface Wind Field
Warnings and
Surface Wind
Mariner's 1-2-3 Rule
Mariner’s
1-2-3 Rule
Wind History
Wind
History

*Spanish translations courtesy of the NWS San Juan Weather Forecast Office


Eastern Pacific (out to 140°W)
Tropical Weather Outlook
500 AM PDT MON AUG 27 2012
Tropical Weather Discussion
1005 UTC MON AUG 27 2012
There are no tropical cyclones at this time.


Hurricane Preparedness Sign Image of Hurricane Preparedness
Learn about hurricane hazards and what you can do to help protect yourself, your family, and your
property.

Tropical Cyclone Centers Worldwide

Lat/Lon Distance Calculator
Find distance between latitude/longitude points

Hurricane Season Dates

Hurricane season in the Atlantic begins June 1st and ends November 30th. The Eastern Pacific hurricane season begins May 15th and also ends November 30th.

Hurricane Season Summaries and Reports

Atlantic: Monthly Tropical Cyclone Summary | Tropical Cyclone Reports
East Pacific: Monthly Tropical Cyclone Summary | Tropical Cyclone Reports

bookmark_borderWhen the World Burned Less

More On Climate Change

In the years after Columbus’ voyage, burning of New World forests and fields diminished significantly – a phenomenon some have attributed to decimation of native populations by European diseases. But a new University of Utah-led study suggests global cooling resulted in fewer fires because both preceded Columbus in many regions worldwide.

“The drop in fire [after about A.D. 1500] has been linked previously to the population collapse. We’re saying no, there is enough independent evidence that the drop in fire was caused by cooling climate,” says the study’s principal author, Mitchell Power, an assistant professor of geography at the University of Utah.

“The implication is that climate is a large-scale driver of fire. That’s a key finding. Climate is driving fire on global and continental scales,” says Power, who also is curator of the Garrett Herbarium at the Natural History Museum of Utah, which is part of the University of Utah.

The new study analyzed worldwide charcoal samples spanning 2,000 years. It will be published online during August in the journal The Holocene, which is the name of the geological epoch covering roughly the last 11,500 years of Earth’s history. It was funded by the National Science Foundation and the Natural History Museum of Utah.

The study deals with the Little Ice Age, a period when Earth’s climate cooled, causing New York Harbor to freeze over in 1780, among other effects. Estimates of when the Little Ice Age started range from the 1200s to the 1500s. It ended in the early 1800s. Possible causes include some combination of increased dust from volcanic eruptions, decreased solar activity, and changes in circulation of the ocean and atmosphere.

“The decrease in fire on a very large scale – globally and in the Americas – was controlled by this cooling climate, which began prior to the population collapse, and climate alone is sufficient to explain large scale changes in burning,” says Power.

“In a cooler atmosphere, you tend to get reduced convection, so you get reduced thunderstorms and ignition from lightning,” he says. “Cooler climate also tends to maintain high levels of fuel moisture and soil moisture.”

Today, warming climate and drought have been tied to increasing fires in the U.S. West and elsewhere. “In a world where climate is rapidly changing we need to pay more attention to this relationship between climate and fire,” Power says

Power conducted the study with 19 other scientists, including paleoecologist Frank Mayle at the University of Edinburgh, U.K., and climatologist Patrick Bartlein at the University of Oregon. Other coauthors – who provided charcoal data or samples – are from University of Wisconsin, Madison and Oshkosh; Northern Arizona University; University of Gottingen, Germany; Canadian Forest Service; University of Montpellier, France; University of Bern, Switzerland; University of Calgary, Canada; University of Tennessee; Virginia Tech; University of North Carolina; University of Chile; Laval University, Quebec; Fordham College, New York; and Central Washington University.

Cooling Climate or Population Collapse?

After Columbus reached the New World in 1492, explorers brought European diseases such as smallpox that “decimated populations in the Americas – 10 million to 100 million dead, with most estimates in the 60 million range,” Power says.

“All these people died abruptly – Mayans, Incas, Aztecs and down in Patagonia – they were all affected,” he adds. “Agriculture was sharply reduced. Landscapes that had been cleared for agriculture started a process of plants growing back and infilling those abandoned fields. In terms of greenhouse gases, when you change from maintained cropland to woodlands, plants take up more carbon dioxide and there is less in the atmosphere. This has been pointed to as one mechanism for causing the Little Ice Age.”

Power agrees population collapse may have led to reduced biomass burning in some local regions of the Americas. But the new study indicates the reduction in fire was actually global and began before Columbus in most areas, suggesting the Little Ice Age triggered most of the reduction in burning – not the other way around, Power says.

“If you look at independent climate records, cooling from the Little Ice Age was happening about 200 years before the population collapse,” or about A.D. 1300, he says.

Power notes there is room for debate because the Little Ice Age varied in time and space, and didn’t affect all parts of the world equally, although most places cooled.

A Record of Fire Left in Charcoal

The study used existing records and-or new samples of charcoal – burnt wood or other biomass – found in sediment cores from lake bottoms and bogs from some 600 sites around the world, about half in the Americas, and dated within the past 2,000 years.

“Whatever was burning, we see a record of that fire in lake sediments, from either aerial transport or erosion” of burned material, Power says.

Power manages the Global Charcoal Database that compiles data from all the existing studies that date charcoal samples and describe where they came from. The new study included 498 existing charcoal records and 93 new samples.

“We have gone back in and calculated the ages of all these charcoal samples,” except for some dated independently in other recent studies, and then used recent radiocarbon dating calibrations to make sure all data are consistent, Power says.

“Greater than 80 percent of biomass burning records show a decline post-1500 in the Americas, he says. The other 20 percent may be from areas that were still fire-prone despite cooling or that simply had burning declines for which there are inadequate charcoal samples, he adds.

The study compared the charcoal records with previously published ancient climate records and population reconstructions. It found:

– Clumping all the charcoal data in two groups – from the Americas or the Eastern Hemisphere – shows that in the Americas, biomass burning declined between 1500 and 1650 and stayed at a minimum until 1700, the same time as the peak of the Little Ice Age. That period was the lowest level of burning in the past 6,000 years.

– In the Eastern Hemisphere, there was a prominent decline in burning that began about 1400 – well before the population collapse in the Americas. Power says cooling also started about a century earlier in the Eastern Hemisphere than in the Americas – more evidence cooling caused reduced burning. There was no parallel population collapse large enough to explain the reduction in burning, although a small downward blip in burning is noted in Europe around the time of the bubonic plague or Black Death.

– In tropical Middle America – the Caribbean Basin, Mexico and Central America – climate cooling starting around 1350, when burning also begins to decline. Population collapse didn’t begin until around 1500.

– In tropical South America, climate changed around 1350 to 1400. There is debate whether it warmed or cooled. The population collapsed after 1500. Power says neither climate nor population strongly influenced post-Columbian biomass burning in that region, which declined only subtly and not until 1700. It also is possible the population that collapsed didn’t use fire very much in agriculture – something a recent study coauthored by Power found in French Guiana.

– In southern South America, ice-core and tree-ring growth studies show cooling began about 1450, well before an abrupt decline in burning in 1550. That would seem to support the theory that population collapse reduced burning – except that the region had little population, certainly not enough for any decline to trigger a reduction in burning.

– Ice cores from Greenland show cooling started about 1450, and fire started to decline about 1500, according to charcoal for boreal Canada and the western United States. Cooling and reduced burning stopped about 1800. Despite the 50-year lag, Power says that is more evidence tying climate cooling to reduced biomass burning, particularly since the region had relatively few people at the time.
bookmark_borderHurricane Daniel

In early July 2012, two simultaneous hurricanes blew over the eastern Pacific Ocean: Hurricane Emilia and Hurricane Daniel. The first of the two storms to form, Daniel started as a tropical depression on July 4. The storm had strengthened to a Category 2 hurricane by 12:20 p.m. Pacific Daylight Time on July 8, when the Moderate Resolution Imaging Spectroradiometer (MODIS) on NASA’s Terra satellite captured this natural-color image. By that time, Daniel sported a distinct eye characteristic of hurricanes, and its spiral arms spanned hundreds of kilometers over the open ocean.

At 2:00 p.m. PDT on July 8, not long after MODIS acquired this image, the U.S. National Hurricane Center (NHC) reported that Daniel was located roughly 1,120 miles (1,800 kilometers) west-southwest of the southern tip of Baja, California. The storm had maximum sustained winds of 105 miles (165 kilometers) per hour.

By the following day, Daniel had weakened, though it remained a hurricane. At 8:00 a.m. PDT on July 9, Daniel had moved farther away from Baja California, and the storm’s wind speeds had dropped to 85 miles (140 kilometers) per hour. No hazards affected land as of July 9, the NHC reported, and Daniel was expected to weaken further as it continued moving westward.

Though the storm posed no threat to Mexico, it had the potential to bring unsettled weather to Hawaii. Daniel’s remnants were expected to pass south of the island chain around July 13, 2012, AccuWeather reported. Remnants of the storm might cause gusty winds, heavy rains, and even localized flash flooding.

  1. References

  2. National Hurricane Center. (2012, July 9) Hurricane Advisory Archive. Accessed July 9, 2012.
  3. Edwards, B. (2012, July 9) Hurricane Daniel could impact Hawaii by late week. AccuWeather. Accessed July 9, 2012.

NASA image courtesy Jeff Schmaltz, LANCE MODIS Rapid Response Team, Goddard Space Flight Center. Caption by Michon Scott.

Instrument: 
Terra – MODIS
Hurricane Daniel
Hurricane Daniel


bookmark_borderGeomagnetic Storm Watch

As the strongest Solar Radiation Storm (S3) since May, 2005 continues, the associated Earthward-directed Coronal Mass Ejection is expected to arrive about 1400 UT (9am EST) Jan 24. SWPC has issued a Geomagnetic Storm Watch with G2 level storming likely and G3 level storming possible, with the storm continuing into Wednesday, Jan 25. All of this activity is related to a moderate (R2) Radio Blackout x-ray flare that erupted Sunday night (11pm EST).

Geomagnetic Storm Photo of the Sun

NOAA Updates

bookmark_borderChaos Theory and Tsunami Reach California

Has a tsunami ever affected the United States? Yes… just last week.

Chaos Theory

Manmade and natural events can change important characteristics of U.S. waterways, ports, and harbors, and investigating those changes are an important responsibility for NOAA’s Office of Coast Survey. Following last week’s tsunami, Coast Survey’s staff and equipment on the West Coast are assisting with detection of submerged debris in critical marine transportation arteries along the coast.

The tsunami left the port at Crescent City, Calif., in a shambles, with marine debris and wreckage above and below the waterline. The U.S. Army Corps of Engineers asked Coast Survey to assist with hydrographic survey support there, to help make sure commercial and recreational vessels can begin to navigate safely and efficiently once again.

The U.S. Coast Guard and the Army Corp of Engineers also asked Coast Survey to survey the federal channel at Santa Cruz, Calif., which also experienced extensive damage and destruction to boats.

Coast Survey staff and navigation response teams have deployed to both port areas, and are coordinating with USCG and USACE to begin the hydrographic surveys.

Using a small boat equipped with powerful echo-sounding SONAR equipment, the teams will search the seafloor for sunken vessels, debris, and other hazards dangerous to commercial shippers and recreational boaters. The teams will also check the areas for shoaling. If the teams find shoaling, they will measure the bathymetry for updating NOAA’s nautical charts of the areas.

The Coast Survey navigation manager based in California is coordinating rapid response survey requests and navigational resources from areas impacted by last week’s tsunami.