bookmark_borderMoney Moves People: Why Demand Destruction May Be the Fastest Path Beyond Fossil Fuels

by Daniel Brouse

2026: The New Economic Reality

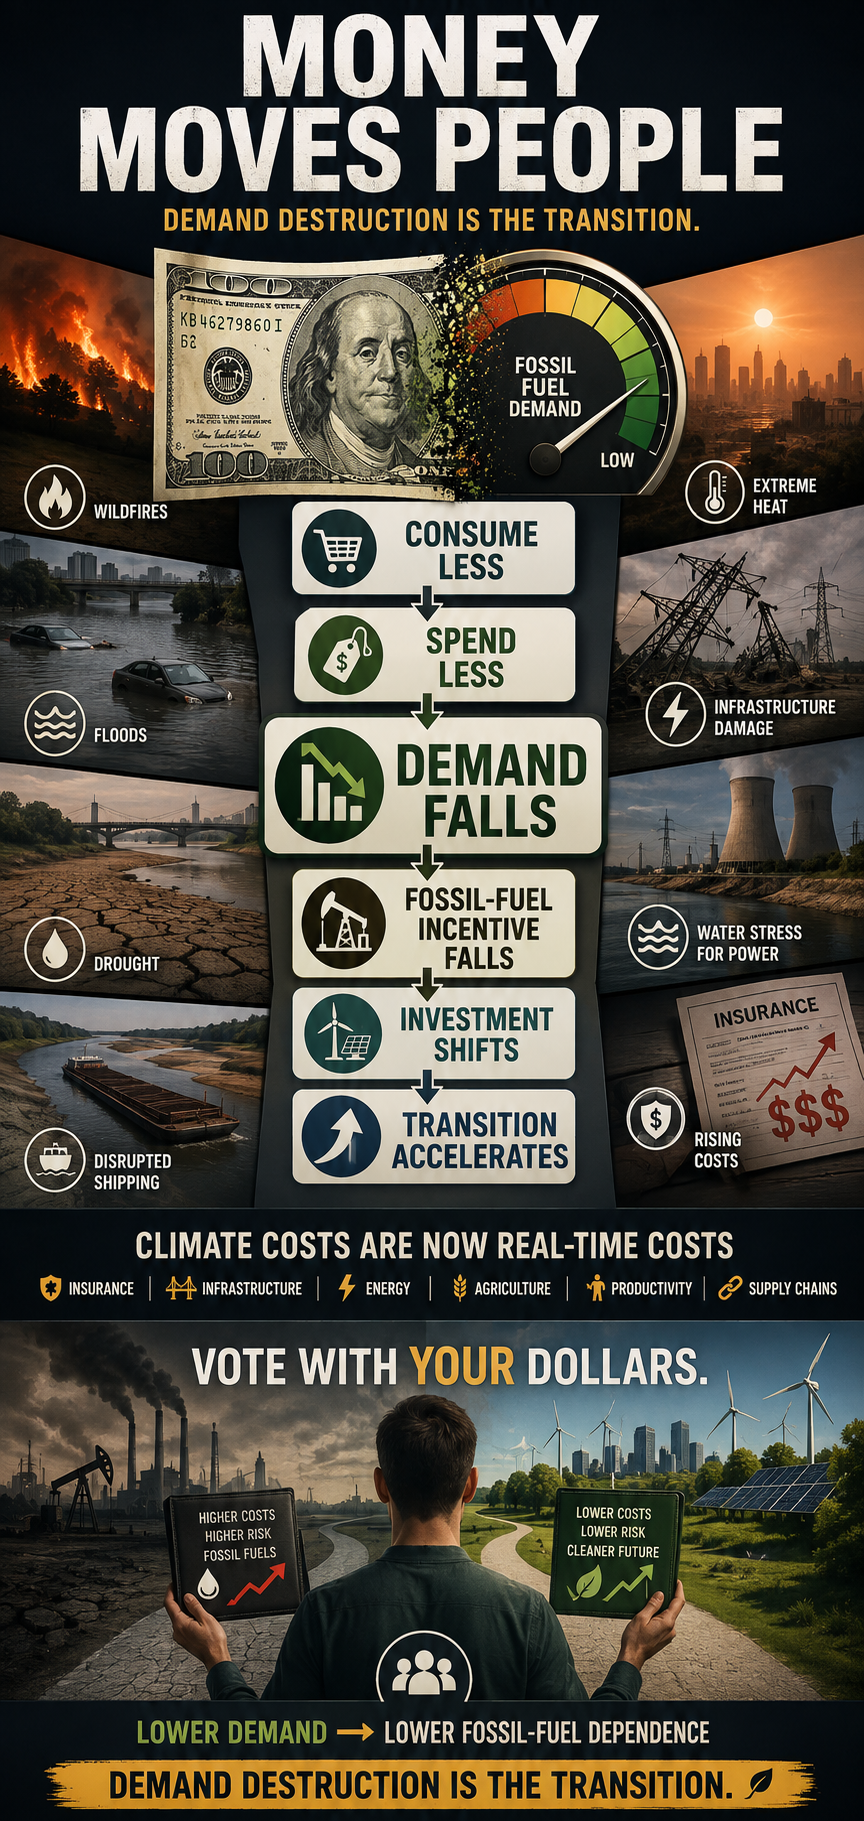
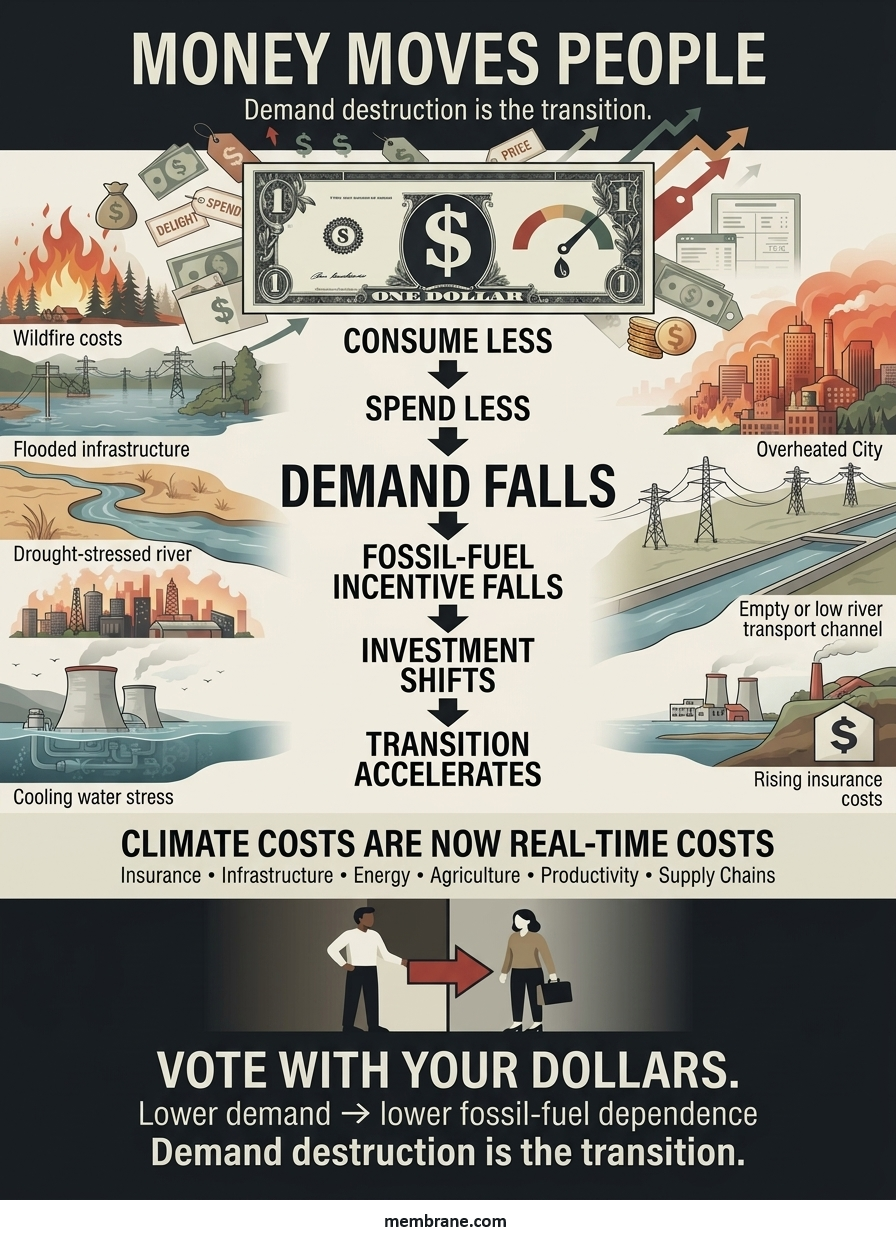
Money moves people.

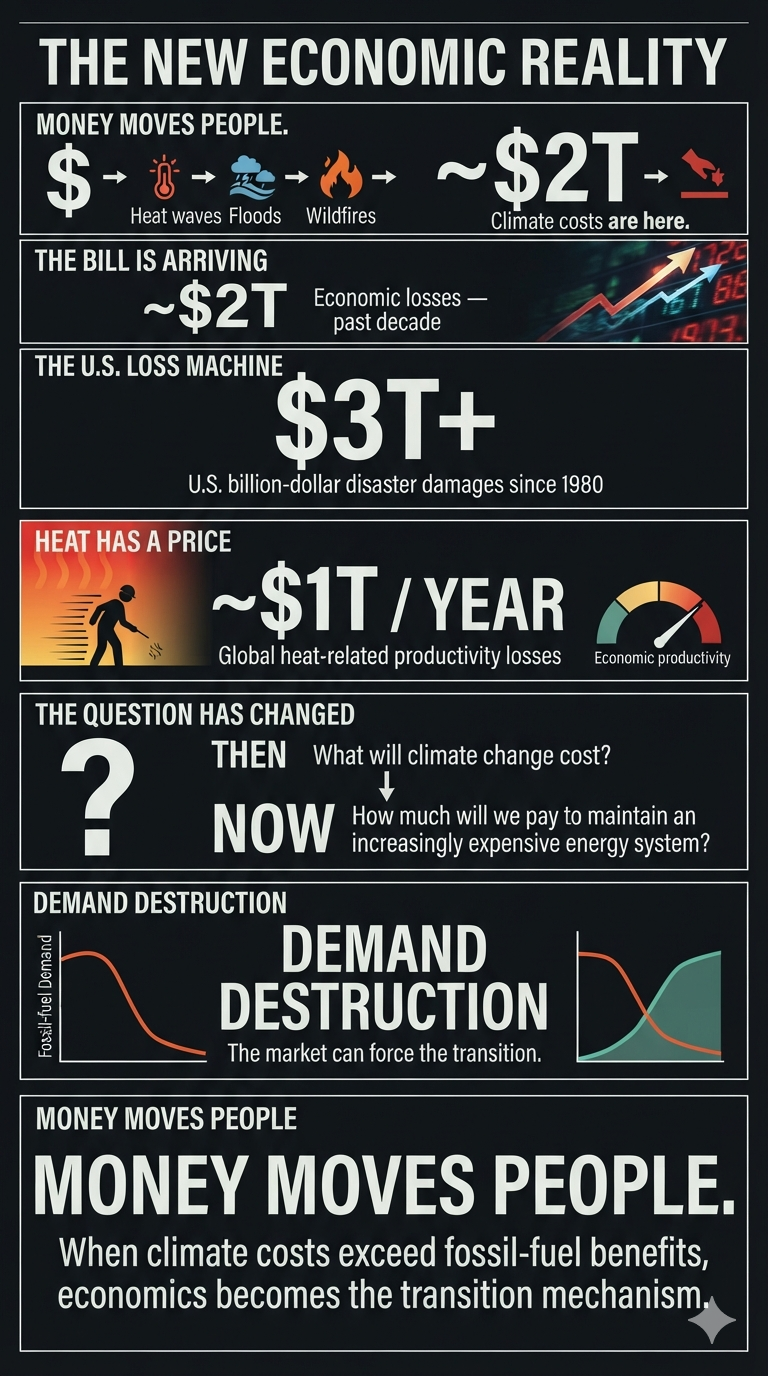
The climate costs of fossil-fuel dependence are increasingly outweighing its benefits—not in some distant future, but here and now. We are moving beyond arguments about what climate change might cost decades from today. Across the Western world, climate impacts are already imposing costs of hundreds of billions of dollars in real time.

Insurance is only one part of the story.

Infrastructure, agriculture, transportation, labor productivity, public health, energy systems, and financial markets are all beginning to absorb the cost of a destabilizing climate. The economic question is therefore changing. It is no longer simply:

“What will climate change cost us?”

It is increasingly:

“How much are we willing to pay to preserve an energy system that is becoming progressively more expensive to maintain?”

Climate Stress Is Becoming an Economic Stress Test

The physical infrastructure of the global economy is already being affected.

Maersk CEO Vincent Clerc has warned that climate change is putting increasing pressure on European waterways and that substantial infrastructure investment will be needed to keep the Rhine operating as a critical transportation artery.

But the economic importance of waterways extends far beyond shipping.

Rivers, lakes, and reservoirs are also critical components of the energy, industrial, agricultural, municipal, and ecological systems that support modern economies.

When water levels fall or water temperatures rise, power plants can be affected directly. Thermoelectric and nuclear power plants rely heavily on water for cooling. If river flows become too low, or water temperatures become too high, operators may be forced to reduce generation or temporarily shut down units because sufficient cooling capacity is no longer available or because thermal discharge limits are exceeded.

That creates an economic chain reaction:

Lower river flows or higher water temperatures
↓
Reduced cooling capacity
↓
Reduced power generation
↓
Tighter electricity supplies
↓
Higher electricity prices and grid stress
↓
Higher operating costs for industry and consumers

The same waterways that transport fuel, raw materials, agricultural products, chemicals, and manufactured goods can therefore also be essential to producing the electricity needed to move and manufacture those goods.

Water is simultaneously a transportation system, cooling system, industrial input, agricultural resource, and ecological asset.

When that system becomes unstable, multiple economic sectors can be affected at the same time.

Low water levels can also restrict the movement of coal, oil, natural gas, grain, chemicals, construction materials, and other bulk commodities. Barges may have to reduce their loads or make more trips to transport the same volume of goods. In some cases, alternative transportation by rail or truck becomes necessary, increasing fuel consumption, congestion, labor costs, and emissions.

Flooding creates the opposite problem.

Excess water can damage ports, locks, bridges, rail connections, roads, warehouses, industrial facilities, and electrical infrastructure. A waterway can therefore become economically disruptive at both extremes—too little water and too much water.

Agriculture is similarly exposed. Rivers and reservoirs provide irrigation, livestock water, and municipal supplies. Persistent drought can reduce agricultural output while increasing competition among farmers, cities, industry, ecosystems, and energy producers for increasingly scarce water.

There is also a less visible economic cost: water temperature itself is becoming an economic variable.

Warmer rivers can reduce their ability to absorb additional heat from industrial processes and power-plant cooling systems. At the same time, warmer water can stress aquatic ecosystems, fisheries, and drinking-water systems, creating additional regulatory, treatment, and ecological costs.

This produces a broader economic concept that is often missed in conventional disaster accounting:

Waterway disruption is not a single-sector problem. It is a systems problem.

The Rhine and Danube are not simply waterways. They are components of Europe’s economic infrastructure. They connect ports, factories, power plants, farms, cities, mines, warehouses, rail networks, and consumers. When climate conditions interfere with their operation, the economic consequences propagate through the system. A river does not have to disappear to create an economic crisis. It only has to become less reliable. And reliability is one of the most valuable—and often least visible—assets in a modern economy.

The Economic Toll of Extreme Weather

Global extreme weather and natural disasters are generating enormous economic losses. Recent estimates from the International Chamber of Commerce, insurers including Swiss Re, and disaster-loss tracking organizations show that severe convective storms, wildfires, floods, and other extreme events are producing annual losses measured in the hundreds of billions of dollars.

The first half of 2026 alone has already produced approximately $100 billion in global economic losses, while the cumulative economic toll over the past decade has reached roughly $2 trillion, according to recent assessments.

And the year is not over.

The second half of the year normally includes the peak of the North Atlantic hurricane season, creating the potential for another substantial wave of losses.

The Major Economic Drivers

Escalating annual losses.
Global disaster losses continue to accumulate at extraordinary levels. The combined economic losses from 2022 and 2023 alone have been estimated at roughly $451 billion.

The concentration of U.S. losses.
The United States remains a major source of global insured catastrophe losses. By June 2026, the country had already experienced 12 billion-dollar weather and climate disasters, with estimated losses totaling approximately $31.9 billion.

Severe convective storms.
Hail, tornadoes, straight-line winds, and other severe thunderstorms have become an increasingly persistent source of financial losses. The United States recorded a record 21 billion-dollar severe-convective-storm events in 2025.

Extreme heat and productivity.
The economic damage from climate change is not limited to destroyed buildings and infrastructure. Heat reduces worker productivity, particularly in construction, agriculture, manufacturing, and outdoor occupations. Global heat-related productivity losses have been estimated at roughly 1% of world GDP annually—around $1 trillion.

The long-term U.S. bill.
U.S. billion-dollar weather and climate disasters have generated cumulative damages exceeding $3 trillion since systematic tracking began in 1980.

The Trajectory Is the Story

Recent U.S. disaster statistics illustrate the increasing economic burden:

YearBillion-Dollar EventsEstimated DamageMajor Loss Drivers
202523~$115 billionSevere storms, wildfires
202427~$182.7 billionSevere storms, tropical cyclones, extreme heat
202328$145+ billionSevere storms and other extreme events

The important point is not that every individual disaster can be attributed exclusively to climate change.

The economic signal emerges from the frequency, intensity, persistence, and cumulative cost of extreme conditions.

Climate change does not need to create every storm, flood, drought, or wildfire to transform the economics of risk. It only needs to increase the probability, severity, or duration of damaging events enough to alter the cost structure of society.

That is already happening.

“Demand Destruction” Is Our Friend

This brings us to one of the most powerful—and least appreciated—economic mechanisms in the energy transition:

Demand destruction.

The International Energy Agency has projected that global oil demand will decline more sharply than previously expected in 2026, forecasting a reduction of approximately 1.6 million barrels per day.

The significance extends beyond the number itself.

As an economist, I am less concerned with establishing a specific date by which the world must eliminate fossil fuels than I am with changing the economic forces that sustain fossil-fuel demand.

That distinction matters.

People do not necessarily change because someone wins an argument about climate science. They change because incentives change. Prices change. Risk changes. Availability changes. And eventually, behavior changes.

Money Moves People

I am unlikely to change the minds of the roughly 20% of Americans who are ideologically committed to policies that accelerate fossil-fuel dependence.

But that leaves the vast majority of the population. And economics can do much of the work. Integrated Climate Stewardship begins with reducing unnecessary consumption.

Consumerism drives energy demand, resource extraction, pollution, waste, and habitat destruction. Every unnecessary unit of consumption represents another demand for energy and materials somewhere in the global economy.

Consume less, and demand falls.

Demand falls, and the economic incentive to produce falls.

That is the mechanism.

The Economics of Personal Climate Stewardship

Today, only a small fraction of Americans appear to be pursuing a deliberately structured net-zero lifestyle through continuous behavioral reductions, efficiency improvements, and intentional balancing. But this does not mean the model cannot scale. The critical question is how climate stewardship is presented.

If reducing climate impact is framed exclusively as sacrifice, people resist. If it is framed as economic self-interest, the equation changes.

What happens when people discover that reducing unnecessary consumption can save them thousands of dollars a year?

What happens when energy efficiency lowers household expenses?

When smaller vehicles reduce fuel, maintenance, and insurance costs?

When reducing waste means buying fewer things that do not provide meaningful value?

When local production and durable goods become economically attractive?

When conservation becomes synonymous with financial resilience?

The behavior does not have to begin with ideology.

It can begin with a household budget.

Vote With Your Dollars

This is where the remaining majority of the population becomes economically important.

When millions of people begin making purchasing decisions based on cost, durability, efficiency, resilience, and environmental impact, they collectively alter demand.

When demand changes, markets respond. When fossil-fuel demand declines, the economic incentive to extract, refine, transport, and sell fossil fuels declines with it. This is fundamentally different from waiting for governments to impose every change from the top down. It is a bottom-up economic transition.

People do not have to agree about everything.

They do not have to become climate activists.

They do not even have to agree about climate policy.

They simply have to discover that some forms of consumption are no longer worth what they cost.

The Feedback Loop

The process can become self-reinforcing:

Lower unnecessary consumption
↓
Lower household costs
↓
Lower energy and resource demand
↓
Reduced fossil-fuel demand
↓
Lower economic incentive for fossil-fuel expansion
↓
Greater investment in alternatives and efficiency
↓
Further reductions in fossil-fuel demand

This is an economic feedback loop.

And unlike many climate-policy debates, it does not require everyone to agree on the destination before beginning the journey.

Demand Destruction Is the Transition

The transition away from fossil fuels is often described as a supply problem:

How quickly can we replace coal, oil, and natural gas?

But there is another side of the equation.

How quickly can we reduce the demand that makes fossil-fuel extraction profitable?

That may ultimately be the more powerful question.

We do not need to convince every person to become an environmentalist.

We need to make lower-carbon choices increasingly rational economic choices.

The climate crisis is already generating enormous costs. Insurance premiums are rising. Infrastructure is being stressed. Agricultural productivity is being disrupted. Heat is reducing labor capacity. Extreme weather is destroying capital. Supply chains are becoming more vulnerable.

These costs are not theoretical.

They are appearing on balance sheets, household budgets, insurance statements, government budgets, and corporate earnings reports.

The economic system is beginning to receive the bill.

And money moves people.

Demand destruction is not the enemy of the energy transition.

Demand destruction is the transition.
bookmark_borderIntegrated Climate Stewardship: The Fossil Fuel Question and Answer

Question:

I use phasing out in a way that means completely ending the use and production of fossil fuels down to zero. Phasing down means a gradual reduction or scaling back in FF use over time without specifying a complete stop. Would add or alter that in any way?

How would you define differntiate ‘transition away’?

Reply:

I would slightly modify your definition of “phasing down” to: “a gradual reduction or scaling back in fossil-fuel use over time without specifying a date for complete cessation.”

There are really two separate issues for me:

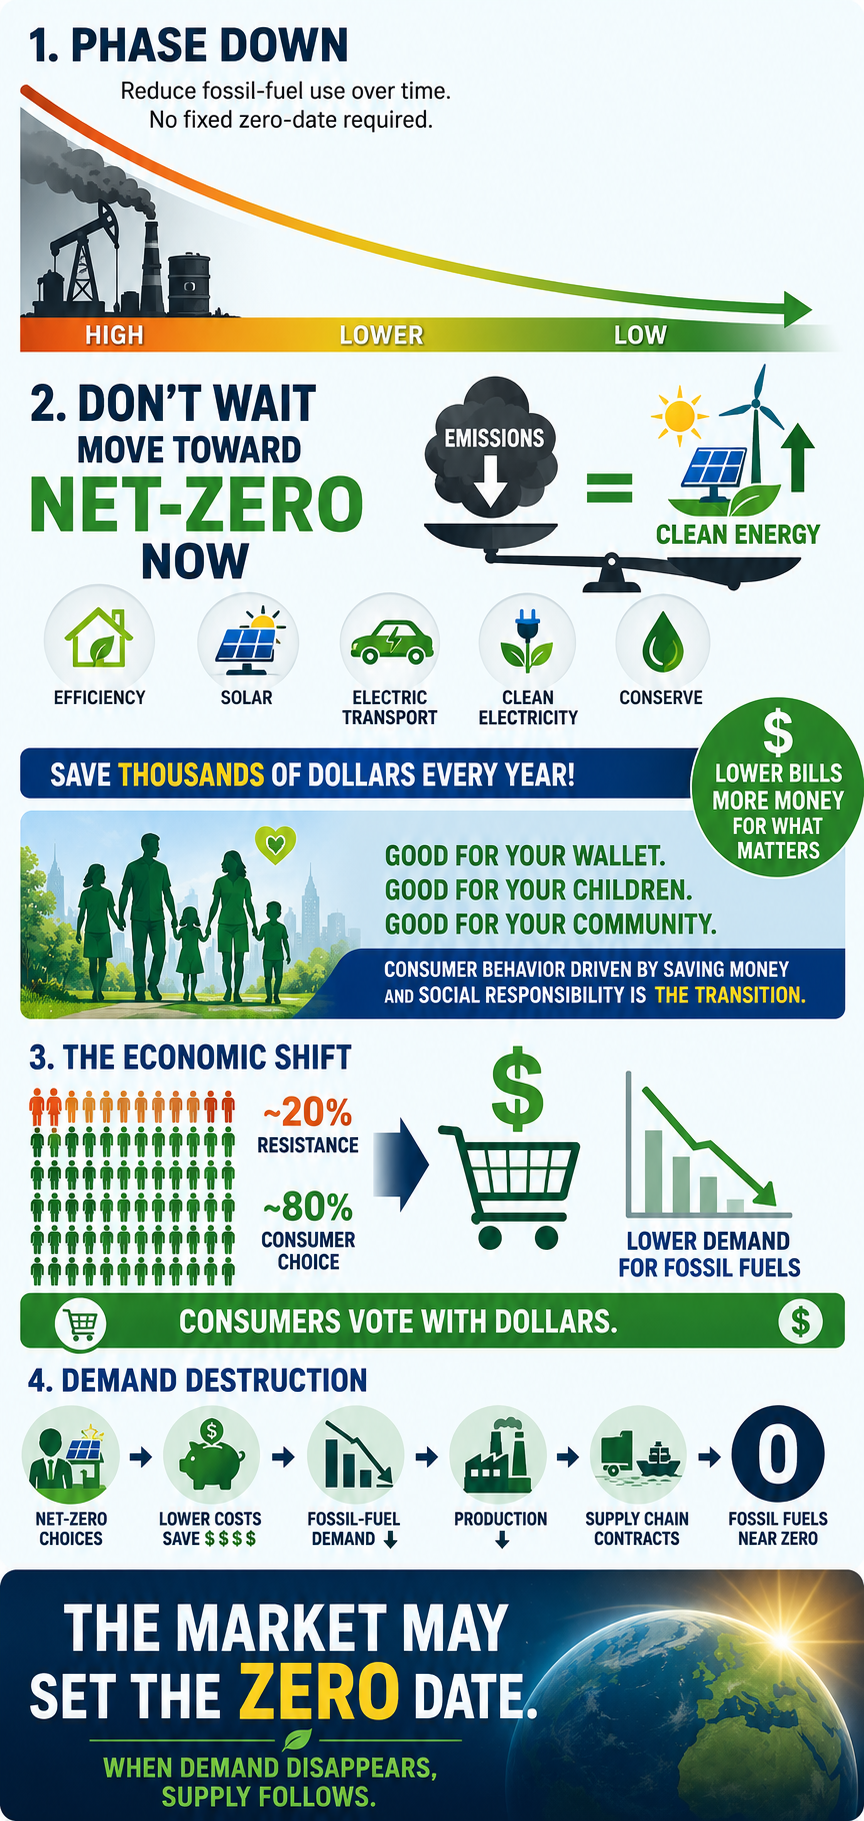
1. For this generation, I prefer net-zero carbon emissions as the immediate goal. If someone isn’t already moving toward net-zero, I think they should start now. We don’t need to wait for a theoretical future phase-out date to begin reducing emissions.

2. As both a climatologist and an economist, I’m not convinced that setting a specific date for the complete elimination of fossil fuels is ultimately what matters. In the U.S., roughly 20% of the population appears ideologically committed to policies that would accelerate climate change. Nothing I say or do is likely to change that.

But that still leaves roughly 80% of the population—and I think economics is going to do much of the work.

Right now, perhaps only ~0.5% of Americans are seriously attempting a structured net-zero lifestyle through continuous behavioral reductions and intentional balancing. As more people discover that net-zero can actually save them thousands of dollars a year while also leaving a better environment for their children and grandchildren, I expect consumer behavior to change.

When the remaining ~79.5% begin voting with their dollars, fossil-fuel demand will fall. That creates demand destruction, which ultimately means suppliers will have less and less reason to produce fossil fuels.

So, ironically, I don’t think we necessarily need to establish the exact date when fossil fuels reach zero. The market may establish that date for us. The “complete stop” happens when there is no longer sufficient demand to sustain the fossil-fuel supply chain.

Question:

When you use the term net zero is it with the understanding that the “net” component allows continuous greenhouse gas emissions under the assumption that unproven removal technologies or flawed offsets will balance them out later, delaying necessary fossil fuel phaseouts?

Net zero is a contentious term within my community and I want to be clear that I understand how you see and apply it.

Reply:

That’s an important distinction. When I use the term net-zero, I’m talking about it at the personal/lifestyle level, and I am not using “net” to justify continuing to emit greenhouse gases while assuming that unproven technologies or questionable offsets will clean up the problem later.

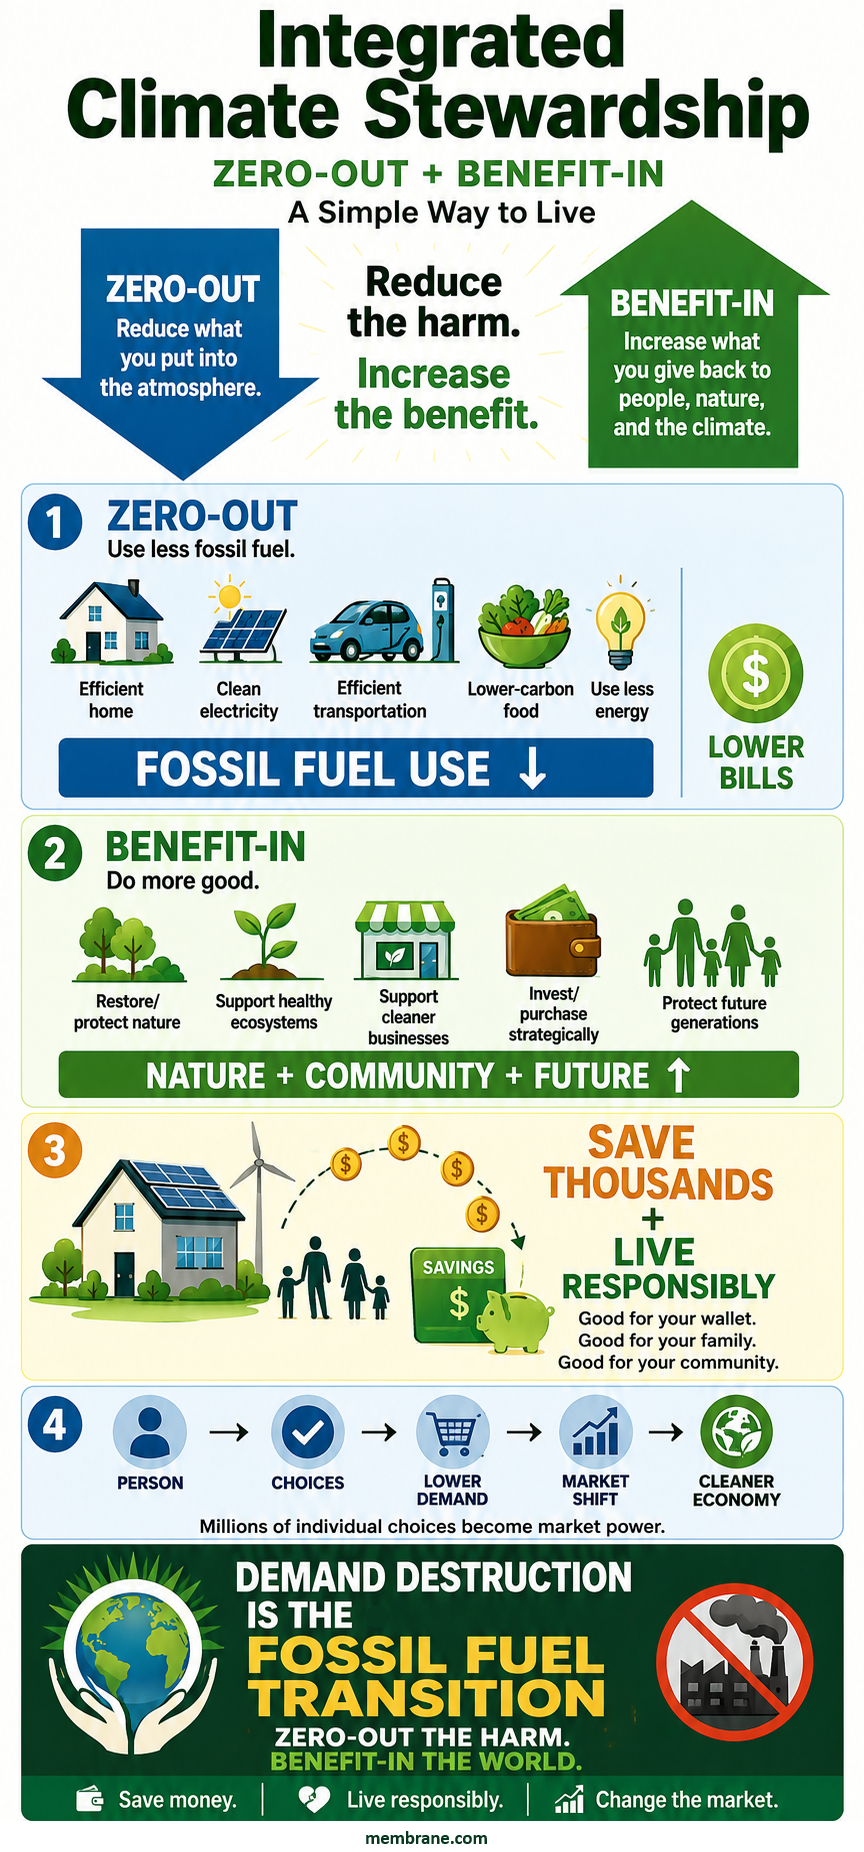
What I mean is closer to “Holistic Net-Zero Living” or “Integrated Climate Stewardship”: reducing and, wherever realistically possible, zeroing out the emissions associated with my own lifestyle first, while also taking responsibility for the impacts I can’t immediately eliminate.

For me, that means a 360-degree carbon strategy:

ZEROING OUT / STRUCTURAL DECARBONIZATION

  • Electrifying transportation and home energy
  • Increasing energy efficiency
  • Using clean electricity
  • Reducing fossil-fuel consumption as close to zero as practical
  • Reducing high-carbon consumption, including dietary choices

BEYOND MY DIRECT FOOTPRINT

  • Supporting ecosystem restoration and conservation
  • Protecting forests and biodiversity
  • Supporting businesses and technologies that accelerate decarbonization
  • Using my purchasing and investment decisions to create economic demand for cleaner alternatives

So I’m not saying, “Keep emitting and someone will remove it later.” Quite the opposite. The first priority is eliminating the emissions themselves.

I think of the “net” component as recognizing that an individual cannot instantly eliminate every indirect emission associated with modern life. Rather than pretending those emissions don’t exist, I try to compensate through additional positive actions while continuously working to reduce the underlying footprint.

Ultimately, my goal isn’t simply to achieve a favorable carbon-accounting number. It’s to change the way I live so that my actual fossil-fuel demand approaches zero—and to use my economic choices to help make that transition happen systemically.

That’s why I sometimes think “holistic net-zero living” or “integrated climate stewardship” communicates what I mean better than simply saying “net-zero.”

Question:

Why continue using the language of ‘net zero’? What economic model do you see best aligns w/ what you have outlined?

Reply:

Haaha… good questions.

A: I’m actually in the process of writing the paper that officially changes my language from “net-zero” to “Integrated Climate Stewardship.” So thank you for pushing me on that. I think the new terminology better captures what I’ve been trying to describe.

B: I’m also working on the economic model, and that one is considerably trickier—not because of the terminology, but because AI is changing the underlying economics so rapidly.

I see AI as a double-edged sword. On one edge, as AI replaces more human labor and productivity, the human contribution to economic production could eventually become a much smaller share of GDP. AI may also be capable of producing enormous amounts of economic value with far less energy per unit of output than traditional human labor and many existing production systems.

But the other edge of that sword is wealth distribution.

If the ownership of AI, capital, and productive capacity becomes increasingly concentrated, we could see extraordinary productivity growth occurring alongside increasingly unjust wealth inequality. We could potentially solve one problem—resource and energy efficiency—while creating another: who actually owns and benefits from the productivity?

That’s the economic model I’m wrestling with now: how do we build an economy where AI-driven productivity, decarbonization, consumer savings, and environmental stewardship reinforce each other while the resulting wealth is broadly distributed?

That may ultimately be a much bigger economic question than the climate transition itself.

Question:

Have you been sitting with the economic of degrowth in all of this then? Sounds like there is that tension in what is being considered.

Reply:

Yes. I’ve been sitting with the economics of degrowth quite a bit. And I think there’s an interesting tension here.

Traditional capitalism is fundamentally tied to population growth, human labor, productivity, and consumption. But AI potentially breaks that relationship. If technology increasingly replaces human labor, then economic growth can continue—even accelerate—while the economic value of human labor declines, perhaps dramatically.

So I’m not sure the future necessarily looks like “degrowth.” It may be something stranger: exponential technological growth occurring alongside declining human labor demand, an aging population in the developed regions of the world, and potentially declining population worldwide.

That raises a much bigger question: if human labor is no longer the primary engine of economic value, what exactly are we trying to maximize—and how should the economy distribute the benefits of that productivity?

That’s the economic model I’m wrestling with right now.

Question:

What about lands and waters in these considerations?

Can we agree that what we need must be either mined or grown?

Raw materials come from somewhere with significant externalities — often left out of economic theory.

My other issue is the assumptive ghost of interest-bearing-debt as a driver of unnecessary growth.

Reply:

Yes—and I think land, water, and raw materials have to be part of the model. My initial modeling, however, is pointing toward a very different problem than the one we traditionally assume.

If AI continues improving itself, productivity could eventually become extraordinarily resource-efficient. Very little additional human labor—and potentially much less land, water, or energy per unit of economic output—may be required for productivity and growth. At the same time, consumers could be forced to consume much less because their income from labor is declining. And as solar and other clean-energy technologies continue becoming cheaper, the pressure for some forms of mining and extraction could decline as well.

That brings me back to your point about interest-bearing debt. I think sovereign debt may become the critical part of the equation.

Productivity gains and abundant cheap clean energy are profoundly deflationary. Deflation sounds wonderful for consumers in theory—but not if it is accompanied by collapsing labor income. You could have falling costs and prices while households simultaneously lose the purchasing power needed to buy anything.

Now add governments facing enormous debt obligations while their traditional tax base is shrinking because human labor is becoming less economically valuable. Governments could increasingly rely on interest-bearing debt to finance poverty reduction, redistribution, and some form of basic income.

And that creates a potentially nasty feedback loop: AI-driven productivity → declining labor income → shrinking tax base → rising sovereign debt → greater reliance on monetary expansion → inflationary pressure.

Historically, severe sovereign debt problems have sometimes been resolved through substantial currency devaluation and inflation. I’m not saying hyperinflation is inevitable—but it is one of the risks I’m now modeling.

The really strange possibility is that we could simultaneously have exponential productivity, increasingly abundant cheap energy, falling costs of production—and increasing economic hardship for ordinary people.

In other words, the problem may not ultimately be whether the planet can produce enough. It may be whether humans can maintain enough income, purchasing power, and economic agency to participate in the abundance that AI creates.

That, to me, is where the economic model gets really interesting.

bookmark_borderThe Future of Energy Is Not Static

By Daniel Brouse
Economist & Climatologist
Membrane Domain USA
August 10, 2026

I’m not certain what the future holds. I don’t think anyone can be.

But I’m also not convinced that the future of fossil fuels can be projected simply by looking at today’s production levels and assuming they will continue indefinitely.

There is a very real possibility that economics, energy security, technological substitution, and even economic disruption could phase out fossil fuels much faster than most people expect.

In fact, some of the data already point in that direction.

The Energy Transition Is Already Moving

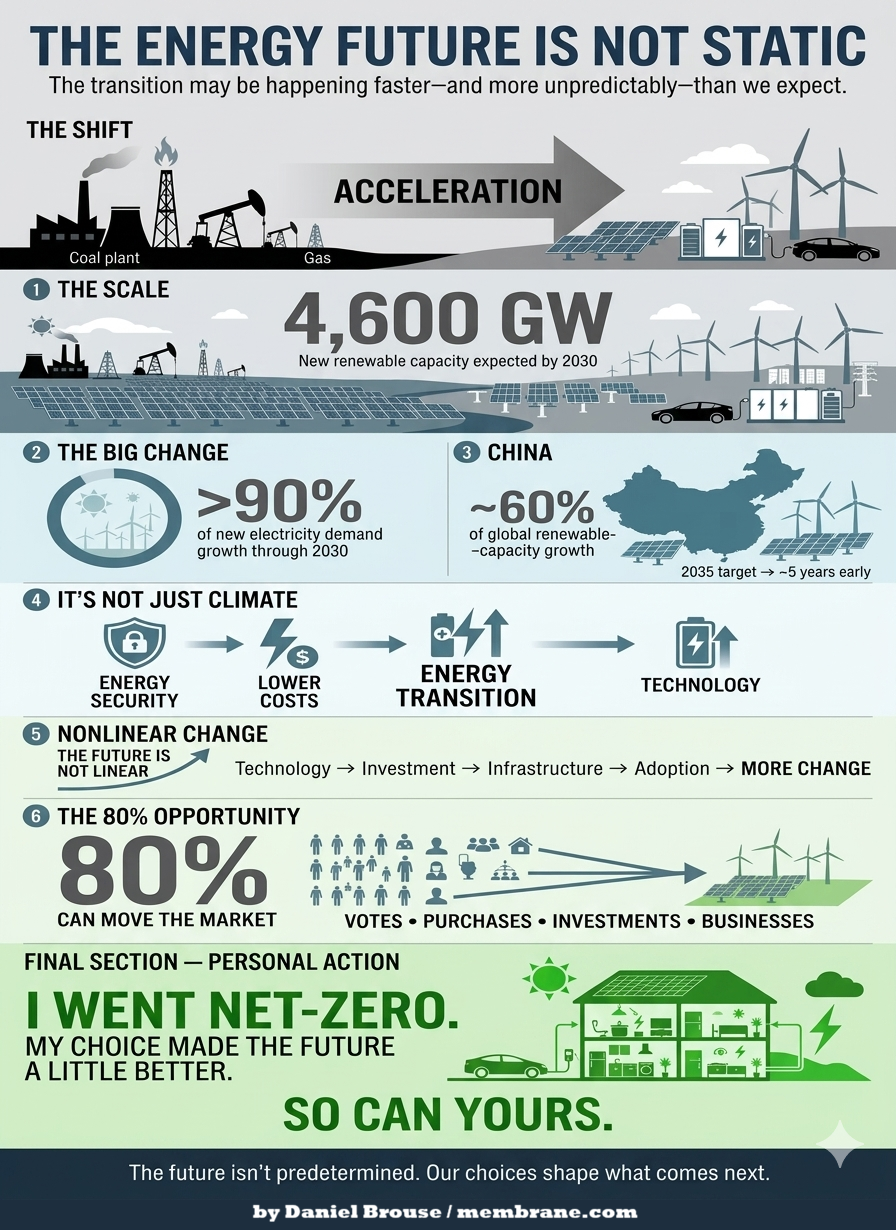
The International Energy Agency estimates that global renewable capacity will increase by roughly 4,600 GW between 2025 and 2030—an extraordinary expansion roughly equivalent to the combined current power capacity of China, the European Union, and Japan.

Solar PV is expected to account for almost 80% of that expansion.

Even more significant is what this means for the growth of electricity demand. Renewables are expected to provide more than 90% of the increase in global electricity generation through 2030.

This is not simply a distant prediction about some hypothetical future energy system. It represents an enormous investment already underway.

And the transition is happening particularly rapidly in China.

China is now responsible for nearly 60% of global renewable-capacity growth. In 2025 alone, it added roughly 314 GW of solar capacity and is on track to reach its 2035 wind-and-solar target approximately five years early.

Whatever one’s views on climate policy, these numbers are difficult to dismiss.

The global energy system is changing.

And it is changing rapidly.

This Isn’t Just About Climate Policy

There is another factor that deserves considerably more attention: energy security.

The transition away from fossil fuels is not being driven exclusively by environmental concerns. Increasingly, it is also becoming an economic and strategic imperative.

The disruption of oil and gas flows through critical transportation routes such as the Strait of Hormuz demonstrates the vulnerability inherent in an energy system dependent upon globally traded fossil fuels.

For Europe and Asia in particular, domestic renewable generation, energy storage, electrification, and efficiency increasingly represent something more than climate policy.

They are energy-security assets.

A solar panel or wind turbine doesn’t need to be transported through a geopolitical chokepoint every time it generates electricity. Once installed, domestic renewable resources can reduce exposure to international fuel-price shocks, supply disruptions, and geopolitical conflicts.

That changes the economic calculation.

And it is one reason I believe the energy transition may prove considerably more nonlinear than many conventional forecasts assume.

The Future May Be Nonlinear

I agree that we shouldn’t pretend we know exactly what the future holds.

My point is almost the opposite.

The future may be much more nonlinear than either of us can confidently predict.

Technologies don’t necessarily replace one another gradually. Once a technology becomes sufficiently cheap, reliable, scalable, and convenient, adoption can accelerate rapidly.

The same thing can happen with infrastructure.

Battery storage becomes cheaper. Electric vehicles become more capable. Solar becomes less expensive. Transmission improves. Heat pumps become more efficient. Businesses discover that electrification can reduce operating costs. Consumers begin choosing technologies that save them money.

Each development can reinforce the others.

And once enough pieces of the system change, the economics of the entire energy system can change with them.

This is why simply extrapolating today’s fossil-fuel production into the future can be misleading.

Could “Drill, Baby, Drill” Backfire?

There is an irony here.

Policies intended to expand U.S. fossil-fuel production could potentially accelerate the transition they are intended to slow if they contribute to greater volatility, geopolitical exposure, or investment in alternatives.

Consider what could happen during a serious economic downturn.

A major recession could cause substantial demand destruction. Businesses would consume less energy. Consumers would drive less and purchase fewer goods. Industrial production would decline.

Fossil-fuel consumption could fall sharply.

That would potentially undermine the very industry that policies designed around expanding fossil-fuel production are intended to strengthen.

There is no guarantee this will happen. But that’s precisely the point.

The future contains feedback loops.

Economic conditions affect energy demand. Energy prices affect technology adoption. Technology affects investment. Investment affects infrastructure. Infrastructure affects energy prices and security. Geopolitical events affect all of them.

The result is a system capable of changing much faster than a simple linear projection would suggest.

This Isn’t an All-or-Nothing Choice

I’m not trying to create another online debate.

I’m simply pointing out that the data show a transition already underway—and its speed is anything but static.

And perhaps the most important point is that this isn’t an all-or-nothing proposition.

Every increment of transition matters.

Every electric vehicle displaces some gasoline consumption. Every solar panel replaces some electricity that otherwise might have come from fossil fuels. Every efficiency improvement reduces energy demand. Every battery installation makes intermittent renewable energy more useful. Every business that electrifies reduces some exposure to fossil-fuel prices.

The more we transition, the more reasonable—and manageable—the future becomes.

We don’t need to transform the entire energy system overnight.

We need to keep moving.

Technology Is Changing More Than Energy

There is another reason I remain optimistic.

Ironically, AI and rapidly advancing technology are accelerating climate science at a pace that may eventually rival the acceleration of climate change itself.

Research that once took years can increasingly be explored in hours.

Large datasets can be analyzed in ways that weren’t previously practical. Relationships between variables can be identified more quickly. Models can be tested, refined, and compared at extraordinary speed.

I’ve been able to identify hundreds of interacting feedbacks and relationships that weren’t even being seriously considered just a few years ago.

That doesn’t mean every hypothesis will be correct.

It means our ability to investigate complex systems is expanding extraordinarily quickly.

And that gives me reason for optimism.

Humans have an extraordinary capacity to adapt, innovate, and solve difficult problems—especially when we are sufficiently motivated to do so.

The future is not predetermined.

What we do now can still make an enormous difference in what comes next.

The 80% Question

A final thought concerns something that initially struck me as particularly concerning.

Roughly 20% of Americans appear to be actively fighting the energy transition.

At first, I found that almost dumbfounding. I expected the number to be closer to less than 2%.

But there is another way to look at it.

That still leaves roughly 80% of the population.

And if that 80% chooses to act—through voting, investment, purchasing decisions, business decisions, and simply choosing where to spend their dollars—the market can move remarkably quickly.

We don’t necessarily have to fight the remaining 20%.

We can vote with our dollars.

Markets respond to demand.

If enough consumers and businesses choose alternatives, capital will follow. Manufacturers will respond. Infrastructure will change. Companies will adapt.

And eventually, the fossil-fuel industry will have to adapt as well—or gradually lose market share.

That is the power of an energy transition driven not only by government policy, but by millions of individual economic decisions.

My Choice. Your Choice. Our Future.

I went net-zero years ago.

If I can do it, anybody can.

I don’t claim that my individual decision changed the world.

But my choice made the future a little better than it otherwise would have been.

And so can yours.

The future of energy isn’t predetermined by today’s production numbers, today’s political battles, or today’s assumptions.

It will be shaped by billions of decisions made by consumers, businesses, investors, engineers, scientists, and governments.

Some of those decisions will be political.

Many will be economic.

Some will be technological.

And countless others will be personal.

That’s why I don’t think the question is whether we can predict exactly what the energy system will look like in 10, 20, or 30 years.

We can’t.

The more important question is:

What direction are we moving—and how much can our choices influence where we ultimately arrive?

The transition is already underway.

Its speed is accelerating.

And the future is still ours to shape.

bookmark_borderScience Is Science: Confronting Denialism and Ecofascism

About Denialism and Ecofascism: Science Is Science

The Observation
Glad to know you’re watching out! At the same time, this divisiveness—when we desperately need everyone to pull together because it’s a CRISIS, right?—makes me somehow deeply sad.

That’s a big job right there… How do we reach those who seem furthest away from any kind of understanding? We need both a Winston Churchill and a Mahatma Gandhi in this endeavor…

The Response
Agreed. Both denialism and ecofascism are ideologies that ultimately defy logic. In very different ways, they can become a kind of combination of self-destruction and destruction of others.

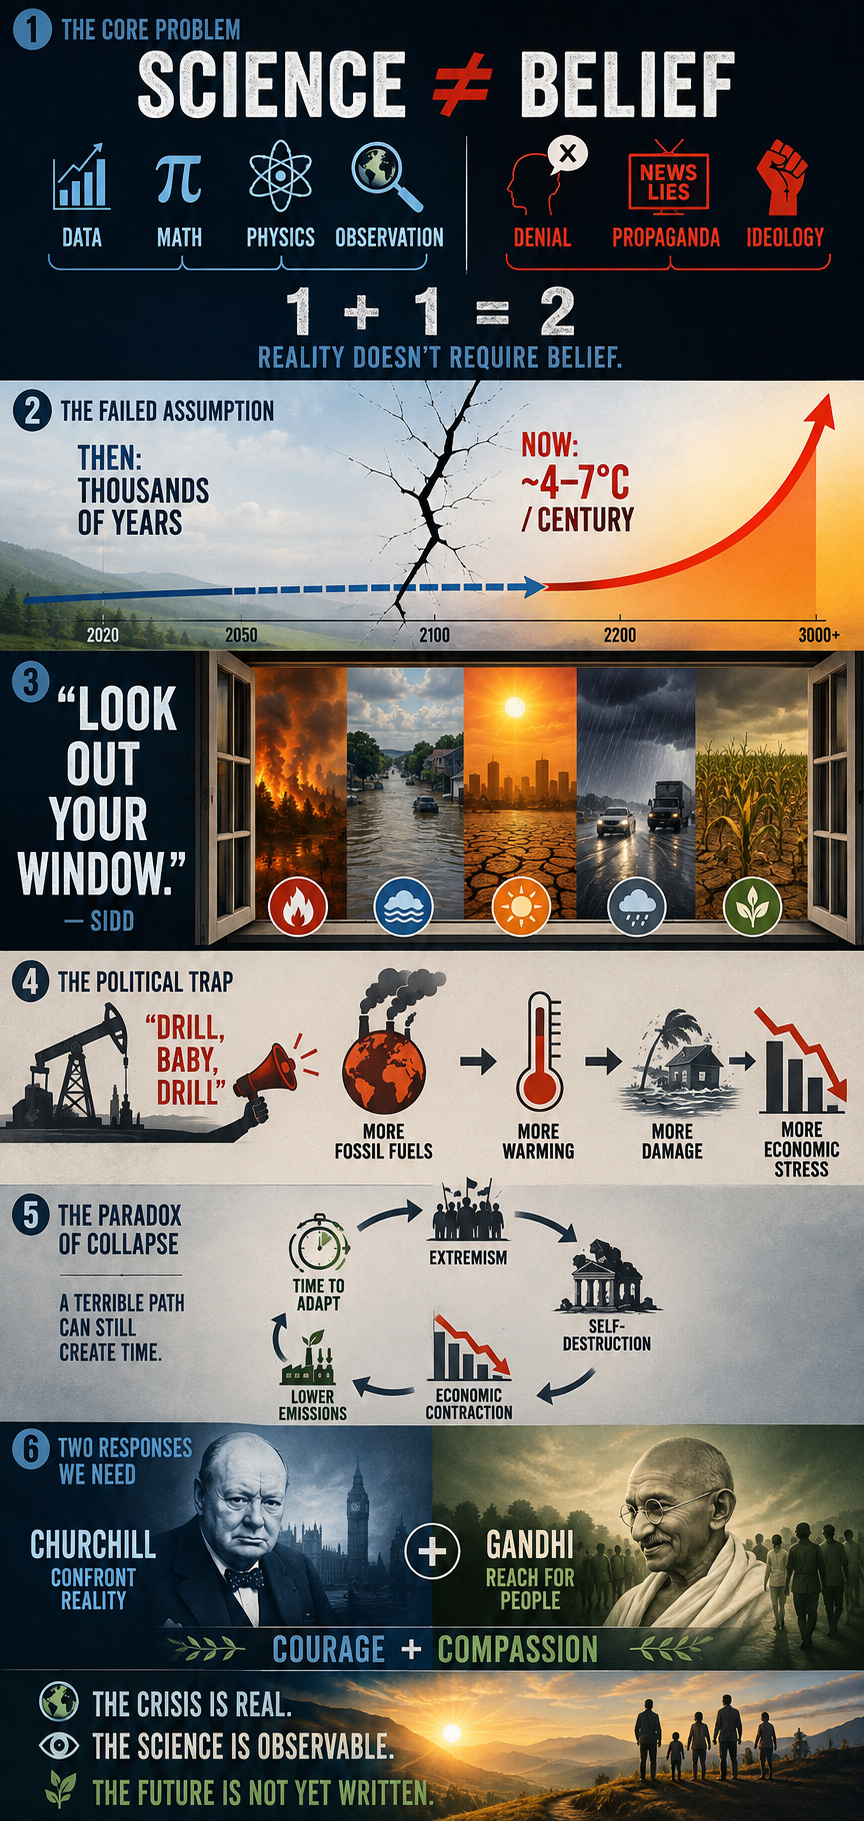
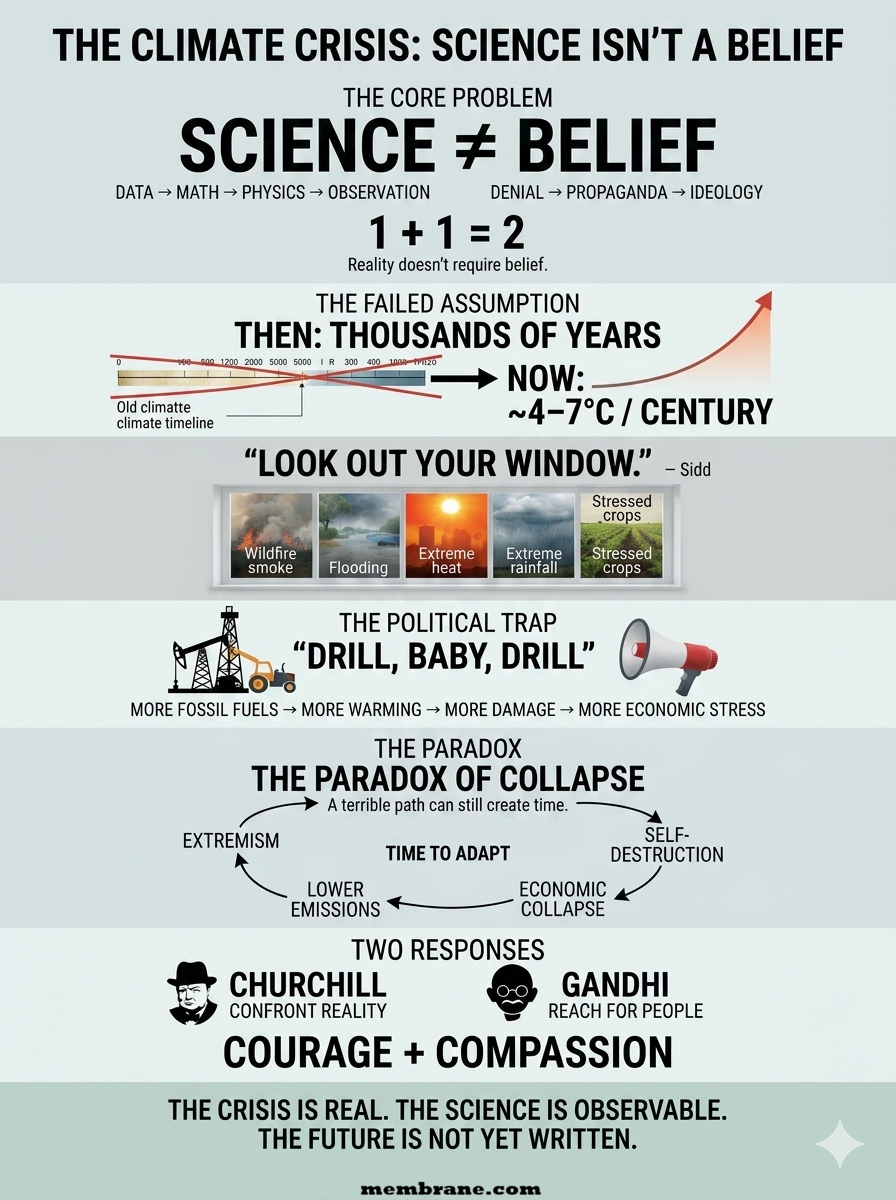
I’ve spent years battling misinformation, propaganda, and rhetoric. To the best of my knowledge, neither Sidd nor I have successfully converted—or even educated—a single committed denier. Climate science has somehow been transformed into a “belief” system. But science has nothing to do with belief. 1 + 1 = 2. If someone refuses to “believe” that, what exactly can you do?

From the beginning, our work has been based on observations, data, mathematics, and the laws of physics. So yes, I think this is at the heart of the crisis. When we started this work, we genuinely believed humanity would eventually take action. We thought we had thousands, if not tens of thousands, of years to adapt. That was the one thing we got wrong.

A couple of years ago, after explaining my continuing attempts to reach climate deniers, I asked Sidd what we could possibly do. His response was essentially, “Dude, just tell them to look out their window.” It sounds simplistic, but there is profound truth in it. The consequences are becoming increasingly difficult to deny.

Since then, we’ve had to rebuild much of our modeling. A +4°C world within thousands of years is no longer the worst-case scenario we worry about. The possibility of 4–7°C of warming within a century has become a much more serious concern in our work.

And then there is the political dimension. The rise of white-nationalist and authoritarian governments in the U.S. and elsewhere has made an already difficult problem considerably harder. Paradoxically, though, history offers one small reason for hope: fascism ultimately fails. It is inherently self-destructive.

The “drill, baby, drill” mentality is economically and environmentally self-defeating. A severe economic contraction could, ironically, buy humanity some time for adaptation while drastically reducing emissions. That is hardly the future anyone should want, but history has repeatedly demonstrated that systems built on extremism and authoritarianism eventually consume themselves.

So yes—we desperately need both the Churchill and Gandhi dimensions: the willingness to confront reality without flinching, and the willingness to keep reaching for people rather than giving up on them. I’m just not sure humanity has ever faced a crisis where we needed both quite this badly.

bookmark_borderStrategic Petroleum Reserve Falls to Lowest Level Since 1983

As of July 31, 2026, the U.S. Strategic Petroleum Reserve (SPR) held approximately 304.8 million barrels of crude oil, its lowest level since March 1983.

From its historic peak of roughly 726 million barrels in 2009, the SPR has experienced a cumulative drawdown of approximately 421 million barrels—about a 58% reduction. The decline has been driven primarily by major emergency releases following Russia’s 2022 invasion of Ukraine and subsequent supply disruptions associated with instability in the Middle East in 2026.

The U.S. Energy Information Administration (EIA) estimates that the reserve could eventually fall to approximately 243 million barrels as currently authorized emergency release schedules conclude.

Strategic Risk: Erosion of U.S. Energy Security

The primary risk of reducing the SPR to approximately 243 million barrels is a severe loss of national energy security and geopolitical leverage during a major global crisis.

At that level—near the lowest inventory in more than four decades—the United States would have substantially less capacity to respond to an extended disruption in global oil supplies. A depleted reserve could also reduce the credibility and effectiveness of the SPR as a deterrent against supply shocks, geopolitical coercion, or major disruptions to global petroleum markets.

Structural and Infrastructure Risks

Cavern Structural Integrity

The SPR is stored in underground salt caverns that require careful management of pressure, oil levels, and cavern conditions. Repeatedly moving crude oil and fresh water into and out of these caverns can alter the physical characteristics of the salt formations and potentially increase operational and structural risks.

Maintaining the integrity of the caverns becomes increasingly important as the reserve is drawn down because the SPR’s ability to rapidly refill or sustain emergency withdrawals depends on the continued reliability of this underground storage infrastructure.

International Energy Agency Compliance

A substantially reduced SPR could also complicate U.S. compliance with International Energy Agency (IEA) emergency-stockholding requirements.

IEA member countries are generally required to maintain emergency oil stocks equivalent to at least 90 days of net oil imports. The relevant measure, however, is based on a country’s total qualifying emergency stocks—not simply the number of barrels held in the SPR. Therefore, the U.S. position must be evaluated using the full national stockholding calculation, including other qualifying inventories.

The Strategic Concern

The SPR was designed as a national insurance policy against severe and prolonged disruptions in petroleum supplies. Reducing the reserve by more than half from its 2009 peak fundamentally changes the country’s ability to absorb a major energy shock.

If inventories approach 243 million barrels, the United States would enter a period in which rebuilding the reserve could become increasingly important but potentially difficult. Large-scale purchases to replenish the SPR would require substantial funding, available crude supplies, suitable market conditions, and sufficient time.

The central strategic issue is therefore not simply how many barrels remain, but whether the United States retains enough readily deployable petroleum reserves to withstand a prolonged global supply disruption while simultaneously preserving the infrastructure, flexibility, and geopolitical leverage needed to respond to the next crisis.

bookmark_borderThe Two Sides of the Climate Crisis: Consumption and Production

by Daniel Brouse

Climate change is often discussed as a problem of emissions, but emissions are the result of two interconnected forces: consumption and production.

Q: What are the greatest drivers of climate change?
A: Consumption and production.

At present, I would rank our addiction to consumption and ecofascism as the two most significant drivers of the climate crisis. While they operate in different ways, both reinforce the systems that accelerate environmental degradation.

The Consumption Problem

The United States, Western Europe, Canada, and Australia represent some of the world’s most consumption-driven economies. When self-interest, materialism, and short-term economic incentives dominate decision-making, consumer demand becomes one of the primary drivers of climate change, influencing not only greenhouse gas emissions but also land-use change, deforestation, habitat destruction, water consumption, resource depletion, and biodiversity loss.

This is why consumption-based accounting provides a more accurate picture of climate responsibility than production-based accounting alone.

For example, if a smartphone is manufactured in Asia using coal-generated electricity and then shipped across the Pacific to a consumer in Los Angeles, the emissions from mining, manufacturing, transportation, and delivery are ultimately driven by the purchasing decision. Under consumption-based accounting, those emissions are attributed to the American consumer rather than solely to the country where the phone was manufactured.

Read the full explanation and view the rankings here:

http://membrane.com/global_warming/Accounting-for-Climate-Responsibility.html#the-carbon-we-own

The Production Problem

The production side of the equation is likewise influenced by self-interest and economic incentives, but it is also shaped by ideological movements that obstruct effective climate action.

Two distinct, though sometimes overlapping, ideologies are particularly important:

Denialism is characterized by the rejection of scientific evidence, refusal to engage with empirical data, and reliance on misinformation or rhetorical distraction. Its primary objective is often the protection of political, ideological, or economic interests by undermining the scientific consensus.

Ecofascism combines elements of denialism with authoritarian, exclusionary, or extremist beliefs. In its most extreme forms, it portrays environmental collapse as acceptable—or even desirable—because it is viewed as reducing populations or preserving resources for groups considered more deserving than others. This ideology has historically been associated with racist, xenophobic, or eugenicist beliefs and rejects principles of equality and shared human responsibility.

The distinction is important. Traditional denialism primarily seeks to delay or prevent climate policy. Ecofascism goes further by framing unequal human survival as an acceptable or even desirable outcome — eliminationist logic.

Why This Matters

Climate change is not simply a technological or economic challenge. It is also a question of values.

On one side, excessive consumption drives demand for fossil fuels, resource extraction, and emissions. On the other, ideologies that reject science or rationalize unequal human suffering weaken society’s ability to respond effectively to the crisis.

Both sides must be addressed if meaningful progress is to be made.

Further Reading

While investigating climate change denialism, I examined material that I believe illustrates the intersection between denialist narratives and extremist environmental ideologies. A summary of that research is available here:

http://membrane.com/global_warming/Ecofascism-and-Denialism-101.html

bookmark_borderThe States with the Biggest Climate Footprints Aren’t the Ones You Think

by Daniel Brouse

When most people think about greenhouse gas emissions, they picture sprawling cities, crowded highways, and millions of people flipping on lights and air conditioners. It’s no surprise, then, that states like California, Texas, Florida, and New York usually dominate lists of greenhouse gas emissions. But those rankings tell only part of the story.

What if the question isn’t simply “Which states emit the most greenhouse gases?” What if it’s “Which states are most responsible for producing the fossil fuels that drive climate change?”

The answer looks dramatically different.

Beyond Smokestacks and Tailpipes

Traditional greenhouse gas inventories are based on territorial emissions—the emissions that physically occur within a state’s borders. That includes electricity generation, transportation, manufacturing, agriculture, and buildings.

This accounting system is useful, but it overlooks much of the climate impact associated with fossil fuel production.

Before a gallon of gasoline reaches your car or natural gas heats your home, fossil fuels must be:

  • explored,
  • extracted,
  • processed,
  • transported,
  • refined,
  • and stored.

Each of these steps releases greenhouse gases. Oil wells leak methane. Coal mines vent methane. Natural gas fields flare excess gas. Refineries consume enormous amounts of energy. LNG export terminals require massive refrigeration systems. Petrochemical plants emit carbon dioxide while transforming hydrocarbons into fuels and plastics.

These emissions are real. Yet many are only partially reflected—or entirely absent—from conventional state comparisons.

Introducing the Composite Climate Responsibility Index

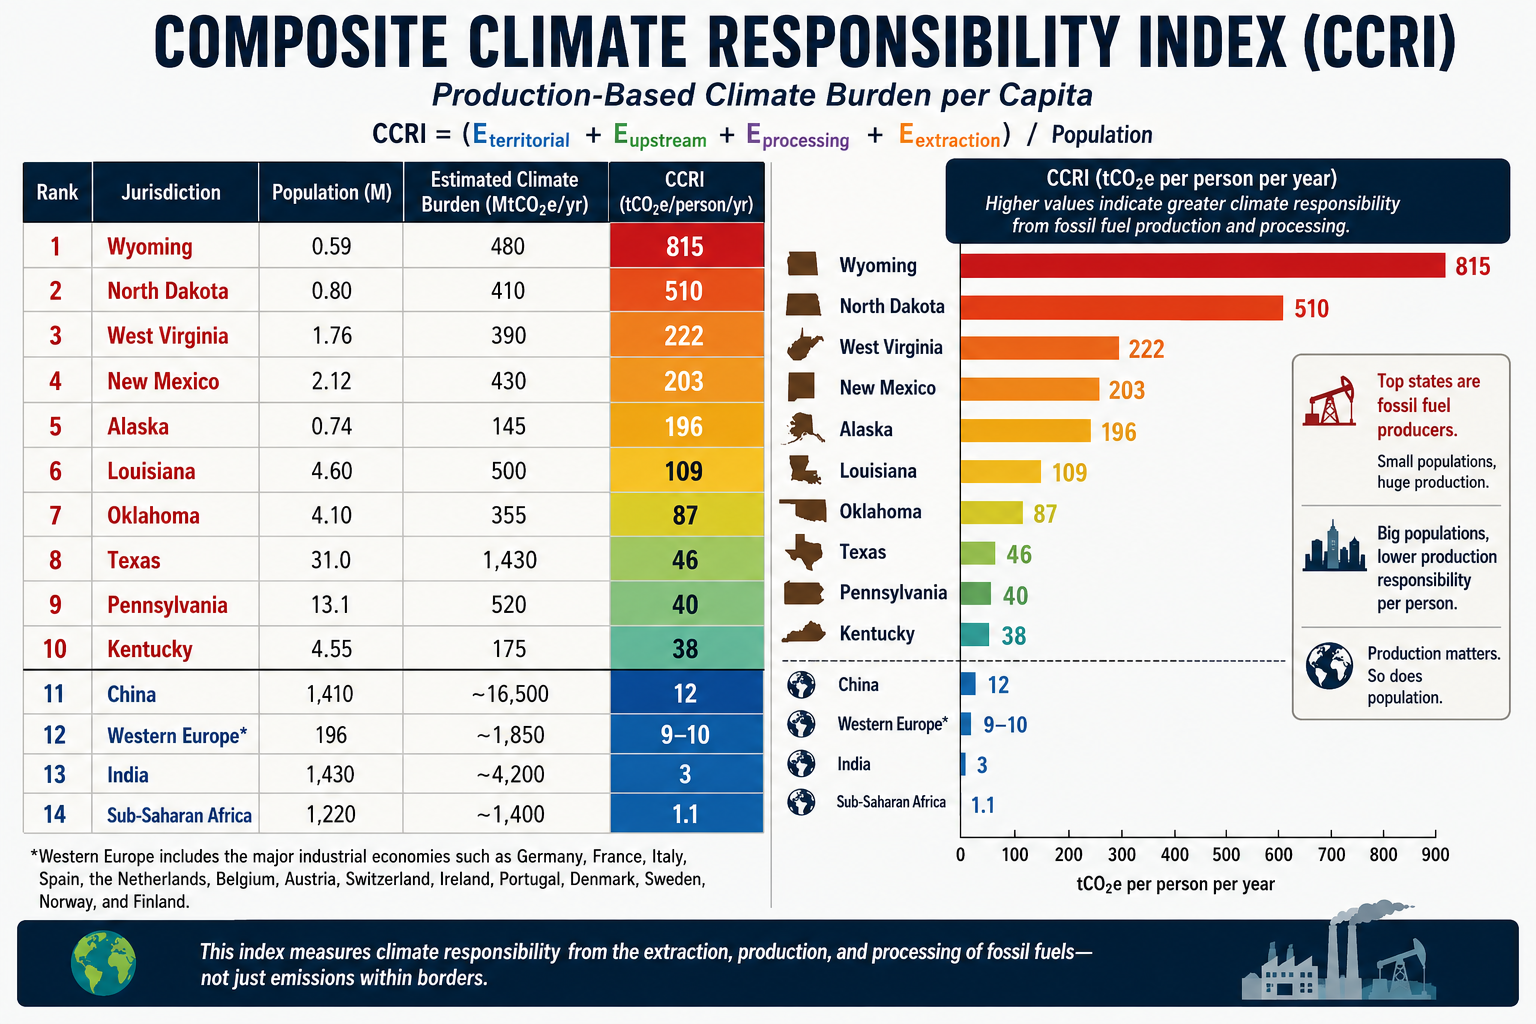
To capture the full climate burden of fossil fuel production, I developed the Composite Climate Responsibility Index (CCRI).

Rather than looking only at emissions released within a state’s borders, CCRI combines four major components:

  • Territorial emissions – direct greenhouse gas emissions occurring within the state.
  • Upstream emissions – methane leakage, venting, flaring, and other fugitive releases.
  • Processing emissions – petroleum refining, LNG facilities, natural gas processing, and petrochemical manufacturing.
  • Extraction emissions – emissions associated with coal mining, oil production, drilling, hydraulic fracturing, and natural gas extraction.

The combined total is then divided by the state’s population to produce a per-capita measure of climate responsibility.

This approach shifts the focus from where emissions occur to where the fossil fuel system originates.

A Completely Different Ranking

Applying this framework produces a ranking that bears little resemblance to traditional greenhouse gas inventories.

Instead of being dominated by the largest population centers, the states with the highest per-capita climate responsibility are overwhelmingly those that produce fossil fuels.

Top Ten States by Composite Climate Responsibility

  1. Wyoming
  2. North Dakota
  3. West Virginia
  4. New Mexico
  5. Louisiana
  6. Alaska
  7. Oklahoma
  8. Texas
  9. Pennsylvania
  10. Kentucky

Notice who’s missing.

California, Florida, New York, New Jersey, Massachusetts, and Washington—all states commonly associated with high emissions because of their large populations—drop dramatically in the rankings.

Instead, relatively small states become climate heavyweights because they extract, refine, process, or export enormous quantities of fossil fuels.

Wyoming: A Climate Giant with Half a Million People

Wyoming is home to fewer than 600,000 residents, yet it produces more coal than any other state and remains a major producer of natural gas.

Under conventional accounting, Wyoming appears to have modest total emissions simply because so few people live there.

But when coal mining, methane releases, and extraction activities are included, Wyoming’s per-capita climate burden becomes extraordinary.

Its climate footprint is measured not by how many people live there, but by how much carbon leaves the state embedded in coal, oil, and natural gas.

Texas: The Carbon Superpower

Texas remains in a category of its own.

No other state combines:

  • the nation’s largest oil production,
  • the largest natural gas production,
  • the largest refining capacity,
  • one of the world’s largest petrochemical industries,
  • extensive LNG export facilities,
  • and the highest total greenhouse gas emissions.

Its enormous population moderates its per-capita ranking, but Texas still lands in the top ten because the scale of its fossil fuel industry is unmatched.

In absolute terms, Texas likely contributes more lifecycle greenhouse gas emissions than any other U.S. state.

Methane Changes Everything

One of the largest differences between CCRI and conventional inventories is methane.

Natural gas has often been marketed as a “cleaner” fossil fuel because it emits less carbon dioxide when burned than coal.

However, methane itself is a potent greenhouse gas. Even relatively small leaks during drilling, gathering, processing, and transportation can substantially increase the climate impact of natural gas production.

States with large oil and gas industries—such as New Mexico, North Dakota, Pennsylvania, Oklahoma, and Louisiana—move sharply upward once methane leakage, venting, and flaring are included.

Ignoring upstream methane is like calculating the cost of owning a car while pretending gasoline is free.

Production Matters

The key insight of CCRI is that climate responsibility does not end where emissions occur.

A barrel of oil extracted in North Dakota may be refined in Louisiana, transported through Texas, shipped overseas, and ultimately burned in Europe or Asia.

Each step adds greenhouse gases.

Traditional inventories divide these emissions among multiple jurisdictions, often obscuring the role of the states that initiated the fossil fuel supply chain.

CCRI reconnects those pieces.

It recognizes that extraction, processing, and upstream emissions are not incidental—they are essential components of fossil fuel production.

A More Complete Picture

The Composite Climate Responsibility Index is not intended to replace traditional greenhouse gas inventories. Those inventories remain indispensable for tracking progress toward emissions reduction within individual states.

Instead, CCRI complements existing accounting by expanding the system boundary to include the activities that make fossil fuel consumption possible.

This broader perspective helps answer questions that territorial inventories cannot:

  • Which states produce the largest share of climate-forcing emissions?
  • Where would methane reductions have the greatest impact?
  • Which regions contribute disproportionately to fossil fuel supply?
  • How should climate responsibility be allocated in a production-based economy?

By incorporating extraction, processing, upstream methane, and direct emissions into a single per-capita metric, CCRI reveals a reality that traditional rankings often miss: the states producing the fuels that power the global economy are frequently those carrying the largest climate responsibility—even when their populations are relatively small.

In the coming years, as policymakers increasingly focus on lifecycle emissions, methane mitigation, and supply-side climate policy, production-based metrics such as CCRI may prove to be as important as the territorial inventories that have guided climate reporting for decades.

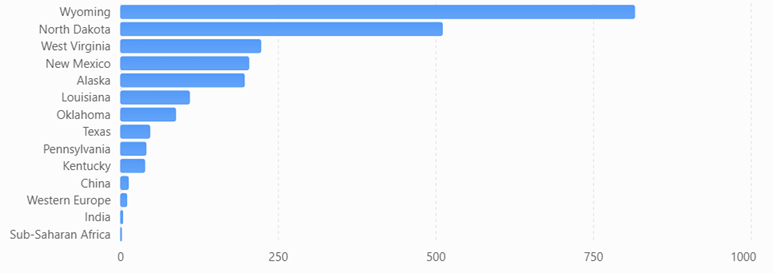
Global Comparison

A comparison becomes especially revealing when the same production-based accounting is applied to both U.S. states and world regions. Instead of asking who burns the carbon, the CCRI asks who produces and enables the fossil carbon economy.

The formula remains:CCRI=Eterritorial+Eupstream+Eprocessing+EextractionPCCRI=\frac{E_{territorial}+E_{upstream}+E_{processing}+E_{extraction}}{P}CCRI=PEterritorial​+Eupstream​+Eprocessing​+Eextraction​​

Using this methodology, the comparison changes dramatically from conventional per-capita emissions rankings.

Estimated Composite Climate Responsibility

RankJurisdictionPopulation (M)Estimated Climate Burden (MtCO₂e/yr)CCRI (tCO₂e/person/yr)
1Wyoming0.59480815
2North Dakota0.80410510
3West Virginia1.76390222
4New Mexico2.12430203
5Alaska0.74145196
6Louisiana4.60500109
7Oklahoma4.1035587
8Texas31.01,43046
9Pennsylvania13.152040
10Kentucky4.5517538
11China1,410~16,500≈12
12Western Europe*196~1,850≈9–10
13India1,430~4,200≈3
14Sub-Saharan Africa1,220~1,400≈1.1

*Western Europe includes the major industrial economies such as Germany, France, Italy, Spain, the Netherlands, Belgium, Austria, Switzerland, Ireland, Portugal, Denmark, Sweden, Norway, and Finland.

Composite Climate Responsibility Index (CCRI)

Estimated production-based climate burden per capita using territorial emissions, extraction, processing, and upstream emissions.

What the comparison shows

Several important conclusions emerge.

First, fossil fuel production is far more geographically concentrated than fossil fuel consumption. Wyoming’s estimated production-based climate burden is roughly 68 times higher per resident than China’s, despite China’s position as the world’s largest emitter under conventional territorial accounting. The difference reflects Wyoming’s role as a major coal and natural gas producer serving markets far beyond its borders.

Second, China’s ranking changes substantially under the CCRI framework. China remains a major contributor because of its large coal industry, extensive refining capacity, and industrial base, but its enormous population reduces its per-capita production burden to around 12 tCO₂e per person, well below several U.S. fossil-fuel-producing states.

Third, Western Europe falls even lower. While it retains significant refining and industrial capacity, domestic fossil fuel extraction has declined over several decades. Much of its energy is imported, so a production-based metric attributes a smaller share of upstream responsibility than a consumption-based metric would.

Fourth, India and Sub-Saharan Africa rank near the bottom. Although both regions have growing energy demand, their per-capita fossil fuel production and associated upstream emissions remain comparatively low. Their climate burden is driven primarily by domestic energy use rather than large-scale extraction and export industries.

A different perspective on climate responsibility

Traditional greenhouse gas inventories emphasize where emissions occur. The CCRI instead emphasizes where the fossil fuel supply chain begins. These are complementary perspectives, each useful for different policy questions.

  • Territorial inventories help governments manage emissions within their borders.
  • Consumption-based inventories assign responsibility to the end user of goods and energy.
  • The CCRI highlights the jurisdictions that extract, process, and prepare fossil fuels for global consumption.

Together, these three accounting systems provide a more complete understanding of climate responsibility. The comparison also illustrates that some of the world’s highest production-based climate burdens are found not in entire countries, but in a handful of resource-rich U.S. states whose fossil fuel industries serve national and international markets.

bookmark_borderAmerica’s New Tariff Landscape: Who Gets Taxed—and Who Really Pays?

Introduction

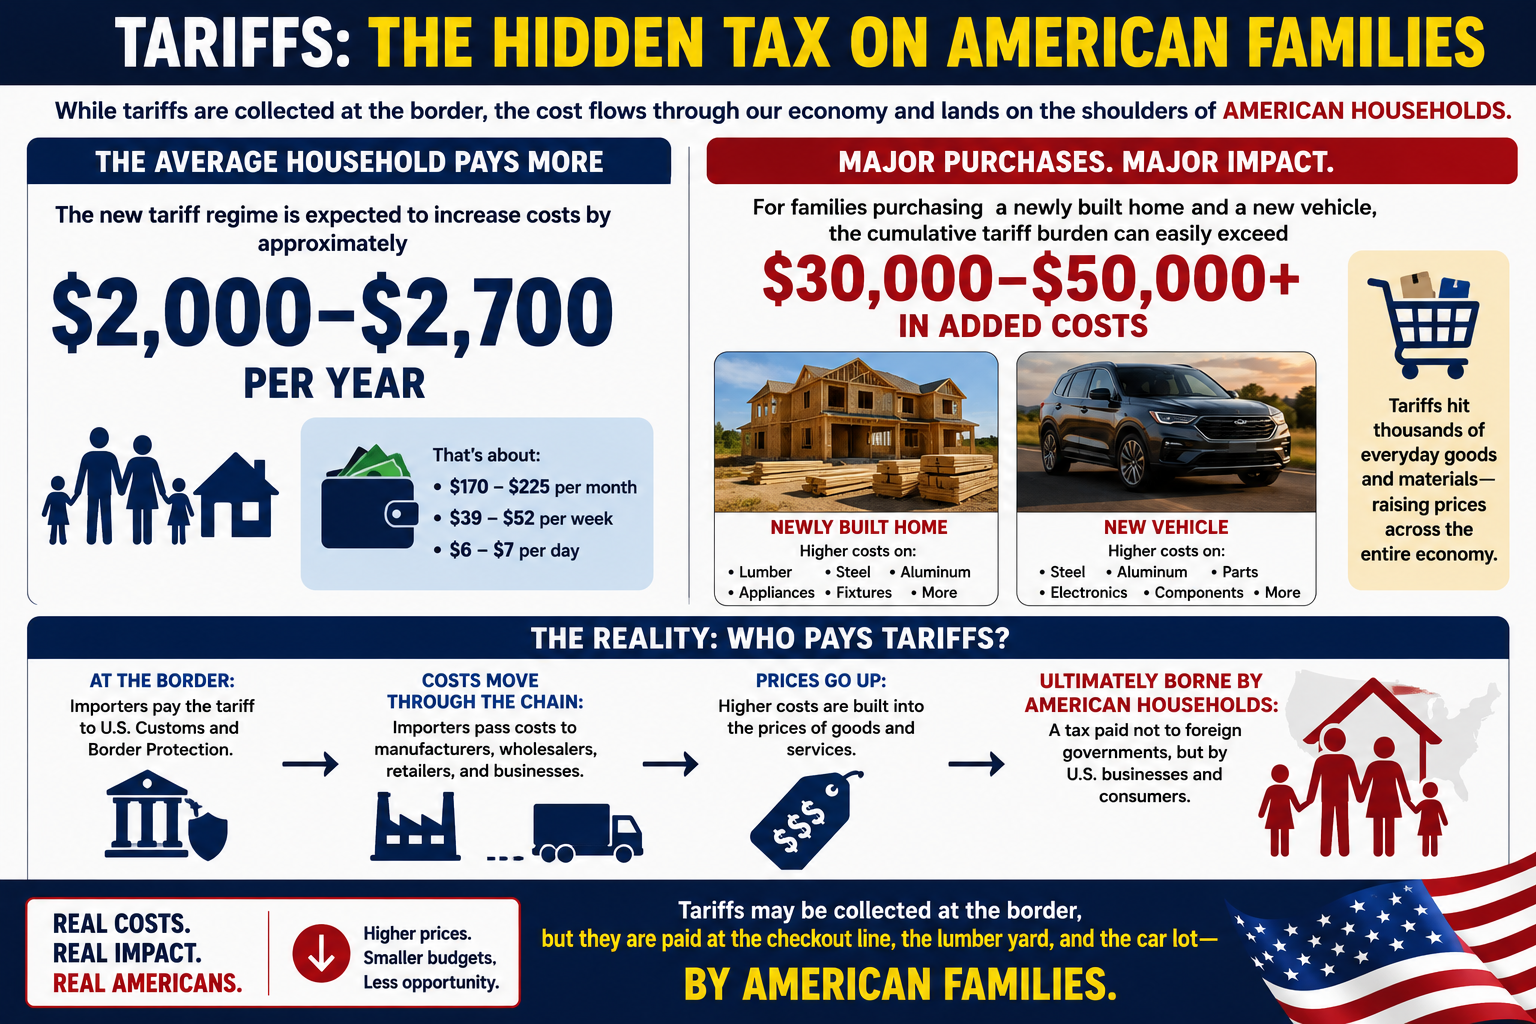
The latest U.S. tariff framework is now in place, and while tariffs are collected at the border, it’s American families who ultimately pay most of the bill.

📊 Highlights:
• Average household: +$2,000–$2,700 per year
• Buying a new home and a new car? The added cost from tariffs on steel, aluminum, lumber, vehicles, appliances, and other goods could exceed $30,000–$50,000.
• New tariffs now cover nearly 99.4% of U.S. imports from 60 trading partners, while additional 50% tariffs on many Canadian products are scheduled to begin in August.

The article explains what changed, which goods are affected, who legally pays the tariff, and who ultimately bears the economic burden.

Read the full analysis and decide for yourself: Are tariffs protecting American industry, or are they becoming one of the largest hidden taxes on American consumers?

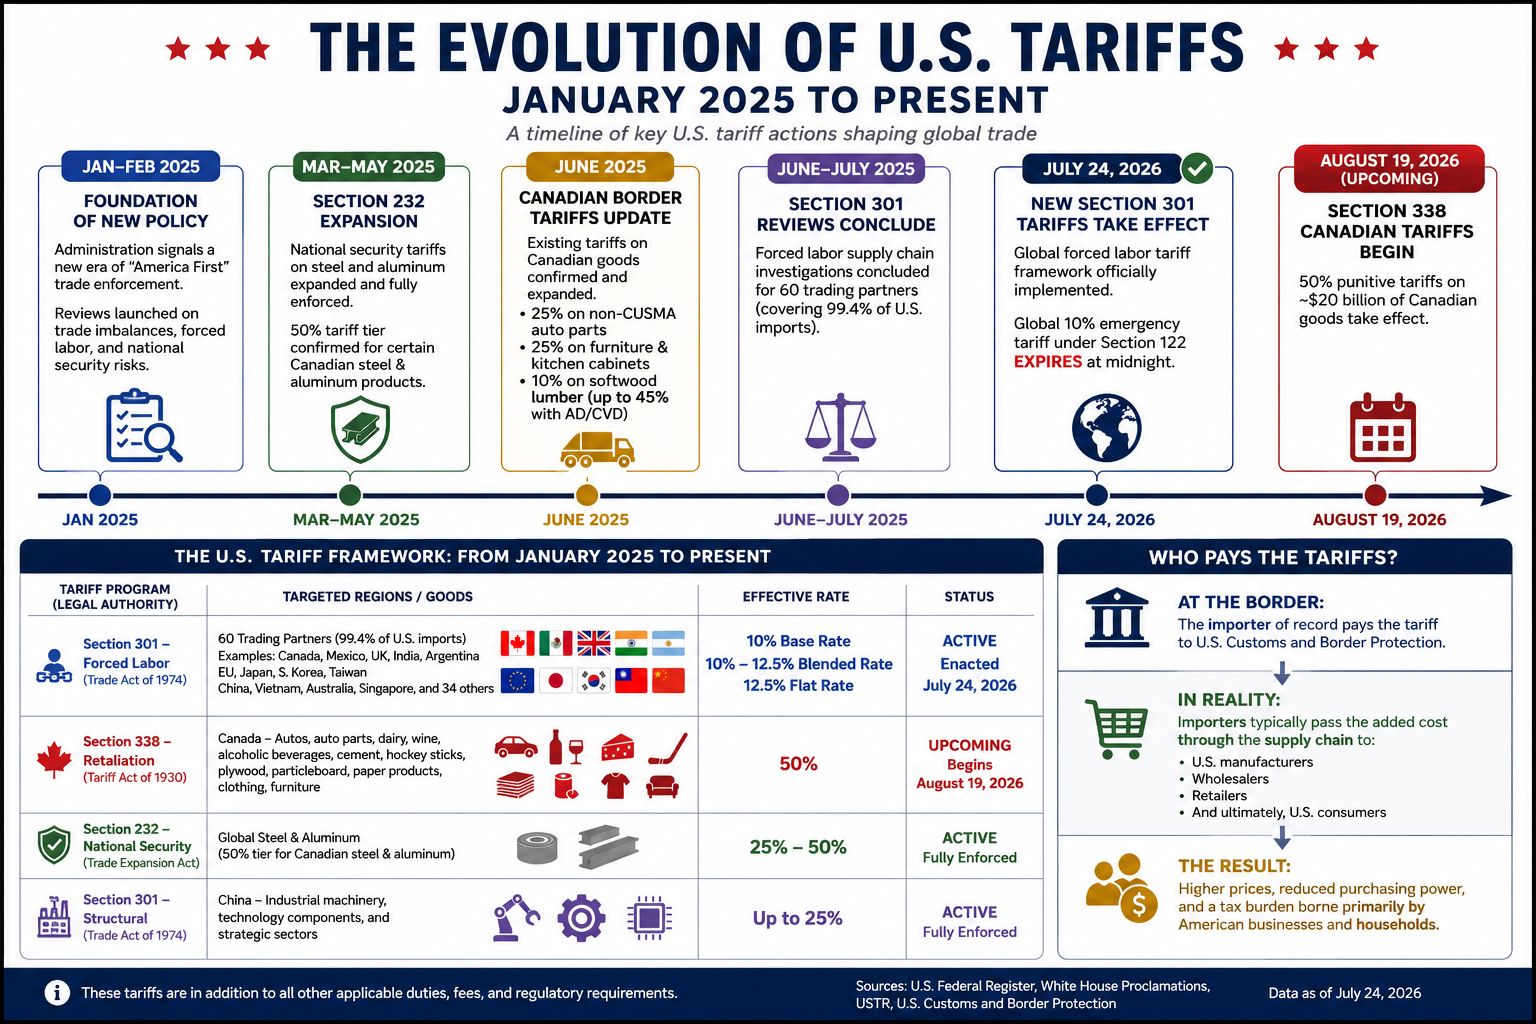
1. Newly Enacted Tariffs: Section 301 Forced Labor Framework

Effective July 24, 2026, the United States implemented a new tariff regime targeting imports from approximately 60 trading partners, representing 99.4% of all U.S. imports. The tariffs are based on supply-chain forced labor investigations.

Tariff Rates

  • 10% Base Rate
    • Canada
    • Mexico
    • United Kingdom
    • India
    • Argentina
  • 10%–12.5% Blended Rate
    • European Union
    • Japan
    • South Korea
    • Taiwan
  • 12.5% Flat Rate
    • China
    • Vietnam
    • Australia
    • Singapore
    • 34 additional economies under investigation

Exemptions

Several strategically important commodities remain exempt, including:

  • Crude oil
  • Natural gas
  • Fertilizer
  • Selected primary food products

These tariffs also do not stack with existing Section 232 national security duties.


2. Upcoming Canadian Tariffs: Section 338

Beginning August 19, 2026, the United States is scheduled to impose 50% retaliatory tariffs on approximately $20 billion of Canadian imports under Section 338 of the Tariff Act of 1930.

Products Subject to the 50% Tariff

  • Dairy products
  • Wine and other alcoholic beverages
  • Automobiles
  • Auto parts
  • Cement
  • Hockey equipment
  • Plywood
  • Particleboard
  • Paper products
  • Clothing
  • Furniture

These tariffs bypass normal CUSMA (USMCA) preferential treatment.

Exemptions

The following Canadian exports are excluded:

  • Energy products
  • Potash
  • Fish
  • Critical minerals

3. Existing Tariffs That Remain in Effect

Several major tariff programs adopted during 2025 and 2026 continue unchanged.

Section 232 National Security Tariffs

These duties continue to apply to steel and aluminum imports, including tariffs reaching 50% on certain Canadian steel and aluminum products.

Existing Canadian Import Tariffs

Additional tariffs remain in place on:

  • 25% on non-CUSMA-compliant auto parts
  • 25% on upholstered furniture and kitchen cabinets
  • 10% tariff on Canadian softwood lumber, with combined anti-dumping and countervailing duties pushing the effective rate to approximately 45%

Section 301 China Tariffs

Long-standing tariffs on Chinese imports also remain active, with rates reaching 25% on numerous products, including:

  • Industrial machinery
  • Technology equipment
  • Electronic components
  • Strategic manufacturing inputs

Current U.S. Tariff Framework

Tariff ProgramPrimary TargetRateStatus
Section 301 – Forced Labor60 trading partners10%–12.5%Active (July 24, 2026)
Section 338 – CanadaAutos, dairy, wine, cement, consumer goods50%Begins August 19, 2026
Section 232 – National SecuritySteel & aluminum25%–50%Active
Section 301 – ChinaIndustrial & technology productsUp to 25%Active

Who Really Pays Tariffs?

Legally, tariffs are paid by the U.S. importer when goods enter the country through Customs and Border Protection.

Economically, however, that is only the beginning of the story.

Importers generally recover those additional costs by increasing the prices they charge wholesalers, retailers, manufacturers, and ultimately consumers. Numerous economic studies of recent U.S. tariffs have found that most of the cost is passed through to American businesses and households rather than absorbed by foreign exporters.

In some industries, foreign suppliers may reduce prices to remain competitive, meaning they share part of the burden. But the overall trade data and pricing evidence show that the majority of tariff costs are ultimately borne within the United States through higher prices, reduced business margins, or both.

In other words, while tariffs are collected at the border from importers, they function much like a domestic consumption tax. The final bill is usually paid by American businesses and consumers—not by foreign governments.

Conclusion

For the average American household, the new tariff regime is expected to increase costs by approximately $2,000–$2,700 per year. For families purchasing a newly built home and a new vehicle, the cumulative tariff burden can easily exceed $30,000–$50,000 through higher prices on construction materials, automobiles, appliances, and other imported goods. While tariffs are collected at the border from importers, they are ultimately borne by American businesses and consumers in the form of higher prices—a tax paid not to foreign governments, but by U.S. households.

bookmark_borderOil: A Slippery Slope (Literally and Figuratively)

Oil is one of those subjects that’s surprisingly slippery—both physically and economically. Most people know prices go up and down, but few realize that even storing oil comes with limits.

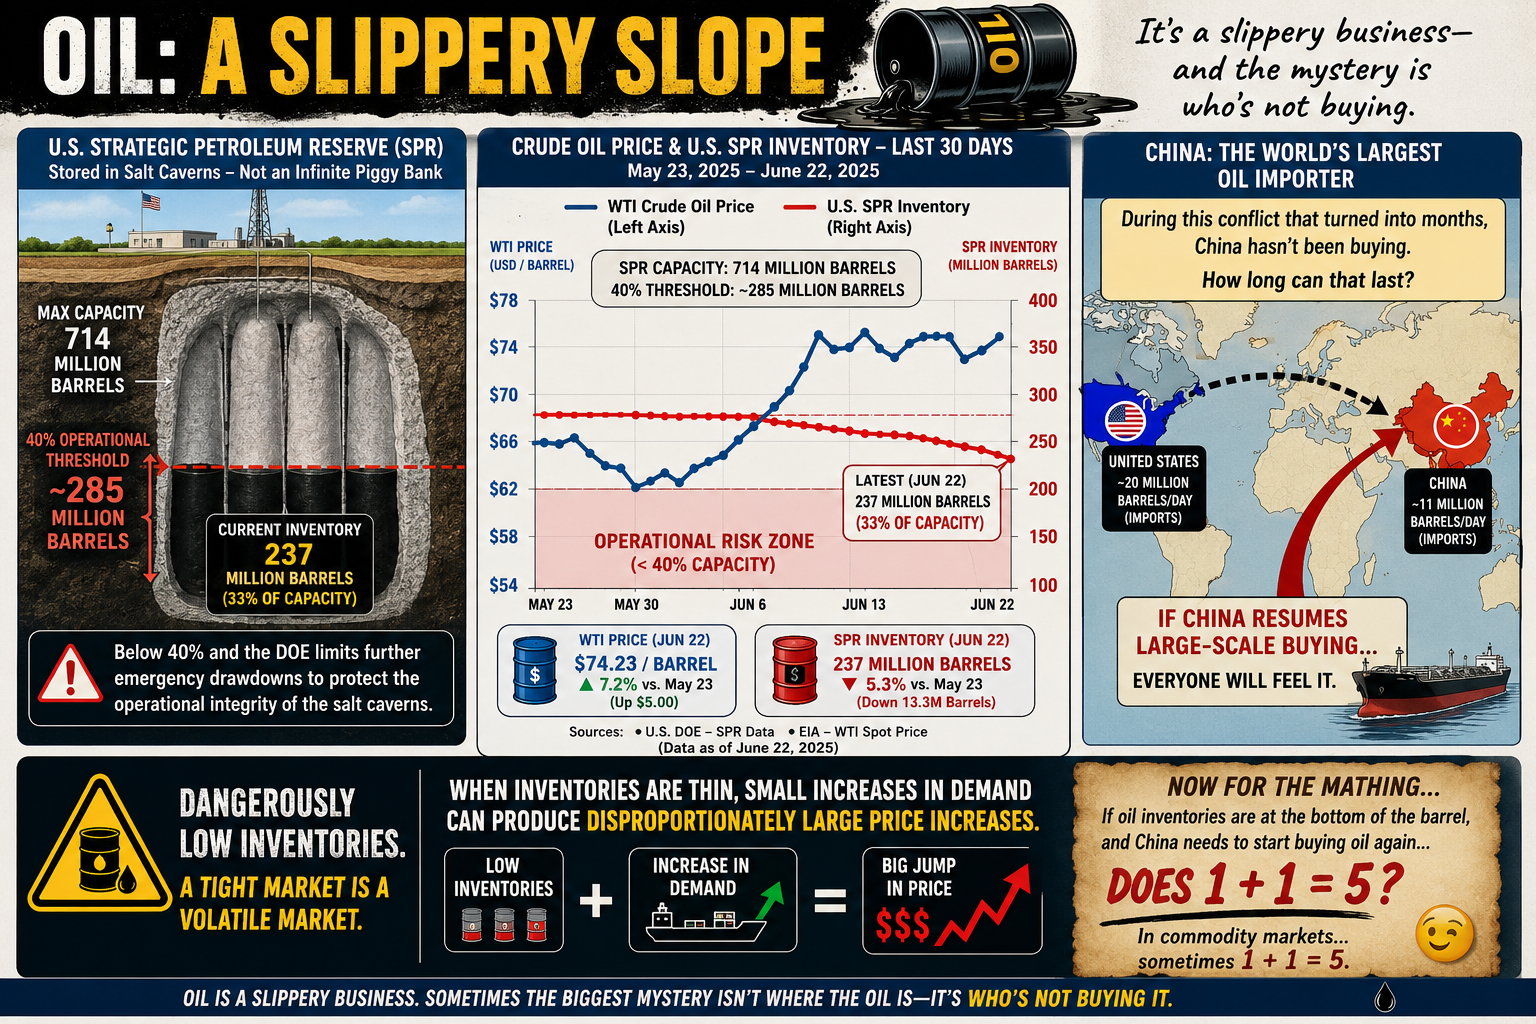
Take the U.S. Strategic Petroleum Reserve (SPR). It’s often treated like a giant underground gas tank that can be drained and refilled at will. Not quite. The reserve is stored in massive salt caverns, and if inventories fall below roughly 40% of its 714 million-barrel capacity (about 285 million barrels), the Department of Energy limits additional emergency withdrawals. The reason isn’t politics—it’s geology. Keeping enough oil in the caverns helps maintain their long-term operational integrity.

The same basic challenge applies everywhere. Oil storage isn’t as simple as stacking barrels in a warehouse. Tanks, pipelines, and underground caverns all have practical operating limits, and those limits can shape energy policy as much as supply and demand.

Then there’s China.

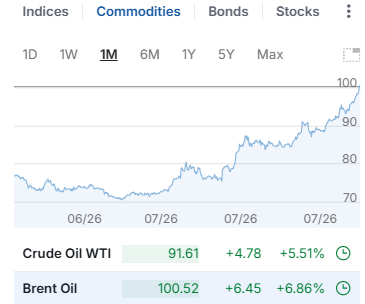
Despite a conflict that many expected would trigger a buying spree, China has reportedly remained on the sidelines for months rather than aggressively increasing crude purchases. Whether that’s because of existing inventories, weak domestic demand, economic strategy, or expectations of lower future prices is open to debate.

The interesting question isn’t whether China can avoid buying oil today. It’s how long it can continue doing so.

Eventually, inventories run down, demand changes, or market conditions shift. And when one of the world’s largest oil consumers steps back into the market, everyone notices.

Oil has always been a slippery business. Sometimes the biggest mystery isn’t where the oil is—it’s who’s not buying it.

Now for the Math…

If global oil inventories are scraping the bottom of the barrel, and the world’s largest importer suddenly has to start buying again…

…does 1 + 1 = 5?

Not in arithmetic. But in commodity markets, sometimes it feels that way.

When supply is already tight, prices don’t rise in a neat, linear fashion. A relatively small increase in demand can trigger a disproportionately large jump in price as buyers compete for the same limited barrels. Traders see it coming, futures markets react, inventories shrink even faster, and a little bit of demand can snowball into a much bigger price move.

In other words, 1 + 1 doesn’t equal 5 because the math changed—it equals 5 because human behavior did.

Oil markets have always had a nonlinear streak. When inventories are comfortable, an extra million barrels a day barely makes a ripple. But when stocks are running low and spare capacity is scarce, that same million barrels can feel like throwing a match into a room full of gasoline.

That’s why economists watch inventories just as closely as production. Sometimes the most important number isn’t how much oil is being pumped—it’s how much is left in the tank.

bookmark_borderAccounting for Climate Responsibility

by Daniel Brouse

Comparing Two Approaches to Measuring Humanity’s Climate Footprint

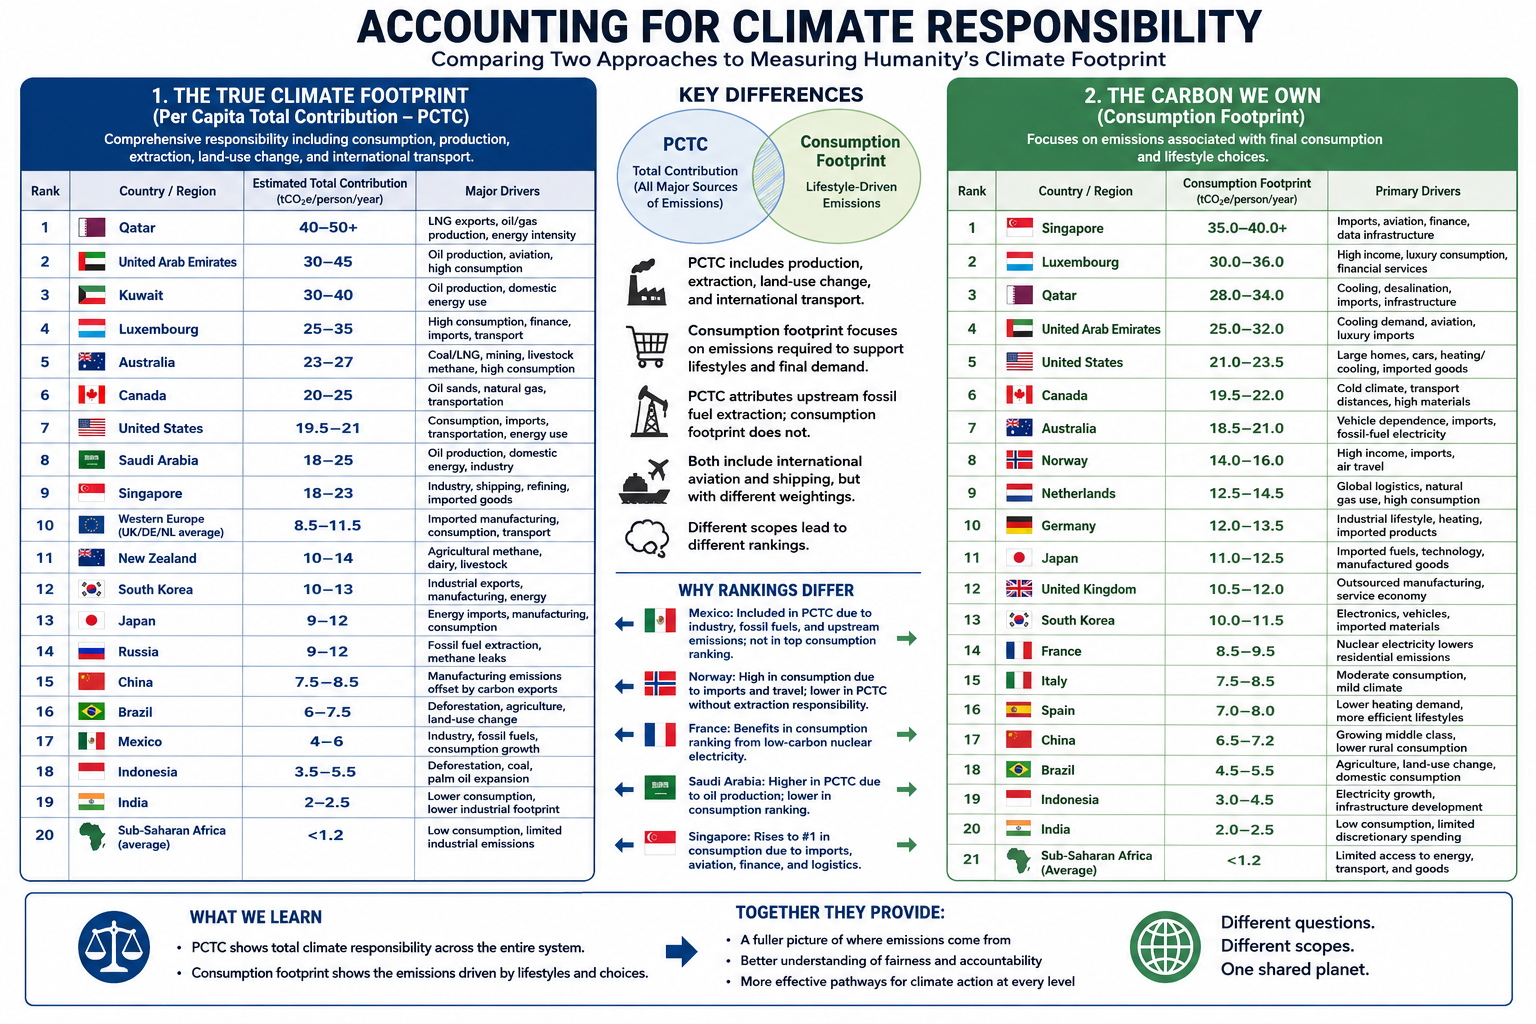
Climate responsibility depends on how emissions are assigned. Traditional territorial accounting attributes emissions to the country where they occur, but globalization has made that approach increasingly incomplete. Modern supply chains, international trade, and service-based economies often separate where emissions are produced from who ultimately benefits from them.

To explore this problem from two different perspectives, I developed two complementary accounting frameworks.

The first paper, The True Climate Footprint: Measuring Per Capita Total Contribution Beyond Territorial Emissions, introduces the Per Capita Total Contribution (PCTC) framework. PCTC seeks to estimate an individual’s or nation’s complete climate responsibility by incorporating not only consumption, but also several major sources of emissions that are frequently omitted from conventional carbon accounting.

The True Climate Footprint: Measuring Per Capita Total Contribution

The PCTC framework includes:

  • Consumption-based emissions
  • Land-use change and deforestation
  • Upstream fossil fuel extraction (methane leakage, flaring, and coal mine emissions)
  • International aviation and maritime shipping
  • All major greenhouse gases (CO₂, CH₄, N₂O, and others expressed as CO₂-equivalent)
  • Responsibility associated with fossil fuel production where appropriate

The second paper, The Carbon We Own: Why Consumption Matters More, examines climate responsibility from a different perspective. Rather than estimating total climate contribution, it focuses specifically on the carbon footprint required to support modern lifestyles using a consumption-based accounting approach.

The Carbon We Own: Why Consumption Matters More

This framework emphasizes:

  • Multi-Regional Input-Output (MRIO) accounting
  • Direct household energy use
  • Embedded emissions in imported goods
  • Public and private services
  • Lifestyle and purchasing choices

Unlike PCTC, this framework intentionally places less emphasis on fossil fuel extraction and producer responsibility in order to better isolate the climate impacts associated with everyday consumption.

After completing the first paper, I wanted to examine the climate footprint from the perspective of the consumer rather than the entire climate system. The PCTC framework provides a comprehensive measure of total responsibility, but it does not distinguish as clearly between emissions driven by individual lifestyle choices and those associated with resource extraction or national production.

A consumption-based framework highlights decisions that individuals and societies can influence more directly. Choices such as lowering a home’s thermostat, improving insulation, selecting public transportation or electric vehicles instead of internal combustion vehicles, reducing air travel, or purchasing fewer carbon-intensive goods become more visible within the accounting. It also better captures the increasingly important role of service-based economies. While services may appear less energy-intensive than manufacturing, sectors such as healthcare, finance, telecommunications, cloud computing, and artificial intelligence rely on extensive digital infrastructure—including energy-hungry data centers—that can be substantially underrepresented in traditional emissions inventories.

Finally, I wanted a more detailed comparison among developed economies, particularly within Europe. Countries such as Norway and France illustrate why accounting methodology matters. Norway has one of the world’s cleanest domestic electricity systems, powered primarily by hydropower, yet it is also a major exporter of oil and natural gas. France, by contrast, derives much of its electricity from nuclear power, resulting in comparatively low-carbon domestic energy while maintaining a high standard of living. Comparing these countries under both frameworks reveals how different accounting methods assign responsibility and helps illustrate the strengths and limitations of each approach.

Taken together, these two papers do not compete—they answer different questions. Per Capita Total Contribution (PCTC) asks, What is humanity’s full climate responsibility? Consumption-based accounting asks, What emissions are required to sustain the lifestyle of the average resident? Used together, they provide a more complete understanding of climate responsibility than either framework alone.

Conclusion

Although The True Climate Footprint and The Carbon We Own both seek to improve upon traditional territorial emissions accounting, they answer different questions because they are built on different accounting frameworks.

The True Climate Footprint uses the Per Capita Total Contribution (PCTC) framework to estimate an individual’s or nation’s complete contribution to climate change. It extends beyond consumption to include land-use change, upstream fossil fuel extraction, international shipping and aviation, and the full spectrum of greenhouse gases. In some cases, it also attributes responsibility associated with fossil-fuel production, providing a broad measure of humanity’s total climate impact.

By contrast, The Carbon We Own focuses specifically on consumption-based climate responsibility. Using Multi-Regional Input-Output (MRIO) accounting, it assigns emissions to the final consumer by emphasizing direct household energy use, embedded emissions in imported goods, services, and lifestyle choices. It intentionally deemphasizes extraction and producer responsibility in order to better represent the carbon footprint required to sustain modern patterns of consumption.

Because these frameworks measure different aspects of climate responsibility, their rankings are not expected to be identical.

Mexico provides a useful illustration. Under the PCTC framework, Mexico’s estimated footprint includes domestic industry, fossil fuel production, growing consumption, and upstream emissions, resulting in an estimated contribution of approximately 4–6 tonnes of CO₂-equivalent per person per year. In the consumption-based analysis, however, Mexico does not appear among the highest-ranking countries because the focus is limited to end-user consumption, and the published rankings emphasize the world’s largest per-capita consumption footprints.

Similar differences appear elsewhere. Norway’s position changes substantially because one framework incorporates the climate responsibility associated with fossil fuel production, while the other emphasizes domestic consumption. France benefits in the consumption-based analysis because its low-carbon nuclear electricity reduces household emissions despite maintaining a high standard of living. Saudi Arabia ranks differently depending on whether responsibility is assigned to oil production or to energy consumption. Singapore rises dramatically under consumption accounting because imported goods, international aviation, finance, logistics, and digital infrastructure contribute heavily to its consumption footprint despite relatively limited domestic manufacturing.

These examples demonstrate that accounting methodology influences how climate responsibility is distributed. Production-based, consumption-based, and total-contribution frameworks each illuminate different dimensions of the global climate system.

Rather than viewing these approaches as competing methodologies, they should be regarded as complementary analytical tools. The Per Capita Total Contribution (PCTC) framework asks, What is a nation’s or individual’s total contribution to climate change? The consumption-based framework asks, What emissions are required to sustain the average resident’s lifestyle? Together, they provide a more complete understanding of climate responsibility than either approach can achieve alone, revealing both the systemic impacts of resource production and the powerful role of consumer demand in shaping the global climate.