The latest U.S. tariff framework is now in place, and while tariffs are collected at the border, it’s American families who ultimately pay most of the bill.
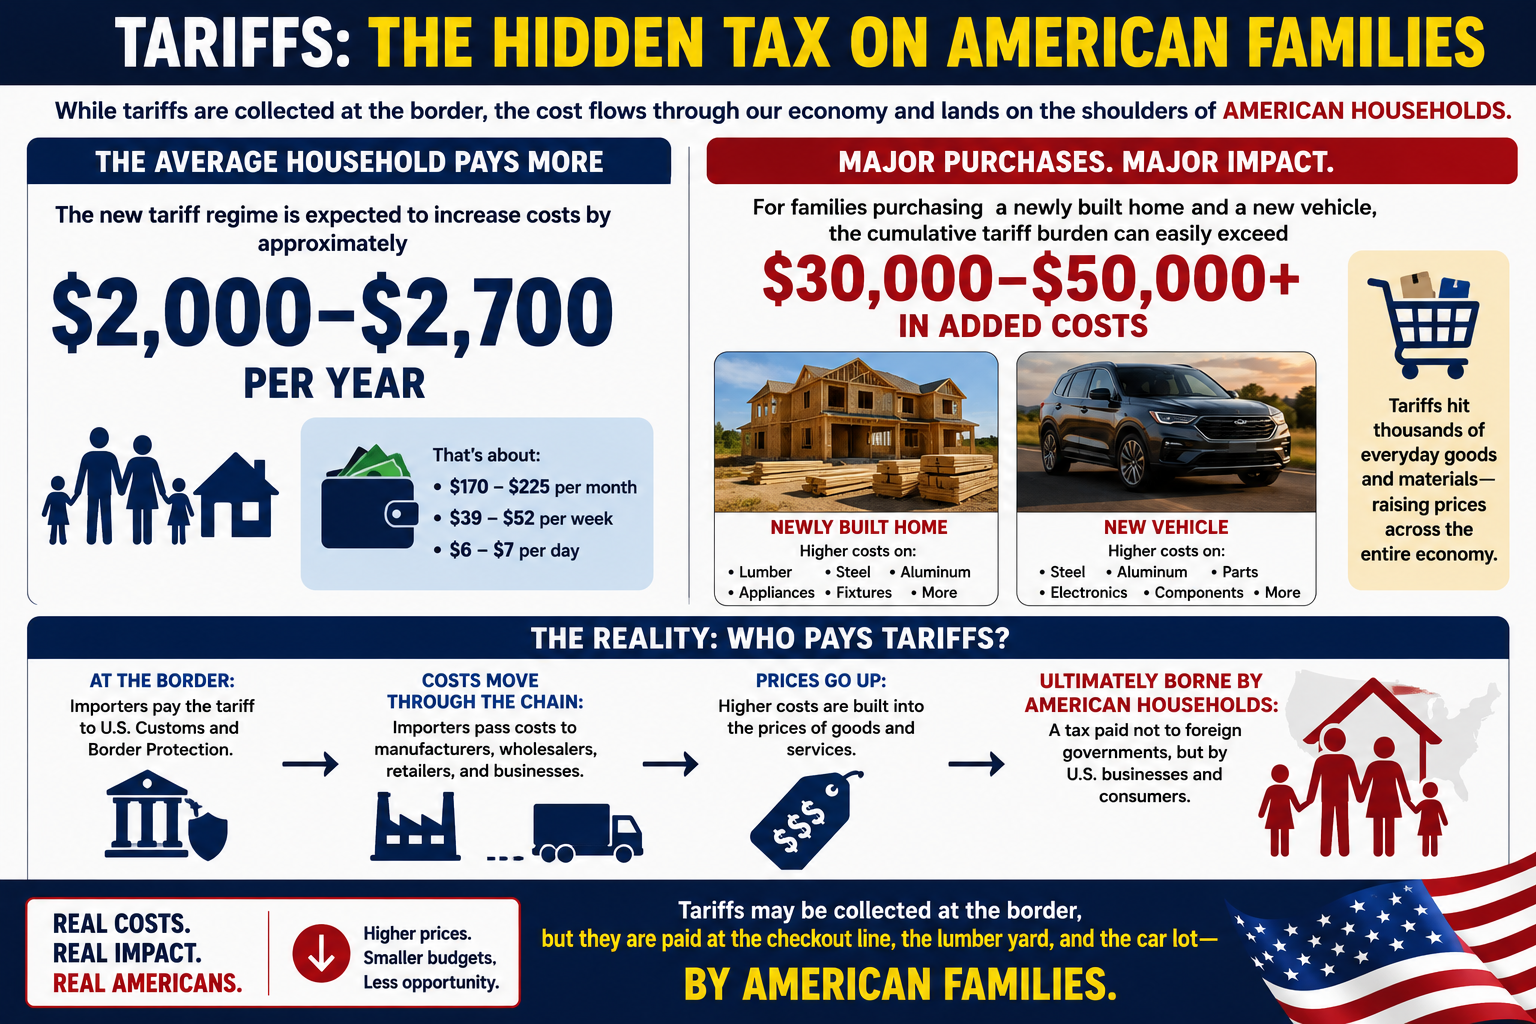
📊 Highlights: • Average household: +$2,000–$2,700 per year • Buying a new home and a new car? The added cost from tariffs on steel, aluminum, lumber, vehicles, appliances, and other goods could exceed $30,000–$50,000. • New tariffs now cover nearly 99.4% of U.S. imports from 60 trading partners, while additional 50% tariffs on many Canadian products are scheduled to begin in August.
The article explains what changed, which goods are affected, who legally pays the tariff, and who ultimately bears the economic burden.
Read the full analysis and decide for yourself: Are tariffs protecting American industry, or are they becoming one of the largest hidden taxes on American consumers?
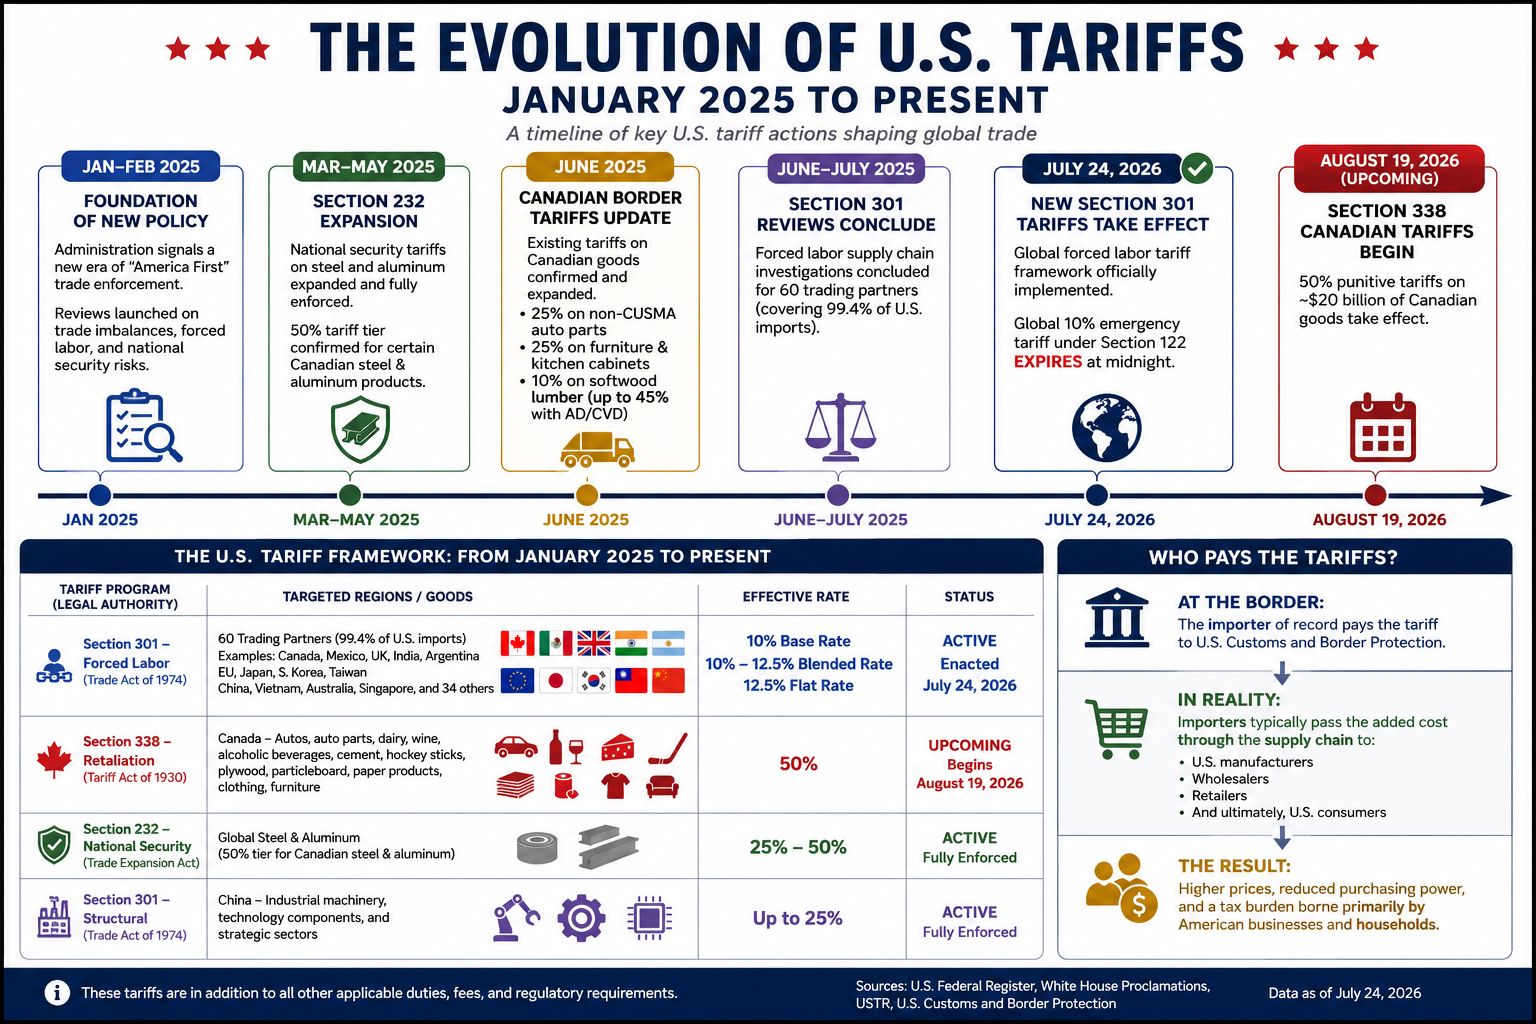
Effective July 24, 2026, the United States implemented a new tariff regime targeting imports from approximately 60 trading partners, representing 99.4% of all U.S. imports. The tariffs are based on supply-chain forced labor investigations.
Tariff Rates
10% Base Rate
Canada
Mexico
United Kingdom
India
Argentina
10%–12.5% Blended Rate
European Union
Japan
South Korea
Taiwan
12.5% Flat Rate
China
Vietnam
Australia
Singapore
34 additional economies under investigation
Exemptions
Several strategically important commodities remain exempt, including:
Crude oil
Natural gas
Fertilizer
Selected primary food products
These tariffs also do not stack with existing Section 232 national security duties.
2. Upcoming Canadian Tariffs: Section 338
Beginning August 19, 2026, the United States is scheduled to impose 50% retaliatory tariffs on approximately $20 billion of Canadian imports under Section 338 of the Tariff Act of 1930.
Products Subject to the 50% Tariff
Dairy products
Wine and other alcoholic beverages
Automobiles
Auto parts
Cement
Hockey equipment
Plywood
Particleboard
Paper products
Clothing
Furniture
These tariffs bypass normal CUSMA (USMCA) preferential treatment.
Exemptions
The following Canadian exports are excluded:
Energy products
Potash
Fish
Critical minerals
3. Existing Tariffs That Remain in Effect
Several major tariff programs adopted during 2025 and 2026 continue unchanged.
Section 232 National Security Tariffs
These duties continue to apply to steel and aluminum imports, including tariffs reaching 50% on certain Canadian steel and aluminum products.
Existing Canadian Import Tariffs
Additional tariffs remain in place on:
25% on non-CUSMA-compliant auto parts
25% on upholstered furniture and kitchen cabinets
10% tariff on Canadian softwood lumber, with combined anti-dumping and countervailing duties pushing the effective rate to approximately 45%
Section 301 China Tariffs
Long-standing tariffs on Chinese imports also remain active, with rates reaching 25% on numerous products, including:
Industrial machinery
Technology equipment
Electronic components
Strategic manufacturing inputs
Current U.S. Tariff Framework
Tariff Program
Primary Target
Rate
Status
Section 301 – Forced Labor
60 trading partners
10%–12.5%
Active (July 24, 2026)
Section 338 – Canada
Autos, dairy, wine, cement, consumer goods
50%
Begins August 19, 2026
Section 232 – National Security
Steel & aluminum
25%–50%
Active
Section 301 – China
Industrial & technology products
Up to 25%
Active
Who Really Pays Tariffs?
Legally, tariffs are paid by the U.S. importer when goods enter the country through Customs and Border Protection.
Economically, however, that is only the beginning of the story.
Importers generally recover those additional costs by increasing the prices they charge wholesalers, retailers, manufacturers, and ultimately consumers. Numerous economic studies of recent U.S. tariffs have found that most of the cost is passed through to American businesses and households rather than absorbed by foreign exporters.
In some industries, foreign suppliers may reduce prices to remain competitive, meaning they share part of the burden. But the overall trade data and pricing evidence show that the majority of tariff costs are ultimately borne within the United States through higher prices, reduced business margins, or both.
In other words, while tariffs are collected at the border from importers, they function much like a domestic consumption tax. The final bill is usually paid by American businesses and consumers—not by foreign governments.
Conclusion
For the average American household, the new tariff regime is expected to increase costs by approximately $2,000–$2,700 per year. For families purchasing a newly built home and a new vehicle, the cumulative tariff burden can easily exceed $30,000–$50,000 through higher prices on construction materials, automobiles, appliances, and other imported goods. While tariffs are collected at the border from importers, they are ultimately borne by American businesses and consumers in the form of higher prices—a tax paid not to foreign governments, but by U.S. households.
Oil is one of those subjects that’s surprisingly slippery—both physically and economically. Most people know prices go up and down, but few realize that even storing oil comes with limits.
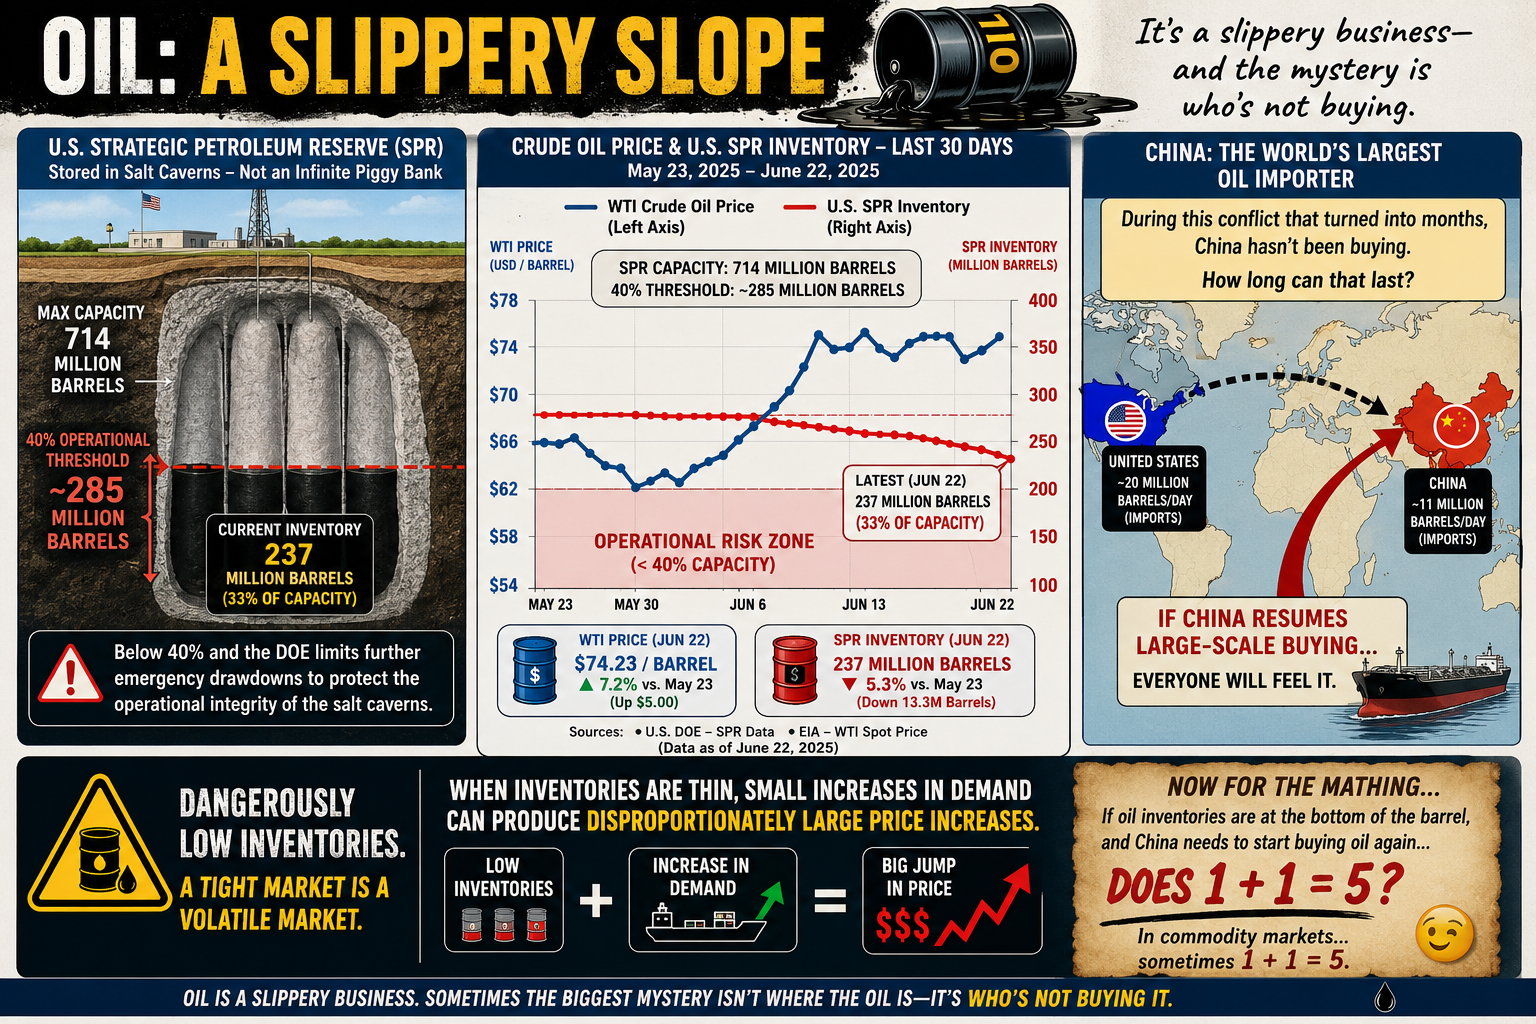
Take the U.S. Strategic Petroleum Reserve (SPR). It’s often treated like a giant underground gas tank that can be drained and refilled at will. Not quite. The reserve is stored in massive salt caverns, and if inventories fall below roughly 40% of its 714 million-barrel capacity (about 285 million barrels), the Department of Energy limits additional emergency withdrawals. The reason isn’t politics—it’s geology. Keeping enough oil in the caverns helps maintain their long-term operational integrity.
The same basic challenge applies everywhere. Oil storage isn’t as simple as stacking barrels in a warehouse. Tanks, pipelines, and underground caverns all have practical operating limits, and those limits can shape energy policy as much as supply and demand.
Then there’s China.
Despite a conflict that many expected would trigger a buying spree, China has reportedly remained on the sidelines for months rather than aggressively increasing crude purchases. Whether that’s because of existing inventories, weak domestic demand, economic strategy, or expectations of lower future prices is open to debate.
The interesting question isn’t whether China can avoid buying oil today. It’s how long it can continue doing so.
Eventually, inventories run down, demand changes, or market conditions shift. And when one of the world’s largest oil consumers steps back into the market, everyone notices.
Oil has always been a slippery business. Sometimes the biggest mystery isn’t where the oil is—it’s who’s not buying it.
Now for the Math…
If global oil inventories are scraping the bottom of the barrel, and the world’s largest importer suddenly has to start buying again…
…does 1 + 1 = 5?
Not in arithmetic. But in commodity markets, sometimes it feels that way.
When supply is already tight, prices don’t rise in a neat, linear fashion. A relatively small increase in demand can trigger a disproportionately large jump in price as buyers compete for the same limited barrels. Traders see it coming, futures markets react, inventories shrink even faster, and a little bit of demand can snowball into a much bigger price move.
In other words, 1 + 1 doesn’t equal 5 because the math changed—it equals 5 because human behavior did.
Oil markets have always had a nonlinear streak. When inventories are comfortable, an extra million barrels a day barely makes a ripple. But when stocks are running low and spare capacity is scarce, that same million barrels can feel like throwing a match into a room full of gasoline.
That’s why economists watch inventories just as closely as production. Sometimes the most important number isn’t how much oil is being pumped—it’s how much is left in the tank.
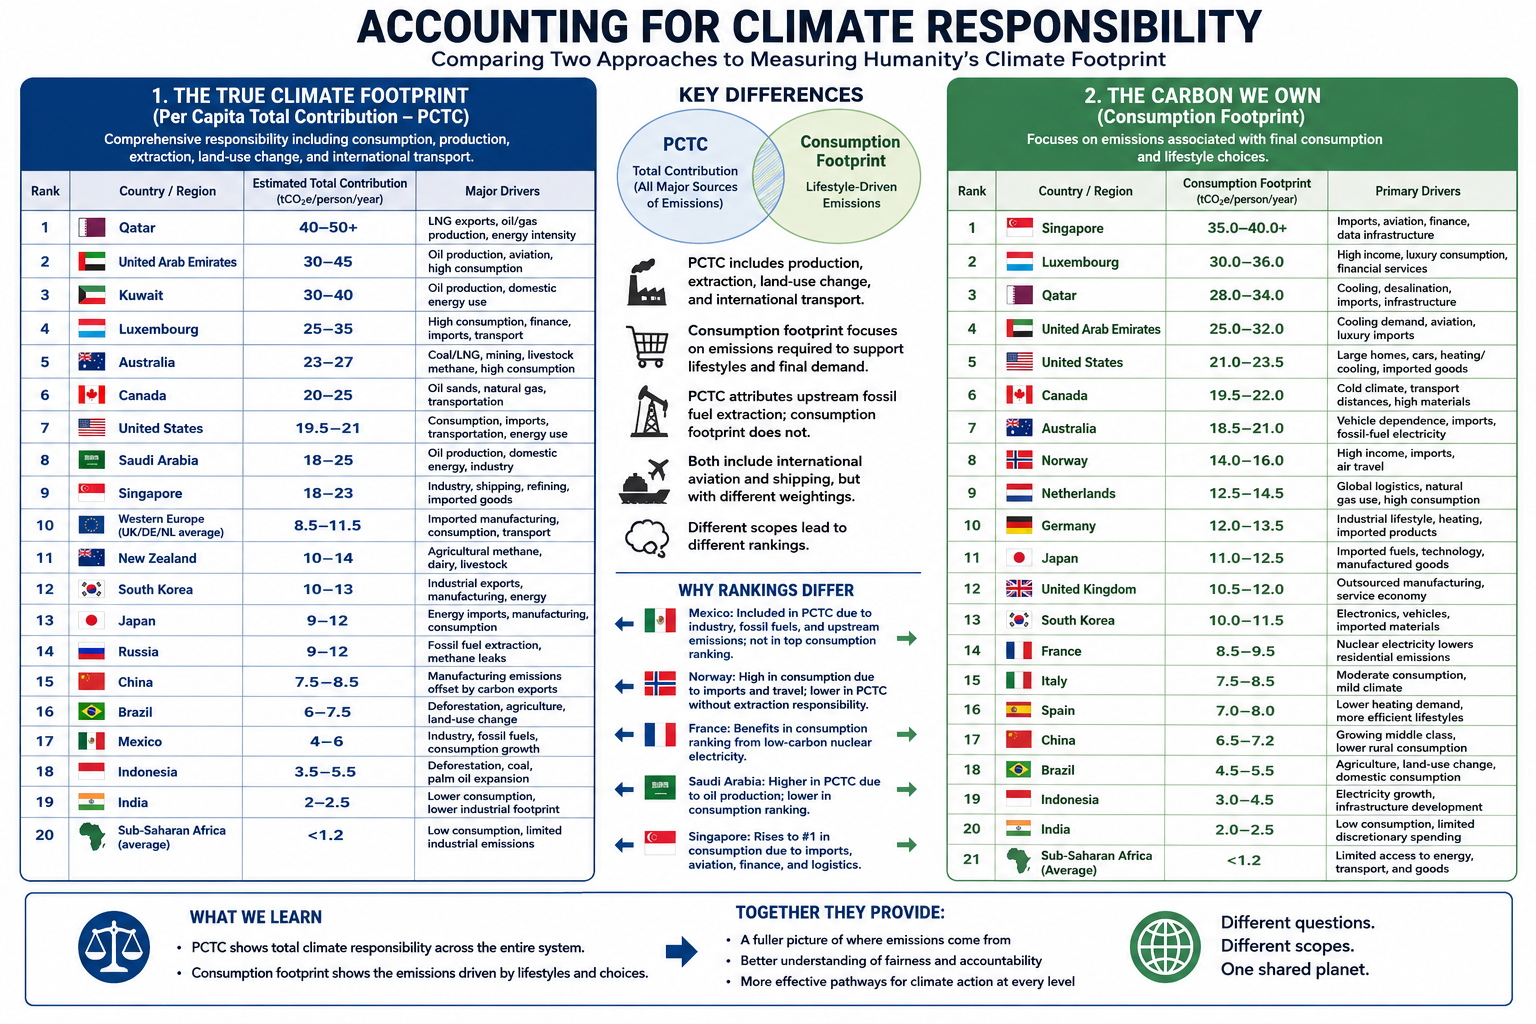
Comparing Two Approaches to Measuring Humanity’s Climate Footprint
Climate responsibility depends on how emissions are assigned. Traditional territorial accounting attributes emissions to the country where they occur, but globalization has made that approach increasingly incomplete. Modern supply chains, international trade, and service-based economies often separate where emissions are produced from who ultimately benefits from them.
To explore this problem from two different perspectives, I developed two complementary accounting frameworks.
The first paper, The True Climate Footprint: Measuring Per Capita Total Contribution Beyond Territorial Emissions, introduces the Per Capita Total Contribution (PCTC) framework. PCTC seeks to estimate an individual’s or nation’s complete climate responsibility by incorporating not only consumption, but also several major sources of emissions that are frequently omitted from conventional carbon accounting.
All major greenhouse gases (CO₂, CH₄, N₂O, and others expressed as CO₂-equivalent)
Responsibility associated with fossil fuel production where appropriate
The second paper, The Carbon We Own: Why Consumption Matters More, examines climate responsibility from a different perspective. Rather than estimating total climate contribution, it focuses specifically on the carbon footprint required to support modern lifestyles using a consumption-based accounting approach.
Unlike PCTC, this framework intentionally places less emphasis on fossil fuel extraction and producer responsibility in order to better isolate the climate impacts associated with everyday consumption.
After completing the first paper, I wanted to examine the climate footprint from the perspective of the consumer rather than the entire climate system. The PCTC framework provides a comprehensive measure of total responsibility, but it does not distinguish as clearly between emissions driven by individual lifestyle choices and those associated with resource extraction or national production.
A consumption-based framework highlights decisions that individuals and societies can influence more directly. Choices such as lowering a home’s thermostat, improving insulation, selecting public transportation or electric vehicles instead of internal combustion vehicles, reducing air travel, or purchasing fewer carbon-intensive goods become more visible within the accounting. It also better captures the increasingly important role of service-based economies. While services may appear less energy-intensive than manufacturing, sectors such as healthcare, finance, telecommunications, cloud computing, and artificial intelligence rely on extensive digital infrastructure—including energy-hungry data centers—that can be substantially underrepresented in traditional emissions inventories.
Finally, I wanted a more detailed comparison among developed economies, particularly within Europe. Countries such as Norway and France illustrate why accounting methodology matters. Norway has one of the world’s cleanest domestic electricity systems, powered primarily by hydropower, yet it is also a major exporter of oil and natural gas. France, by contrast, derives much of its electricity from nuclear power, resulting in comparatively low-carbon domestic energy while maintaining a high standard of living. Comparing these countries under both frameworks reveals how different accounting methods assign responsibility and helps illustrate the strengths and limitations of each approach.
Taken together, these two papers do not compete—they answer different questions. Per Capita Total Contribution (PCTC) asks, What is humanity’s full climate responsibility?Consumption-based accounting asks, What emissions are required to sustain the lifestyle of the average resident? Used together, they provide a more complete understanding of climate responsibility than either framework alone.
Conclusion
Although The True Climate Footprint and The Carbon We Own both seek to improve upon traditional territorial emissions accounting, they answer different questions because they are built on different accounting frameworks.
The True Climate Footprint uses the Per Capita Total Contribution (PCTC) framework to estimate an individual’s or nation’s complete contribution to climate change. It extends beyond consumption to include land-use change, upstream fossil fuel extraction, international shipping and aviation, and the full spectrum of greenhouse gases. In some cases, it also attributes responsibility associated with fossil-fuel production, providing a broad measure of humanity’s total climate impact.
By contrast, The Carbon We Own focuses specifically on consumption-based climate responsibility. Using Multi-Regional Input-Output (MRIO) accounting, it assigns emissions to the final consumer by emphasizing direct household energy use, embedded emissions in imported goods, services, and lifestyle choices. It intentionally deemphasizes extraction and producer responsibility in order to better represent the carbon footprint required to sustain modern patterns of consumption.
Because these frameworks measure different aspects of climate responsibility, their rankings are not expected to be identical.
Mexico provides a useful illustration. Under the PCTC framework, Mexico’s estimated footprint includes domestic industry, fossil fuel production, growing consumption, and upstream emissions, resulting in an estimated contribution of approximately 4–6 tonnes of CO₂-equivalent per person per year. In the consumption-based analysis, however, Mexico does not appear among the highest-ranking countries because the focus is limited to end-user consumption, and the published rankings emphasize the world’s largest per-capita consumption footprints.
Similar differences appear elsewhere. Norway’s position changes substantially because one framework incorporates the climate responsibility associated with fossil fuel production, while the other emphasizes domestic consumption. France benefits in the consumption-based analysis because its low-carbon nuclear electricity reduces household emissions despite maintaining a high standard of living. Saudi Arabia ranks differently depending on whether responsibility is assigned to oil production or to energy consumption. Singapore rises dramatically under consumption accounting because imported goods, international aviation, finance, logistics, and digital infrastructure contribute heavily to its consumption footprint despite relatively limited domestic manufacturing.
These examples demonstrate that accounting methodology influences how climate responsibility is distributed. Production-based, consumption-based, and total-contribution frameworks each illuminate different dimensions of the global climate system.
Rather than viewing these approaches as competing methodologies, they should be regarded as complementary analytical tools. The Per Capita Total Contribution (PCTC) framework asks, What is a nation’s or individual’s total contribution to climate change? The consumption-based framework asks, What emissions are required to sustain the average resident’s lifestyle? Together, they provide a more complete understanding of climate responsibility than either approach can achieve alone, revealing both the systemic impacts of resource production and the powerful role of consumer demand in shaping the global climate.
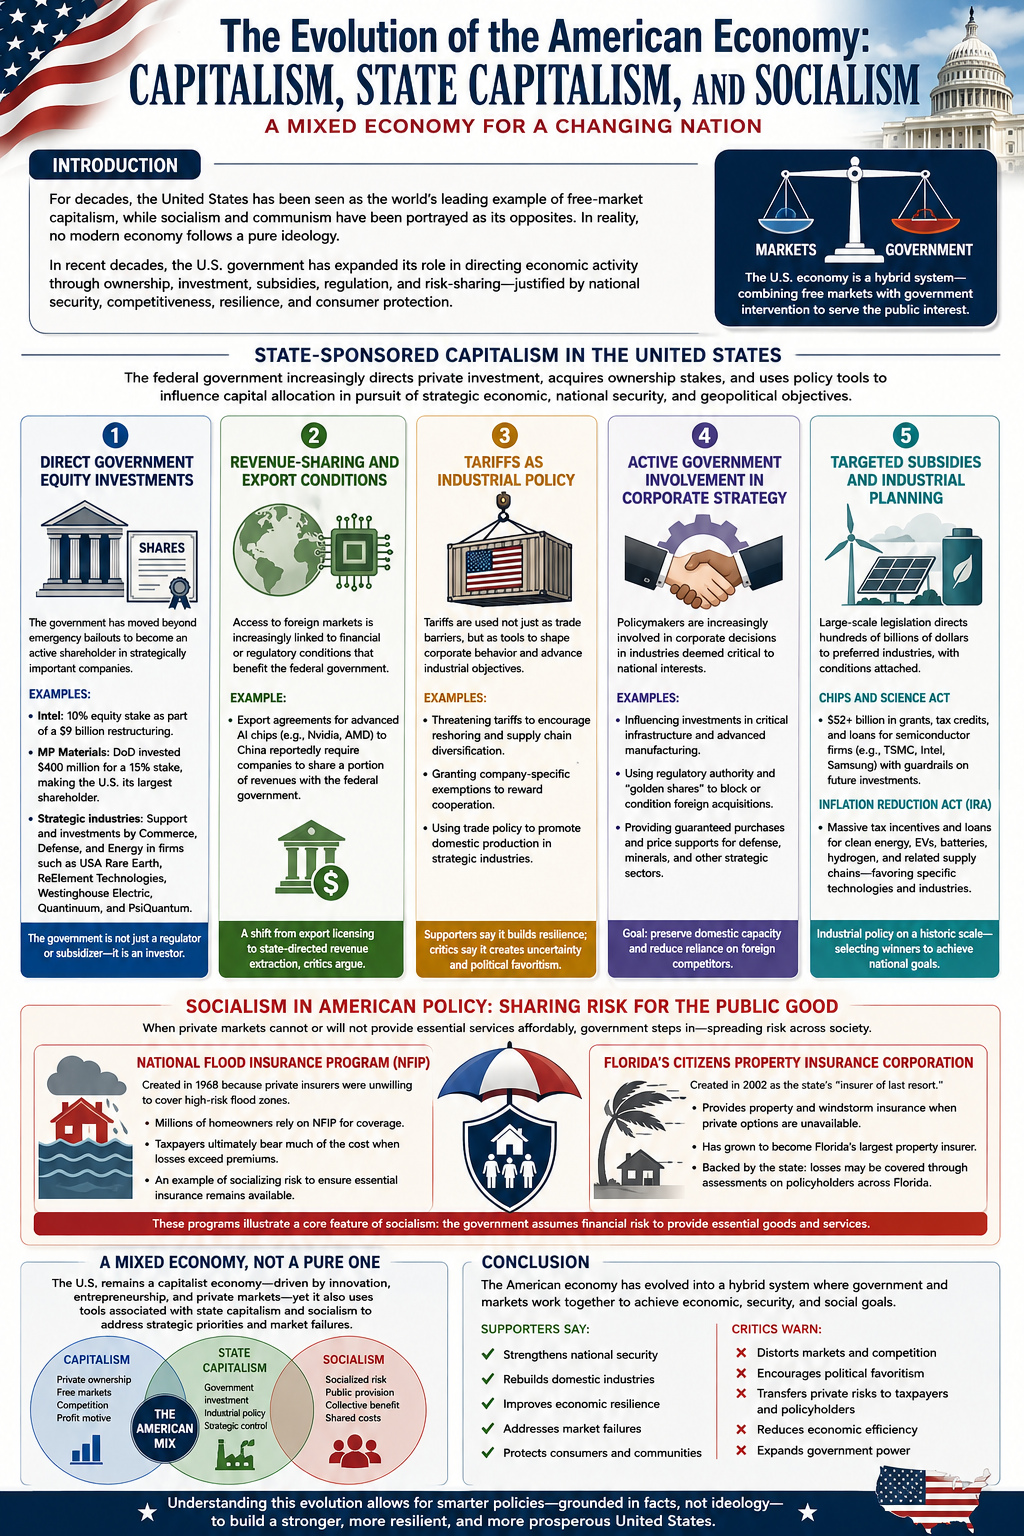
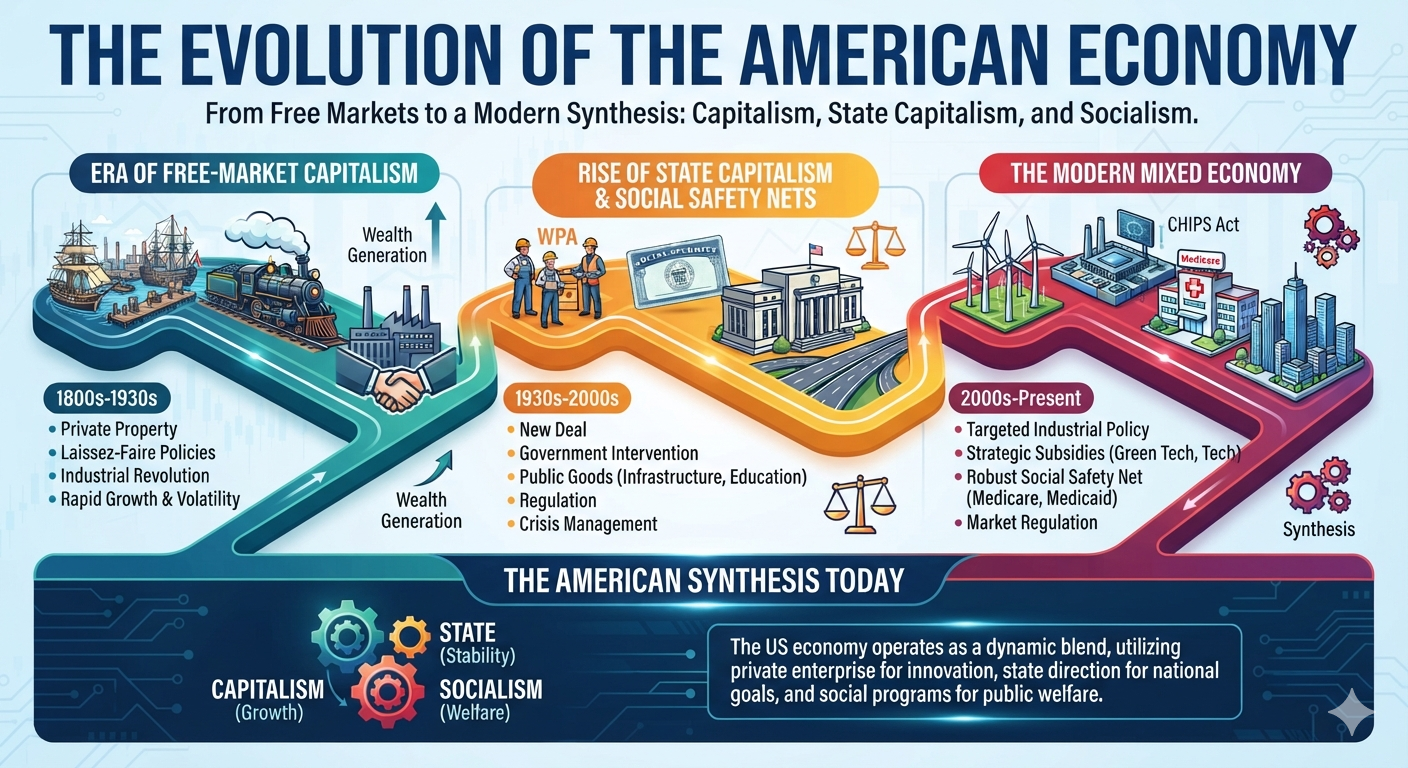
For much of its history, the United States has been portrayed as the world’s leading example of free-market capitalism, while socialism and communism have often been presented as fundamentally incompatible with American economic principles. In reality, no modern economy operates as a pure ideological model. Instead, governments continually adapt their economic policies in response to war, financial crises, technological competition, natural disasters, and changing national priorities.
Over the past several decades—and especially in recent years—the United States has significantly expanded the role of government in directing economic activity. Federal and state governments now provide targeted subsidies, acquire ownership stakes in private companies, shape investment decisions, guarantee markets for strategic industries, and assume financial risks that private markets are unwilling to bear. These policies are generally justified on the grounds of national security, economic competitiveness, supply-chain resilience, disaster recovery, or consumer protection.
This paper examines how these policies reflect characteristics traditionally associated with state-sponsored capitalism and socialism. Rather than arguing that the United States has abandoned capitalism, it demonstrates how the American economy has evolved into a hybrid system that combines free markets with substantial government intervention. Understanding this evolution provides important context for evaluating current economic policy and the changing relationship between government and private enterprise.
State-Sponsored Capitalism in the United States
State-sponsored capitalism (also called state capitalism) refers to an economic system in which the government plays an increasingly active role in directing private investment, acquiring ownership stakes in companies, or using public policy to influence capital allocation in pursuit of strategic economic, national security, or geopolitical objectives.
In recent years, the United States has moved further toward this model. While market mechanisms remain the foundation of the U.S. economy, successive administrations have expanded the federal government’s role through direct investments, industrial policy, subsidies, export controls, tariffs, and other forms of intervention designed to strengthen domestic manufacturing, secure critical supply chains, and enhance national competitiveness.
The principal mechanisms through which the federal government has pursued state-sponsored capitalism include the following:
1. Direct Government Equity Investments
Historically, federal ownership of private corporations was generally limited to temporary emergency bailouts. More recently, however, the government has begun acquiring direct equity positions in strategically important companies.
Examples include:
Intel: The federal government obtained a 10% equity stake in Intel as part of a restructuring package that included approximately $9 billion in federal support.
MP Materials: The Department of Defense invested approximately $400 million to acquire a 15% ownership stake in MP Materials, making the federal government its largest shareholder while supporting domestic rare-earth mineral production.
Strategic Industries: Federal agencies, including the Departments of Commerce, Defense, and Energy, have supported or invested in companies involved in critical technologies and infrastructure, including USA Rare Earth, ReElement Technologies, Westinghouse Electric Corporation, Quantinuum, and PsiQuantum.
These investments represent a notable departure from traditional industrial policy by making the government not only a regulator and subsidizer, but also an investor.
2. Revenue-Sharing and Export Conditions
The federal government has increasingly linked access to export markets with financial or regulatory conditions.
One example is the export framework governing advanced artificial intelligence chips. Agreements allowing companies such as Nvidia and AMD to export certain AI processors to China have reportedly included provisions requiring companies to share a portion of the resulting revenues with the federal government. Critics, including analysts at the Cato Institute, argue that this approach resembles state-directed revenue extraction rather than conventional export licensing.
3. Tariffs as Industrial Policy
Tariffs have become an increasingly important instrument of industrial strategy.
Rather than functioning solely as broad trade barriers, tariffs have also been used to influence corporate behavior.
Examples include:
Threatening tariffs to encourage companies to relocate manufacturing or diversify supply chains.
Granting company-specific exemptions or adjustments that reward firms aligning with national industrial objectives.
Using trade policy to encourage domestic production in strategically important industries.
Supporters argue these measures strengthen national resilience, while critics contend they increase uncertainty and allow greater political influence over private investment decisions.
4. Active Government Involvement in Corporate Strategy
Federal policymakers have become increasingly involved in major corporate decisions affecting industries considered strategically important.
Examples include:
Influencing investment decisions involving critical infrastructure and advanced manufacturing.
Exercising regulatory authority to discourage foreign acquisitions of strategically important companies.
Employing “golden share” mechanisms or comparable government veto powers in selected transactions involving national security interests.
Providing guaranteed purchase agreements or price supports for defense-related technologies, critical minerals, and other strategic industries.
These policies seek to preserve domestic industrial capacity while reducing dependence on foreign suppliers.
5. Targeted Subsidies and Industrial Planning
The expansion of state involvement did not begin with direct government ownership. Earlier legislation established a broad framework for government-directed industrial policy through grants, tax incentives, loans, and regulatory requirements.
The CHIPS and Science Act
The CHIPS and Science Act committed more than $52 billion in grants, tax credits, and loan guarantees to expand domestic semiconductor manufacturing. Major beneficiaries include Intel, TSMC, Samsung, and other semiconductor producers.
Recipients were also subject to “guardrail” provisions limiting certain future investments in countries considered strategic competitors.
The Inflation Reduction Act (IRA)
The Inflation Reduction Act created extensive tax credits, grants, and financing mechanisms supporting renewable energy, electric vehicles, battery manufacturing, hydrogen production, and related supply chains.
The legislation represents one of the largest industrial policy initiatives in U.S. history, directing hundreds of billions of dollars toward technologies identified by policymakers as priorities for the energy transition.
A New Economic Model?
Taken together, these policies illustrate a significant evolution in the relationship between the federal government and private enterprise. Rather than relying primarily on market incentives and regulatory oversight, the government has increasingly acted as investor, financier, customer, shareholder, trade negotiator, and strategic planner.
Supporters argue that these interventions are necessary to compete with state-directed economies such as China, strengthen national security, rebuild domestic manufacturing, and secure critical supply chains.
Critics counter that expanding government ownership, selective subsidies, preferential treatment, and direct intervention in private markets blur the traditional distinction between free-market capitalism and state-sponsored capitalism. They warn that such policies may distort competition, encourage political favoritism, and reduce market efficiency.
Whether viewed as a pragmatic response to global competition or a fundamental shift in American economic philosophy, the growing role of the federal government in directing private capital represents one of the most consequential developments in U.S. economic policy in decades.
Socialism
One characteristic commonly associated with socialism is the government assuming responsibility for providing goods or services that private markets are unable or unwilling to provide. In these cases, financial risks and costs are shared across society through taxes, mandatory assessments, or publicly backed insurance programs.
The U.S. insurance industry provides several examples of this approach.
The National Flood Insurance Program (NFIP)
The National Flood Insurance Program (NFIP), administered by the Federal Emergency Management Agency (FEMA), was established in 1968 because private insurers were largely unwilling to provide affordable flood insurance in many high-risk areas.
Rather than leaving homeowners without coverage, the federal government assumed much of the financial risk. Today, millions of property owners purchase flood insurance through the NFIP, with taxpayers ultimately bearing a substantial portion of catastrophic losses when claims exceed collected premiums. The program illustrates how the government has socialized a specific category of insurance risk that the private market has historically struggled to insure profitably.
Florida’s Citizens Property Insurance Corporation
Florida provides one of the clearest state-level examples of government intervention in insurance markets.
The Citizens Property Insurance Corporation was created by the Florida Legislature in 2002 as a government-established, not-for-profit insurer intended to serve as the state’s “insurer of last resort.” Its purpose is to provide property and windstorm insurance for homeowners, condominium owners, renters, and businesses that cannot obtain comparable coverage from private insurers.
As hurricanes have become more destructive, litigation costs have risen, and many private insurers have reduced their exposure or exited the Florida market altogether, Citizens has expanded dramatically. What began as a safety net has evolved into Florida’s largest property insurer, covering well over one million policies.
Unlike a private insurance company operating solely for profit, Citizens is backed by the state. If claims substantially exceed its financial reserves, Florida law allows Citizens to levy assessments on many insurance policies throughout the state to help cover losses. In effect, the financial risk is spread broadly among policyholders rather than borne exclusively by the individual customers who file claims.
A Mixed Economic Model
Programs such as the National Flood Insurance Program and Citizens Property Insurance Corporation illustrate how the United States operates as a mixed economy rather than a purely laissez-faire capitalist system. When private markets fail to provide essential services at affordable prices, governments have often stepped in to provide financing, insurance, or direct support.
Supporters argue that these programs protect homeowners, stabilize housing markets, and ensure that essential insurance remains available despite increasing climate and catastrophe risks.
Critics contend that publicly backed insurance can distort market signals, encourage development in high-risk areas, and shift financial burdens from individual property owners to taxpayers or other policyholders.
Regardless of one’s perspective, these programs demonstrate that government assumption of economic risk—one characteristic often associated with socialist policies—has become an established component of the American insurance system while coexisting with a predominantly private-market economy.
Conclusion
The American economy has never been completely free of government intervention, but the scope and nature of that intervention have changed substantially over time. Today, federal and state governments influence private markets through direct ownership, industrial policy, targeted subsidies, publicly backed insurance programs, trade policy, regulatory oversight, and strategic investments. These policies increasingly resemble characteristics associated with state-sponsored capitalism, while programs such as federally backed flood insurance and state-run insurers illustrate elements commonly associated with socialized risk.
Supporters argue that these interventions strengthen national security, rebuild domestic manufacturing, improve economic resilience, and address market failures that private enterprise alone cannot solve. Critics contend that expanding government involvement can reduce market efficiency, distort competition, encourage political favoritism, and transfer private risks to taxpayers.
The United States remains a capitalist economy, but it is no longer accurately described as a purely laissez-faire one. Instead, it has evolved into a mixed economic system in which free markets coexist with significant government participation. Recognizing this reality allows for a more informed discussion of public policy—one based not on political labels, but on the practical ways governments and markets increasingly work together to shape economic outcomes.
Climate Change, Water Scarcity, and the Geopolitics of a Thirsty Planet
by Daniel Brouse
Water has become one of the defining geopolitical resources of the 21st century. Population growth, aging infrastructure, groundwater depletion, pollution, and climate change have pushed many of the world’s major river basins toward what researchers increasingly describe as global water bankruptcy—a condition in which demand permanently exceeds reliable supply.
While full-scale wars fought solely over water remain relatively uncommon, water has become an increasingly powerful geopolitical weapon. Governments use dams, reservoirs, and water diversions as strategic leverage. Armed groups target water infrastructure. Climate-driven droughts intensify existing political tensions, transforming long-standing disputes into national security crises.
Organizations such as the Pacific Institute have documented hundreds of water-related conflicts worldwide, with the frequency of violent incidents increasing as climate change accelerates.
South Asia: The Indus and Brahmaputra Basins
The Indus River (India vs. Pakistan)
The Indus River remains one of the world’s most dangerous hydro-political flashpoints.
For more than six decades, the 1960 Indus Waters Treaty largely insulated water management from military conflict between India and Pakistan. However, deteriorating political relations have placed the agreement under unprecedented strain. India has accelerated construction of upstream hydroelectric projects and has suspended portions of treaty cooperation, while Pakistan has repeatedly warned that any deliberate interruption of water flows would be viewed as an existential threat.
Because the Indus supports the majority of Pakistan’s agriculture, even modest reductions in flow can have enormous economic and humanitarian consequences.
The Brahmaputra River (China vs. India)
Farther east, China is constructing some of the world’s largest hydroelectric projects on the Yarlung Tsangpo—the upper reaches of the Brahmaputra River in Tibet.
Although Beijing maintains that the projects are designed primarily for power generation and flood management, India and Bangladesh remain concerned that upstream control could eventually allow China to manipulate downstream water availability during periods of drought or political tension.
As climate change alters Himalayan snowpack and glacier melt, these concerns continue to grow.
Northeast Africa: The Nile River Basin
Ethiopia, Egypt, and Sudan
The Grand Ethiopian Renaissance Dam (GERD) has transformed regional politics.
Located on the Blue Nile, the dam gives Ethiopia significant influence over seasonal river flows. Ethiopia views the project as essential for economic development and electrification. Egypt, however, depends on the Nile for roughly 97 percent of its freshwater supply and considers uninterrupted downstream flows a matter of national survival.
Despite years of negotiations involving Ethiopia, Egypt, and Sudan, no permanent, legally binding agreement governing long-term operation of the dam has been reached.
The Middle East: Water as Strategic Leverage
The Tigris and Euphrates Rivers
Turkey’s Southeastern Anatolia Project (GAP) includes more than twenty major dams and numerous hydroelectric facilities.
While the project has expanded Turkish agriculture and electricity production, it has substantially reduced downstream flows into Syria and Iraq.
The consequences include:
declining agricultural productivity,
shrinking wetlands,
increased desertification,
deterioration of the historic Mesopotamian Marshes, and
heightened regional political instability.
The Helmand River (Iran vs. Afghanistan)
Water shortages have also intensified conflict between Iran and Afghanistan.
Repeated droughts have strained implementation of existing water-sharing agreements, and disputes over upstream reservoirs and dams have contributed to armed clashes between Iranian border forces and Taliban-controlled Afghanistan.
Southeast Asia: The Mekong River Basin
China has built an extensive series of dams on the Upper Mekong (Lancang River).
Downstream nations—including Vietnam, Cambodia, Laos, and Thailand—have experienced increasingly erratic river levels, reduced sediment transport, declining fisheries, and unexpected drought conditions.
Millions of people depend upon the Mekong for food security and agriculture, making river management one of Southeast Asia’s most significant long-term geopolitical challenges.
Eastern Europe: Water Infrastructure as a Weapon
The war in Ukraine has demonstrated how water infrastructure itself can become a military target.
The destruction of the Kakhovka Dam along the Dnieper River triggered catastrophic flooding, devastated ecosystems, destroyed farmland, disrupted drinking water supplies, and complicated cooling operations at the nearby Zaporizhzhia Nuclear Power Plant.
The event illustrated how modern warfare increasingly includes attacks on critical water infrastructure.
North America: Climate Change Meets International Water Law
Unlike many international river systems, North America has long relied upon formal treaties to govern shared water resources. However, prolonged drought and climate change are placing these agreements under unprecedented stress.
The United States and Mexico
The foundation of U.S.–Mexico water management is the 1944 Water Treaty, administered by the International Boundary and Water Commission (IBWC).
The treaty established a reciprocal exchange:
The United States delivers approximately 1.5 million acre-feet annually from the Colorado River to Mexico.
Mexico delivers approximately 350,000 acre-feet annually from Rio Grande tributaries into the United States, supplying much of South Texas agriculture.
Growing Tensions
Persistent megadrought across the American Southwest and northern Mexico has severely strained compliance.
Mexico has accumulated significant delivery deficits under portions of the treaty, leading to growing frustration among Texas farmers and lawmakers.
Water has increasingly become intertwined with trade policy. Some U.S. officials have proposed incorporating treaty compliance into future reviews of the United States–Mexico–Canada Agreement (USMCA), potentially linking water deliveries to trade negotiations.
The United States has also denied certain Mexican requests for additional Colorado River deliveries during periods of domestic shortage, illustrating how climate stress is reshaping bilateral diplomacy.
The United States and Canada
Canada manages shared waters with the United States through the 1909 Boundary Waters Treaty, administered by the International Joint Commission (IJC).
This framework governs:
the Great Lakes,
the St. Lawrence River,
the St. Mary River,
the Milk River, and
numerous other shared waterways.
A separate agreement—the 1964 Columbia River Treaty (CRT)—governs flood control and hydropower operations throughout the Pacific Northwest.
The Columbia River Treaty Modernization
For six years, negotiators from both countries worked to modernize the aging Columbia River Treaty.
The 2024 Agreement-in-Principle
Negotiators reached a tentative Agreement-in-Principle that included several major reforms.
Reduced Hydropower Payments
The United States negotiated reductions in the long-standing Canadian Entitlement, under which U.S. utilities compensated British Columbia for upstream water storage used to generate downstream electricity.
Modern Flood Control
Instead of relying upon the original prepaid flood-control system, the agreement would establish annual payments—approximately $37.6 million per year—for coordinated flood storage operations.
Greater Canadian Flexibility
British Columbia would receive greater authority to manage reservoir operations to support local priorities, including salmon habitat restoration and Indigenous cultural resources.
Negotiations Enter Political Limbo
Although negotiators reached broad agreement, final treaty language has not been ratified.
A change in U.S. presidential leadership placed many international agreements under broader policy review, delaying completion of the modernization process.
The negotiations have also become entangled in wider U.S.–Canada trade disputes, including tariff discussions and political rhetoric surrounding North American natural resources. Canadian officials have expressed concern that future treaty approval could become tied to broader trade negotiations rather than water management alone.
Interim Operations
Because modernization remains incomplete, water managers have adopted temporary operational agreements.
These interim measures attempt to replicate portions of the proposed treaty but have produced localized consequences.
For example, Lake Roosevelt has experienced larger seasonal drawdowns to preserve flood-control capacity, affecting ferry operations, recreation, and infrastructure serving the Colville Reservation.
Indigenous and Environmental Concerns
Many environmental organizations and Tribal Nations argue that modernization still falls short.
The original 1964 treaty focused almost exclusively on flood control and hydropower production.
Although Indigenous governments participated extensively in modernization negotiations, many advocacy organizations—including Save Our Wild Salmon—argue that ecosystem function should become a legally co-equal objective alongside flood protection and electricity generation.
With salmon populations already under severe stress from warming rivers, altered streamflows, and habitat loss, many conservation groups believe future treaty revisions must place ecological resilience at the center of water management rather than treating it as a secondary consideration.
Conclusion: Water Wars Have Already Begun
The phrase water wars once sounded like science fiction. Today, it describes a rapidly emerging geopolitical reality.
Climate change is reducing snowpack, accelerating glacier loss, intensifying droughts, and making precipitation increasingly erratic. At the same time, populations continue to grow while agriculture, industry, and cities demand ever larger shares of finite freshwater resources.
Most future conflicts will not resemble conventional wars fought solely over rivers. Instead, they will involve economic pressure, treaty disputes, dam construction, infrastructure sabotage, cyberattacks, migration, and political coercion centered on water security.
From the Indus to the Nile, from the Mekong to the Colorado, and from the Columbia River to the Rio Grande, freshwater is becoming both an environmental challenge and a strategic resource.
The world’s next great geopolitical competition may not be fought over oil—but over the rivers that sustain civilization itself.
Complex social-ecological feedback loops arise when human systems and natural systems react to climate change in ways that amplify one another. Because Earth’s climate operates as a nonlinear system, these interactions do not unfold gradually — they can accelerate suddenly, compound unpredictably, and push the system toward irreversible shifts.
This nonlinear, cross-regional feedback behavior is something we have been modeling for decades — where climate physics couples directly with economic networks.
In the 1990s we underestimated one variable: human delay. We assumed mitigation would begin in earnest. It did not.
Now we observe potential doubling in the intensity or frequency of certain climate impacts on timescales of 2–10 years rather than centuries. The apparent acceleration has compressed from millennial-scale shifts to multi-decade nonlinear surges.
Denialism and Ecofascism
One factor we drastically underestimated was the influence of organized denialism and emerging ecofascist ideology.
Initially the investigation focused on a straightforward institutional question:
Were challenges to the EPA’s Endangerment Finding and coordinated regulatory rollbacks primarily driven by economic motives — specifically the fossil-fuel industry’s long-documented strategy of financing climate denial narratives?
Organizations such as the CO₂ Coalition and the Department of Energy’s Climate Working Group were key nodes of analysis. The economic motive was clear and well documented: protect fossil capital, delay regulation, and manufacture doubt.
But as correspondence, affiliations, and rhetoric were analyzed, a second pattern emerged.
This was not simply economic denialism. It was the normalization of ecofascist ideology.
Ecofascism reframes environmental collapse as beneficial — even desirable — if it reduces populations deemed inferior, excessive, or expendable. It merges environmental crisis with authoritarian hierarchy, racialized survival logic, and elite domination theory.
This is not speculation. It is visible in the language used by some elite circles revealed through the Epstein files.
Examples include statements attributed to Jeffrey Epstein such as:
“I liked the argument that more CO₂ is good for plants.”
“Maybe climate change is a good way of dealing with overpopulation — the Earth’s forest fire. Potentially a good thing for the species.”
Combined with statements reflecting explicit eugenic ideology:
“Executions of the elderly and infirm make sense.”
“African music has lots of beats and little development — no accident. It mirrors their learning process.”
This is not conventional policy disagreement. This is eliminationist logic.
Where traditional denial protects capital investment, ecofascism rationalizes unequal human survival.
Humans are unlikely to face immediate extinction under foreseeable climate scenarios. Our species possesses technological capabilities, global communication networks, and a remarkable ability to adapt to changing conditions.
Let’s lower the bar then to civilization collapse and define the term. Not talking about timeframes, could you explain what that term means to you? What are some of the things that would happen? How could we recognize the start? What things would fail?
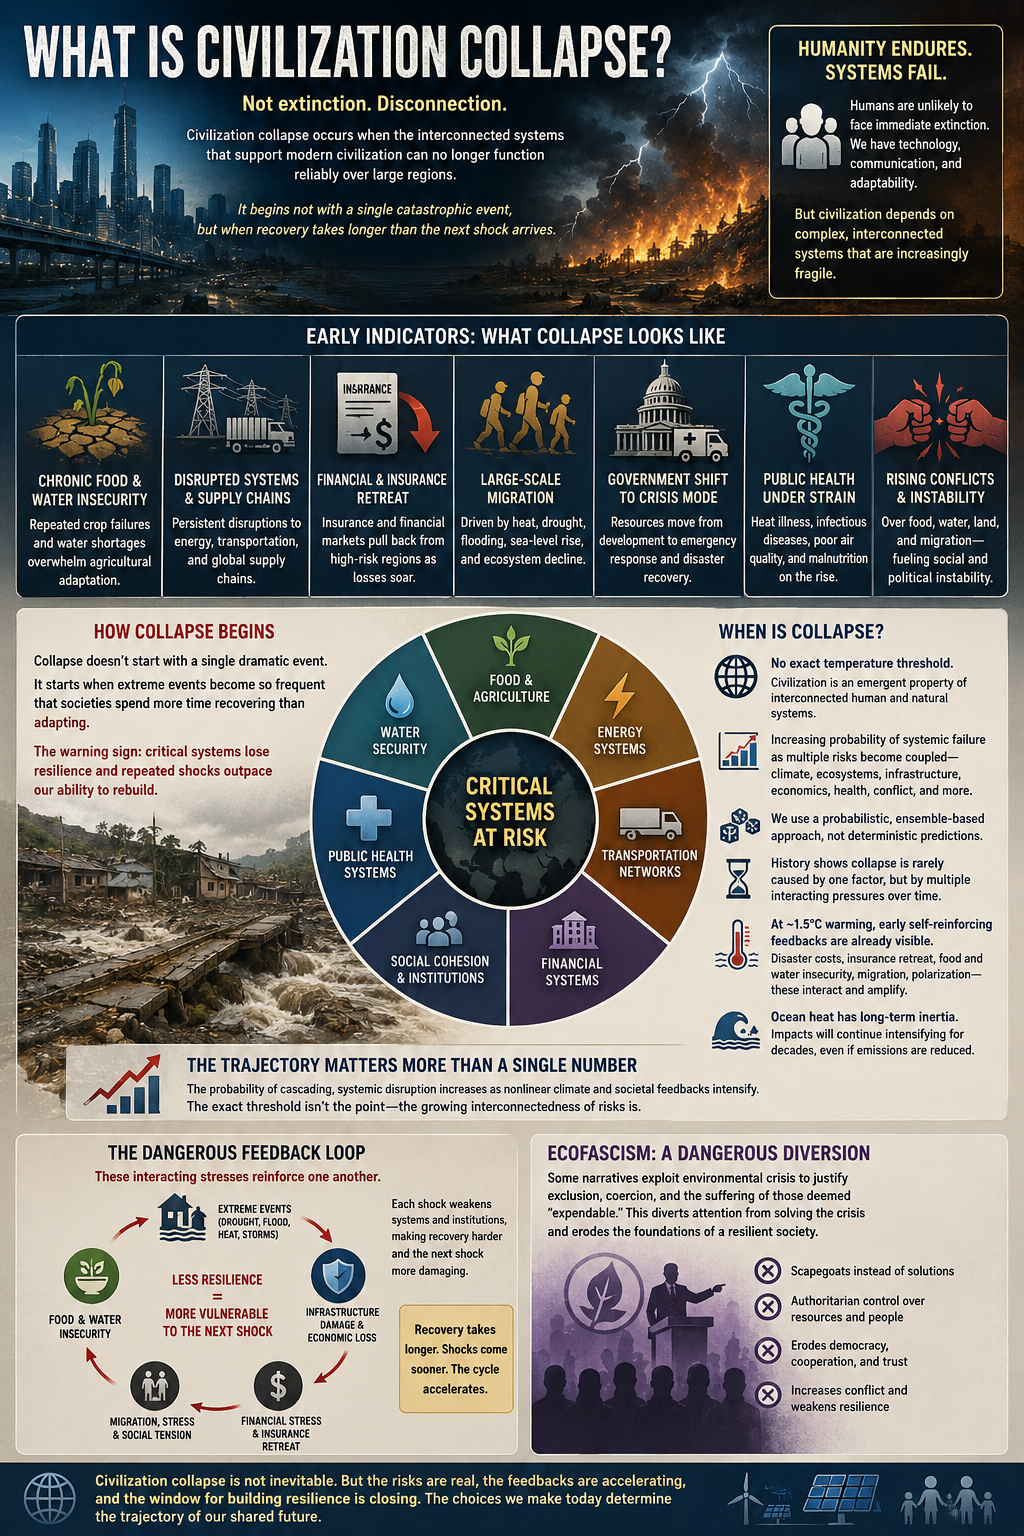
Good question. Civilization collapse does not mean humanity suddenly disappears. It means that the interconnected systems that support modern civilization can no longer function reliably over large regions. Early signs of collapse are already occurring.
Some of these indicators include:
Chronic food insecurity as repeated crop failures and water shortages overwhelm agricultural adaptation.
Persistent disruptions to energy, transportation, and global supply chains.
Insurance and financial markets retreating from high-risk regions because losses become unmanageable.
Large-scale migration driven by heat, drought, flooding, sea-level rise, and ecosystem decline.
Governments increasingly shifting resources from development to emergency response and disaster recovery.
Public health systems struggling with heat illness, infectious diseases, poor air quality, and malnutrition.
Escalating conflicts over food, water, land, and migration.
I don’t think collapse begins with a single dramatic event. It starts when extreme events become so frequent that societies spend more time recovering than adapting. The warning sign is when critical systems lose resilience and repeated shocks outpace our ability to rebuild.
Some of those early indicators are already observable today. The question isn’t whether civilization stops overnight, but whether enough interconnected systems begin failing simultaneously that they reinforce one another. That’s why many researchers focus on cascading risks and coupled feedbacks rather than isolated events.
When Is Collapse?
Signs of disruption and collapse are already becoming visible in many parts of the world.
There isn’t a universally accepted temperature threshold at which civilization “collapses.” Civilization is an emergent property of interconnected human and natural systems, not a single physical variable.
The argument isn’t based on a hard cutoff like “X°C = collapse.” It’s based on the increasing probability of systemic failure as multiple risks become coupled. Climate science provides the physical forcing, while ecology, economics, engineering, public health, and history help us understand how societies respond to repeated, compounding shocks.
That’s why we use a probabilistic, ensemble-based approach rather than deterministic predictions. We aren’t claiming to know the exact year or exact temperature at which civilization fails. We’re evaluating the likelihood that interacting stresses—food and water insecurity, ecosystem degradation, infrastructure failures, migration, financial instability, conflict, and public health crises—begin reinforcing one another faster than societies can adapt.
History shows that civilizations rarely collapse for a single reason. They typically experience multiple interacting pressures that erode resilience over time. Our work extends that systems perspective to a globalized civilization operating within a rapidly changing climate.
In fact, I would argue that we’re already seeing early signs of self-reinforcing societal feedbacks at approximately 1.5°C of warming. Rising disaster costs strain insurance markets, infrastructure, and government budgets. Food and water insecurity contribute to migration and political instability. Repeated extreme events reduce resilience, making recovery from the next disaster more difficult. These interacting pressures don’t constitute “collapse” by themselves, but they are consistent with the early stages of a cascading systemic process.
We also know that the climate system has substantial thermal inertia. The heat already stored in the oceans will continue influencing the climate for decades, even as emissions are reduced. That means many climate impacts will continue to intensify before stabilizing, extending both the duration of environmental stress and the societal challenges associated with adaptation.
So I would frame it less as “civilization collapses at 4°C or 6°C” and more as “the probability of cascading, systemic disruption increases as nonlinear climate and societal feedbacks intensify.” The exact threshold isn’t the point; the trajectory and the growing interconnectedness of the risks are.
Ecofascism
I think we’re already seeing early-stage societal feedbacks emerge. I’m not saying civilization has “collapsed,” but that some of the reinforcing dynamics associated with systemic decline are becoming visible. Financial stress from repeated disasters, insurance retreat, food and water insecurity, migration, political polarization, and declining institutional resilience don’t occur in isolation—they increasingly interact and amplify one another.
One example that concerns me is the emergence of ecofascist narratives. Ecofascism reframes environmental crisis through an authoritarian lens, portraying environmental degradation as justification for exclusion, coercion, or the suffering of groups considered expendable. Rather than focusing on reducing emissions and building resilience, it redirects the conversation toward hierarchy and scapegoating.
Whether we ultimately call this the beginning of “collapse” is partly a matter of definition. What matters to me is recognizing that climate, ecological, economic, and social systems are increasingly coupled. As those feedbacks strengthen, the probability of cascading disruptions rises, even though the exact trajectory remains uncertain.
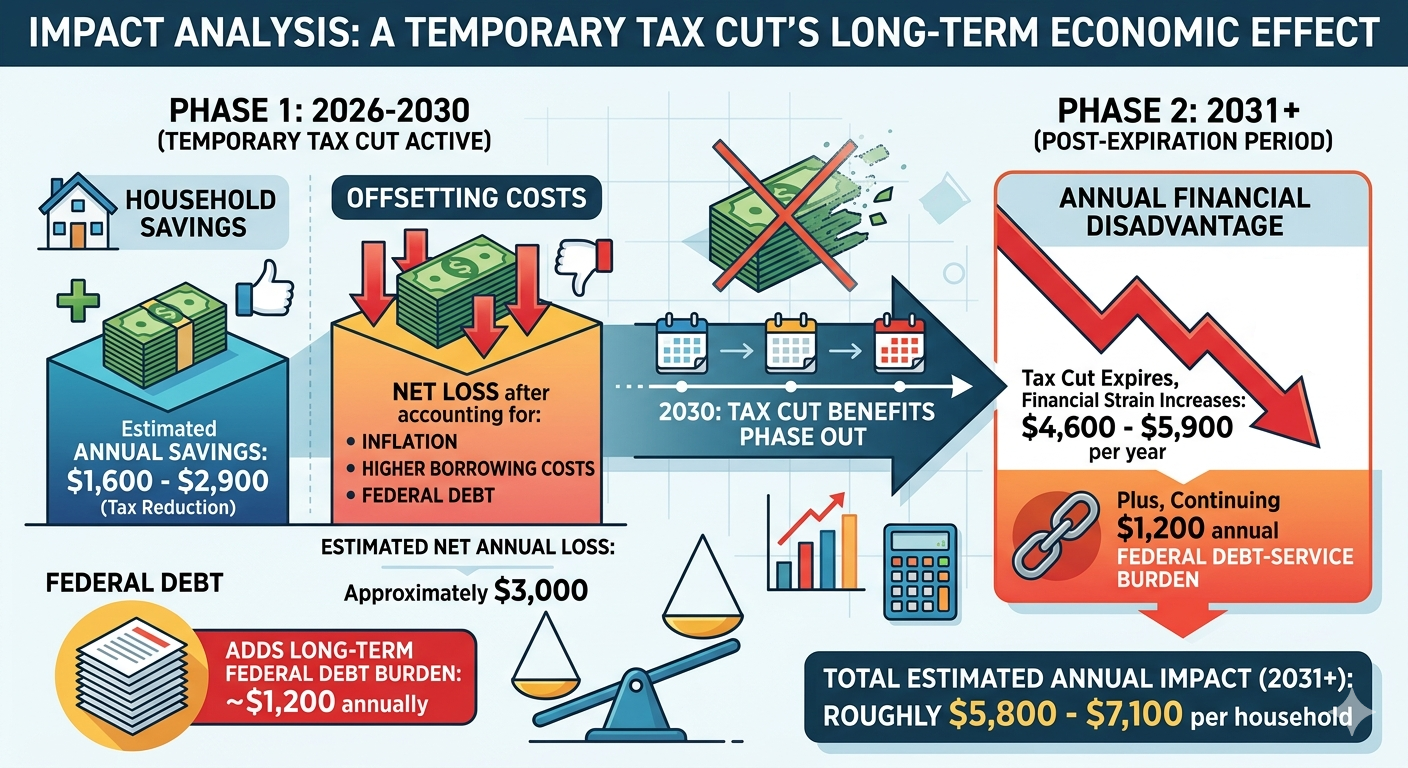
A tax cut that appeared to provide the average household with $1,600–$2,900 in annual savings was more than offset by the broader economic effects of inflation, higher borrowing costs, and increased federal debt. After accounting for these costs, the average household experienced an estimated net loss of approximately $3,000 per year, along with an additional long-term federal debt burden equivalent to roughly $1,200 annually.
However, the tax cut benefits are scheduled to phase out by 2030, meaning households will eventually lose the temporary savings while many of the costs associated with higher debt, interest payments, and elevated borrowing rates remain. Beginning in 2031, when the tax reduction expires, the average household’s annual financial disadvantage could increase to approximately $4,600–$5,900 per year, plus the continuing $1,200 annual federal debt-service burden. This would place the total estimated impact at roughly $5,800–$7,100 per household annually, while the accumulated federal debt continues to shift additional costs onto future taxpayers.
Tax Cuts vs. Inflation: The Hidden Battle Over Household Purchasing Power
Tax cuts are often promoted as a direct way to improve household finances, but for the average American family, inflation can have a much larger and more immediate impact on financial well-being. A tax cut may provide a noticeable boost to income, but a sustained period of elevated inflation can quietly reduce purchasing power by thousands of dollars each year.
For a typical middle-income household, a broad tax reduction might save several hundred to a few thousand dollars annually. However, inflation affects the entire household budget—including housing, groceries, utilities, transportation, healthcare, and services. A 4%–5% annual inflation rate can easily increase household expenses by $3,500–$5,000 per year, effectively overwhelming the benefit of many tax cuts.
The result is a simple economic reality: a dollar gained through tax cuts can be offset—or even erased—by dollars lost through higher prices.
The Mathematical Mismatch: Tax Savings vs. Inflation Costs
Tax Cuts Provide Limited Annual Gains
For most middle-class households, federal tax cuts typically produce moderate savings rather than dramatic changes in disposable income. Historical analyses of broad tax packages, including evaluations by organizations such as the Tax Policy Center, have shown that middle-income families often receive annual tax reductions in the range of roughly $1,600 to $2,900, depending on the structure of the legislation. The most recent tax cuts saved the average household $1,600 and $2,900.
While meaningful, these savings represent only a fraction of a household’s total annual expenses.
Inflation Acts Like a Hidden Tax
Inflation operates differently from taxes. Rather than reducing a paycheck directly, it increases the cost of nearly everything a household buys.
A family spending $80,000 annually on goods and services would experience approximately:
4% inflation: about $3,200 in additional annual costs
5% inflation: about $4,000 in additional annual costs
6% inflation: about $4,800 in additional annual costs
Unlike a tax cut, which may provide a one-time or annual benefit, inflation compounds year after year. Even if wages rise, households can still lose purchasing power if prices increase faster than incomes.
Distribution of Benefits vs. Distribution of Burdens
Tax Cuts Often Deliver Larger Dollar Benefits to Higher-Income Households
Income tax reductions generally scale with taxable income. Higher-income households typically pay more in taxes, so percentage-based tax cuts often produce larger dollar savings at the top.
Analyses from organizations such as the Congressional Budget Office have repeatedly shown that broad tax changes frequently provide the largest absolute benefits to higher-income groups, while middle- and lower-income households receive smaller dollar amounts.
Inflation Disproportionately Hurts Lower- and Middle-Income Families
Inflation is often described as a regressive economic force because it affects essential spending categories that consume a larger share of lower-income household budgets.
A wealthy household can often absorb higher prices by reducing discretionary spending or shifting purchases. A working-class family has fewer options when facing increases in:
Food prices
Rent or mortgage payments
Electricity and heating costs
Gasoline and transportation
Healthcare expenses
For families living close to their monthly budget limits, inflation functions like a pay cut.
The Inflation Feedback Loop
Tax cuts can stimulate economic activity by increasing disposable income. However, if tax reductions are not matched by spending reductions or productivity gains, they can increase demand in an economy already operating near capacity.
The mechanism is straightforward:
Tax cuts increase household disposable income.
Increased income boosts consumer demand.
If supply cannot expand quickly enough, businesses raise prices.
Higher prices reduce the purchasing power of the original tax cut.
In this scenario, households may receive additional money in their paycheck while simultaneously paying more at the grocery store, gas station, and utility bill.
The economic benefit becomes partially or completely offset by rising prices.
The Federal Debt Effect: How Tax Cuts Can Increase Long-Term Costs
Tax cuts also have a broader economic impact beyond the immediate benefit to taxpayers. When tax reductions are not accompanied by equivalent spending reductions or stronger economic growth, they increase the federal budget deficit and add to the national debt. The government must finance that additional debt by issuing more Treasury securities, increasing the supply of government borrowing.
As federal debt rises, the government competes with households and businesses for available capital. This increased demand for borrowed money can place upward pressure on interest rates, raising the cost of mortgages, auto loans, credit cards, business financing, and other forms of credit.
The effect is often indirect but significant. A household may receive a $2,000 annual tax reduction, but if higher federal borrowing contributes to even a modest increase in interest rates, that same family may pay thousands of dollars more over time through:
Higher mortgage rates when purchasing or refinancing a home
Increased interest on auto loans
Higher credit card balances
More expensive consumer financing
Higher costs passed through by businesses borrowing at elevated rates
For example, a 1% increase in mortgage rates on a $300,000 home loan can add roughly $200 per month to a typical 30-year mortgage payment—more than $2,000 annually. Across the economy, higher interest rates also increase the federal government’s own debt-service costs, requiring more taxpayer dollars to pay interest rather than fund public services or reduce future deficits.
This creates a potential feedback loop:
Tax cuts reduce federal revenue.
Larger deficits increase government borrowing.
Higher debt levels put upward pressure on interest rates.
Higher rates increase borrowing costs for households, businesses, and the government.
Additional interest expenses reduce the long-term economic benefit of the original tax cut.
The ultimate measure of a tax policy is therefore not only the size of the immediate tax reduction, but its effect on total household purchasing power after accounting for inflation, interest rates, and the long-term cost of increased federal debt.
The Role of Bracket Creep
Inflation also affects taxation through a process known as bracket creep.
As wages rise due to inflation, taxpayers can unintentionally move into higher tax brackets even though their real purchasing power has not increased. To address this, the Internal Revenue Service adjusts federal income tax brackets, standard deductions, and other thresholds annually for inflation.
These adjustments prevent inflation from automatically increasing a household’s tax burden. However, they do not compensate for the broader loss of purchasing power caused by rising prices.
Inflation indexing protects taxpayers from paying higher taxes simply because of inflation—it does not make groceries, housing, or energy affordable again.
Conclusion: The True Measure Is Total Economic Impact
Tax cuts can provide meaningful benefits to households, but their true economic value cannot be measured by the size of the immediate reduction in a tax bill alone. A complete evaluation must consider the broader effects on purchasing power, inflation, interest rates, and the long-term federal debt burden.
A tax cut may increase disposable income in the short term, but those gains can be diminished or even erased when inflation raises the cost of everyday necessities such as housing, food, energy, and transportation. Unlike a one-time tax reduction, inflation affects the entire household budget and compounds over time, reducing what each dollar can actually buy.
The impact also depends on how tax cuts are financed. When reductions in federal revenue are not matched by spending cuts or sufficient economic growth, they increase budget deficits and add to the national debt. Higher federal borrowing can place upward pressure on interest rates, increasing costs for mortgages, auto loans, credit cards, and business financing. Households may receive additional money through lower taxes while simultaneously paying more through higher borrowing costs and rising prices.
This creates a broader economic equation:
The benefit of a tax cut is not simply the dollars returned to taxpayers—it is the change in real purchasing power after accounting for inflation, interest rates, and future debt obligations.
For some households, especially higher-income taxpayers, tax reductions may provide substantial direct benefits. However, for many middle- and lower-income families, the effects of inflation and higher interest rates can outweigh those gains because they spend a larger share of their income on necessities and borrowing costs.
The ultimate question is therefore not:
“How much did taxpayers save in taxes?”
The more important question is:
“Did households become financially better off after accounting for the full economic consequences?”
A sustainable economic policy must balance tax relief with fiscal responsibility, price stability, and long-term economic growth. Without that balance, a tax cut can create the appearance of increased prosperity while shifting costs into higher prices, higher interest payments, and a larger debt burden for future generations.
ADDENDUM
The exact “net cost” depends on the household’s income, debt exposure, and whether the tax cuts are financed by borrowing. A reasonable estimate can be made by separating immediate annual effects from long-term debt effects.
Estimated Annual Impact on an Average Household
Item
Annual Impact
Tax cut benefit
+$1,600 to +$2,900
4% inflation increase in household expenses
−$3,200
Higher mortgage costs (if buying/refinancing)
−$2,000+
Higher auto loan, credit card, and consumer financing costs
−$500 to −$2,000+
Higher business borrowing costs passed through in prices
−$300 to −$1,000+
Additional federal debt interest burden
−$900 to −$1,500+ annually (estimated)
Short-Term Net Effect (First-Year Estimate)
Lower-cost scenario:
Tax savings: +$2,900
Inflation cost: −$3,200
Consumer borrowing/business costs: −$800
Debt interest effect: −$900
Net impact: approximately −$2,000 per household per year
Higher-cost scenario:
Tax savings: +$1,600
Inflation cost: −$3,200
Mortgage/borrowing costs: −$3,000
Debt interest effect: −$1,500
Net impact: approximately −$6,100 per household per year
Long-Term Federal Debt Effect
If tax cuts add $3–$5 trillion to federal debt:
There are roughly 130 million U.S. households.
The added debt equals approximately:
130 million households$3 trillion≈$23,000 per household130 million households$5 trillion≈$38,000 per household
That does not mean each household receives a bill, but it represents the additional federal liability ultimately supported by taxpayers.
If the government pays roughly 4% interest on that additional debt:
$3 trillion × 4% = $120 billion/year
$5 trillion × 4% = $200 billion/year
Spread across households:
$900–$1,500 per household annually in additional federal interest costs
Over decades, if the debt is refinanced and interest compounds, the total burden can become substantially larger.
Other Potential Costs Associated With Large Tax Cuts
1. Reduced fiscal flexibility
Higher debt can limit the government’s ability to respond to:
recessions
natural disasters
pandemics
military emergencies
infrastructure needs
Future taxpayers may face higher taxes or spending cuts to service the debt.
2. Higher interest rates
Large deficits can increase demand for borrowed funds, putting upward pressure on interest rates. This affects:
mortgages
business loans
student loans
auto loans
government borrowing costs
3. Crowding out private investment
When the government absorbs more available capital:
businesses may invest less
productivity growth can slow
wage growth may weaken over time
4. Inflation risk
If tax cuts increase demand without increasing supply, they can contribute to inflationary pressure, especially when the economy is already near capacity.
Estimated Net Household Effect
Time Frame
Estimated Impact
Immediate annual effect
−$2,000 to −$6,000 per household
Added federal debt liability
+$23,000 to +$38,000 per household
Annual debt-service burden
−$900 to −$1,500 per household/year
Bottom Line
A tax cut that appeared to provide an average household with $1,600–$2,900 in annual savings was far outweighed by the broader economic effects of inflation, higher borrowing costs, and increased federal debt. The average household had a net loss of $3,000 and an additional debt burden of $1,200/year. For many households, the combined impact may represent a net financial loss of several thousand dollars per year, while the long-term debt burden shifts additional costs onto future taxpayers.
Q:“Has Earth ever experienced a climate change with this combination of speed, acceleration, and simultaneous disruption across Earth?”
There is no comparison in the geological record. The present is revealing a system changing at a rate that may be outside the range experienced throughout human civilization and perhaps for millions of years.
Q: “What Are the Immediate Impacts?
A: More extreme weather.
Severe weather is becoming more frequent, more intense, and more persistent, with extreme events lasting longer and affecting larger areas.
Bottom line: We cannot control the laws of physics, but we can control the amount of heat-trapping gases we add to the atmosphere. The most effective action is to phase out fossil fuel combustion as quickly as possible.
Q: What Causes Climate Change?
A: Human activities.
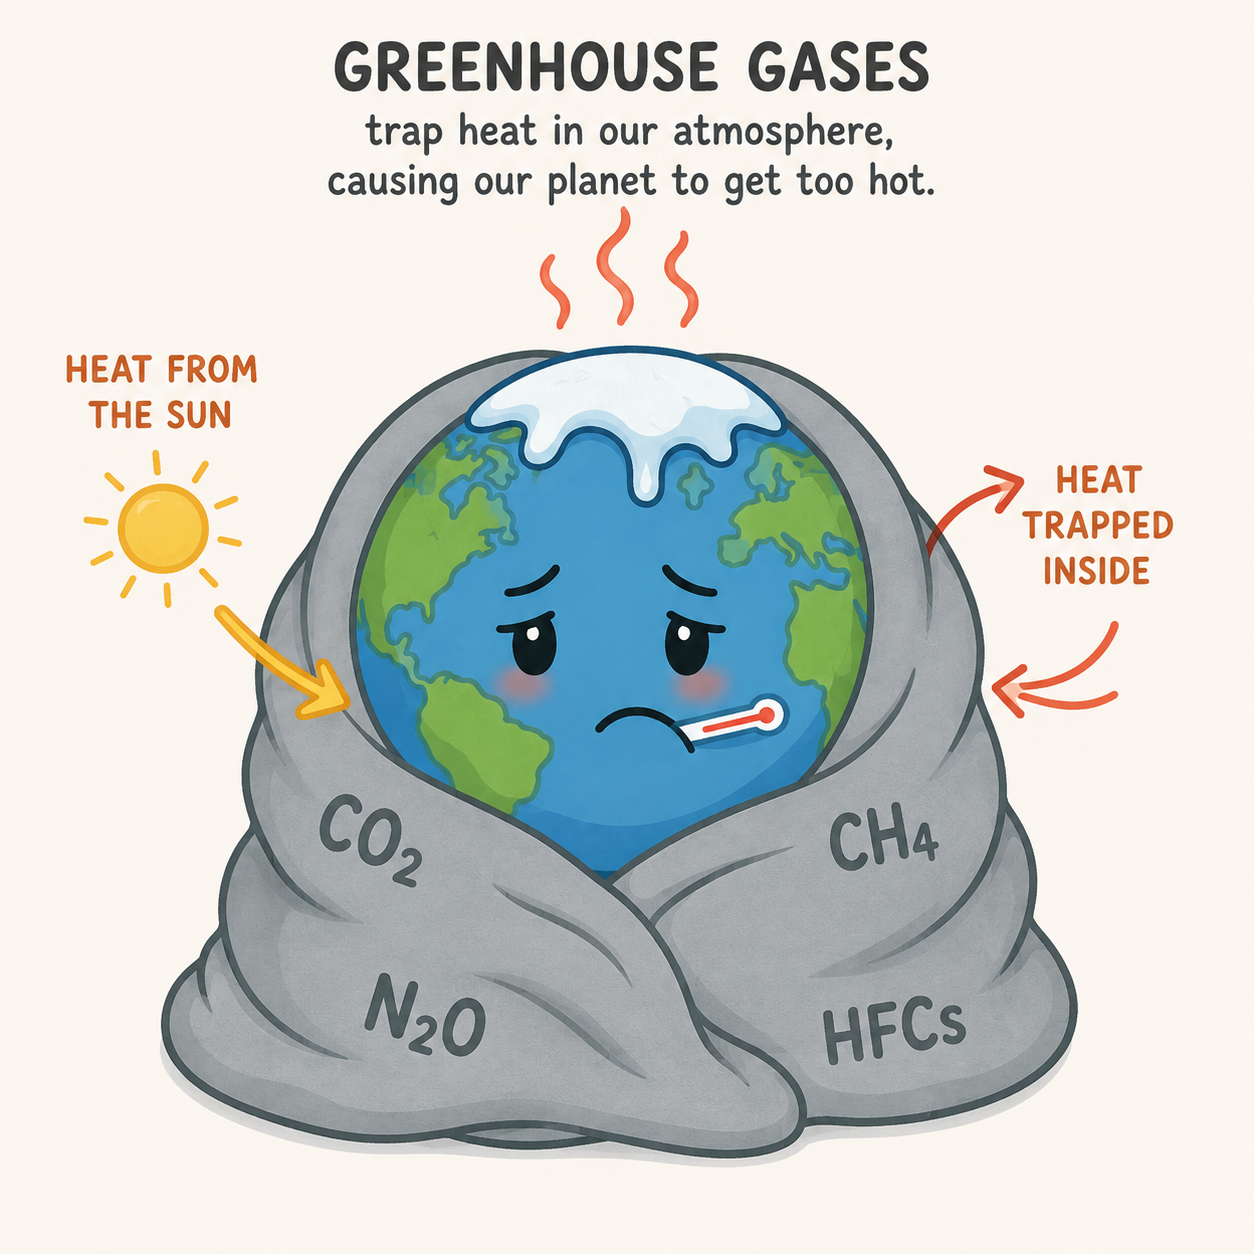
The primary driver of modern global warming is the increase in greenhouse gases released through human activities, especially the burning of fossil fuels. Carbon dioxide (CO2) and other greenhouse gases act like an insulating layer in the atmosphere, absorbing and re-emitting infrared radiation. This slows the loss of heat from Earth to space, creating an energy imbalance that causes the planet to warm.
Q: What Is Climate Change?
A: Climate change is energy transfer.
The phrase “global warming” is often misunderstood. While it correctly describes rising average temperatures, it does not tell the whole story. The real issue is the rapid buildup and movement of extra heat energy throughout Earth’s climate system.
Global warming is the beginning of climate change—not the end of it.
When greenhouse gases trap additional heat, that energy does not simply make the air warmer. It is continually transformed into other forms of energy, including:
Kinetic energy: Stronger winds and more powerful storms.
Gravitational potential energy: Greater vertical motion in the atmosphere and heavier rainfall.
Latent heat: More energy available to fuel hurricanes and atmospheric rivers.
Radiant energy: Increased trapping of infrared heat that amplifies warming.
Chemical energy: Wildfires and other processes that release additional greenhouse gases.
Electrical energy: More lightning in highly energetic thunderstorms.
More than 90% of this excess heat is absorbed by the oceans, not the atmosphere. The oceans act like a giant heat reservoir, storing energy and releasing it slowly over time. Because of this thermal inertia, the climate can continue changing even if emissions begin to decline.
By 2025, global temperatures had exceeded the long-recognized 1.5°C (2.7°F) warming threshold. To many people, an increase of 1.5°C may sound small. In Earth’s climate system, it is not.
Small increases in average temperature can produce much larger changes in temperature differences, air pressure, and atmospheric moisture. These changes alter weather patterns, intensify storms, increase heavy rainfall, and make many extreme events more severe.
What we are witnessing are not simply isolated weather events. They are increasingly extreme energy events occurring within an interconnected Earth system.
To understand climate change, it helps to think not only in terms of degrees of warming, but also in terms of joules of energy and how that energy moves through the atmosphere, oceans, ice, and living ecosystems.
Q: How Fast Is the Climate Changing?
A: The climate appears to be changing at an exceptionally rapid pace—faster than at any time in human history and possibly faster than at any time in the past several million years.
Many past climate transitions unfolded over centuries, thousands of years, or longer. The modern climate system is experiencing simultaneous changes across the atmosphere, oceans, cryosphere, and biosphere over time scales measured in decades.
Climate change is often measured in degrees, but degrees alone cannot describe the full magnitude of the transformation now underway. The defining feature of the modern climate system is not simply that Earth is warmer than it was in the past, but that multiple components of the Earth system are changing simultaneously at rates that challenge the ability of natural systems, ecosystems, and human societies to adapt.
Historical climate records remain essential for understanding how the planet responds to changes in energy balance. However, the current climate trajectory represents a fundamentally different challenge: a rapidly accelerating transition occurring across the atmosphere, oceans, cryosphere, and biosphere within decades rather than centuries or millennia. The question is no longer only how much the climate has changed, but how quickly the rate of change itself is increasing and how those changes interact through a highly connected planetary system.
The past reveals what climate systems can do.
The present is revealing a system changing at a rate that may be outside the range experienced throughout human civilization and perhaps for millions of years.
Beyond Temperature: What Climate Change Really Means
Climate change is often framed around a simple comparison:
How much colder were ice ages than the climate before the Industrial Revolution?
While historical temperature comparisons remain scientifically important, they no longer capture the most significant feature of modern climate change.
The more important question today is:
Has Earth ever experienced a climate transition with this combination of speed, acceleration, and simultaneous disruption across so many interconnected systems?
Based on modern observations, there is no clear geological example of a sustained, decade-scale acceleration occurring simultaneously across numerous components of the Earth system. Rising temperatures are occurring alongside accelerating changes in oceans, ice sheets, ecosystems, atmospheric moisture, and extreme weather patterns. It is this convergence of rapid changes—not temperature alone—that defines the modern climate era. This may represent the most rapid large-scale climate change event in Earth’s history, based on the rate and simultaneous disruption now being observed across multiple interconnected Earth systems.
The Growing Risk of Ecosystem Collapse
Humans are unlikely to face immediate extinction under foreseeable climate scenarios. Our species possesses technological capabilities, global communication networks, and a remarkable ability to adapt to changing conditions.
Many other species, however, do not have those advantages.
The greatest biological danger posed by rapid climate change is not a single catastrophic event. It is the gradual breakdown of ecosystems that support biodiversity, food production, and the stability of the biosphere itself.
Research increasingly shows that climate-driven local extinctions are accelerating. Some temperate regions have experienced unexpectedly high biodiversity losses associated with rapidly increasing temperature extremes. In certain areas, maximum temperatures have risen by approximately 6°F (3.3°C) in only about 25 years, creating environmental conditions that exceed the ability of many species to adapt or migrate.
Ecosystems Already Showing Signs of Stress
Several major ecosystems are exhibiting characteristics consistent with ecological disruption and increasing instability:
Global Coral Reefs: Marine heatwaves and ocean acidification are causing repeated mass bleaching events and widespread mortality.
The Amazon Rainforest: Increasing drought, heat, and deforestation are reducing resilience and raising concerns about large-scale ecosystem transformation.
Oceanic Kelp Forests: Rising ocean temperatures and marine heatwaves are causing extensive losses of kelp ecosystems that support diverse marine life.
The Arctic Tundra: Rapid warming, thawing permafrost, and shifting vegetation are fundamentally altering one of Earth’s most climate-sensitive regions.
Species Most Vulnerable to Continued Warming
Some groups of organisms appear particularly vulnerable because they occupy narrow ecological niches or depend on highly synchronized environmental conditions.
Among the most at-risk are:
Temperate freshwater species
Marine shellfish and pteropods
Migratory birds
Insects
Great apes
The loss of these organisms can have consequences far beyond individual extinctions because each species is connected to larger ecological networks.
The Real Threat: Losing Ecological Stability
The defining danger of rapid climate change is not simply that individual species cannot survive warmer temperatures.
The larger threat is that entire networks of life are being pushed beyond their capacity to adjust.
Ecosystems depend on timing, balance, and intricate relationships that evolved over millions of years. Plants flower at specific times to coincide with pollinators. Predators and prey maintain dynamic balances. Migratory species depend on seasonal cues that have remained relatively stable throughout human history.
When climate change occurs faster than evolution, migration, and adaptation can respond, ecosystems do not smoothly transition to new conditions. Instead, they experience disruption, cascading losses, and fundamental reorganization.
The result is not merely a warmer planet. It is the transformation of the biosphere itself.
The Global Insect Collapse: An Early Warning Signal
One of the clearest indicators of accelerating ecological disruption is the worldwide decline of insect populations.
Insects form the biological foundation of most terrestrial ecosystems. They pollinate crops and wild plants, decompose organic material, recycle nutrients, and provide food for countless birds, fish, amphibians, reptiles, and mammals.
Scientific studies paint a concerning picture:
More than 40% of known insect species are experiencing population declines.
Approximately one-third of insect species are considered threatened with extinction over the coming decades.
Long-term analyses suggest that global insect abundance has fallen by roughly 45% over the past 40 years.
The United Nations has reported that insects are disappearing at rates estimated to be eight times faster than mammals, birds, or reptiles.
Because insects support so many ecological processes, their decline serves as an early warning signal of broader ecosystem instability. Reduced pollination, disrupted food webs, and diminished nutrient cycling can trigger cascading effects that extend throughout the biosphere.
Climate Change Is About More Than Degrees
Climate change is often discussed in terms of global average temperature—1°C, 2°C, or 3°C of warming. But the defining characteristic of the modern climate system is not simply how warm the planet becomes.
It is the unprecedented pace of change and the simultaneous disruption occurring across interconnected physical and biological systems.
The central question of climate change is therefore no longer:
“How different is today’s temperature from the past?”
The more consequential question is:
“How do ecosystems and societies respond when multiple Earth systems begin changing faster than they can adapt?”
The answer to that question may determine not only the future of individual species, but the stability of the biosphere upon which human civilization ultimately depends.
Conclusion
The question is no longer how warm the planet becomes, but how life on Earth can endure when change outpaces our ability to adapt.
Bottom line: We cannot control the laws of physics, but we can control the amount of heat-trapping gases we add to the atmosphere. The most effective action is to phase out fossil fuel combustion as quickly as possible.
Feedback Loops → Tipping Points → Acceleration → Domino Effect Feedback loops amplify climate change and can push interconnected Earth systems past critical tipping points. As tipping points are crossed, they can trigger additional feedback loops and destabilize other climate systems. This cascading “Domino Effect” compresses timescales, accelerates change, and increases the risk of rapid, nonlinear climate transformations.
The unexpectedly rapid release of more than $100 billion in tariff refunds is likely amplifying an already sharp increase in U.S. imports, contributing to a much wider trade deficit reported today by the Bureau of Economic Analysis.
According to the U.S. Bureau of Economic Analysis (BEA), the international trade deficit jumped 42.2% to $77.6 billion in May, up from a revised $54.6 billion in April. Imports climbed 3.3% to $395.3 billion, while exports fell 3.2% to $317.7 billion.
While businesses also accelerated purchases ahead of potential new tariffs and supply chain disruptions, the rapid release of tariff refunds appears to have become a major source of liquidity that enabled importers to dramatically increase orders from overseas.
Tariff Refunds Are Moving Much Faster Than Expected
The current refund program stems from the February 2026 U.S. Supreme Court ruling that invalidated many emergency tariffs imposed under the International Emergency Economic Powers Act (IEEPA). Since then, U.S. Customs and Border Protection (CBP) has been processing one of the largest customs refund programs in U.S. history.
The pace of payments has exceeded many expectations:
Approximately $166 billion in refund claims have been filed.
More than $104.3 billion has already been accepted.
Roughly $71 billion has been finalized and paid.
On June 29, CBP launched Phase 2 of its automated CAPE refund portal to process an additional 2.8 million older and more complex import entries.
The unexpectedly rapid return of more than $100 billion to importers has significantly improved corporate cash flow, allowing companies to replenish inventories and increase imports almost immediately.
Refund Liquidity Is Expanding the Trade Deficit
The refund process has created a powerful economic chain reaction:
More than $104 billion in accepted refund claims → Increased importer liquidity → Accelerated foreign purchasing → Larger U.S. trade deficit
Instead of remaining tied up in government accounts, tariff revenue is now flowing back into corporate balance sheets, enabling businesses to front-load imports while attempting to stay ahead of replacement tariff policies.
Tariff Revenue Has Effectively Disappeared
The refund program is also dramatically reducing federal customs revenue.
In May 2026, the U.S. Treasury paid out $21.97 billion in tariff refunds while collecting $21.93 billion in gross customs duties. The result was a net customs outflow of approximately $42 million, effectively eliminating tariff revenue for the month.
Growing Pressure on the Federal Budget
The reversal from collecting tariffs to issuing massive refunds is widening the federal fiscal deficit.
Because tariffs had become a significant source of government revenue, refunding those collections represents both a loss of expected receipts and a substantial increase in federal expenditures.
Moody’s Analytics estimates the immediate fiscal impact could exceed $133 billion.
The Congressional Budget Office (CBO) projects that related policy changes could increase federal deficits by roughly $2 trillion over the next decade.
Consumers See Little Benefit
Although corporations are receiving billions in refund payments, consumers are unlikely to see corresponding price reductions.
Several major retailers—including Nike, Amazon, and Costco—are facing class-action lawsuits alleging they retained tariff-related price increases while also receiving refund payments, allowing them to benefit from both higher prices and government reimbursements.
New Tariffs Could Offset the Windfall
Following the Supreme Court decision, the U.S. Trade Representative introduced new tariffs under alternative statutory authorities, including Section 122 and Section 301.
Many importers warn that these replacement tariffs could quickly erode the financial gains created by the current refund program. In the meantime, however, the rapid pace of tariff refunds is injecting substantial liquidity into import markets, contributing to a wider trade deficit and placing additional pressure on the federal budget.