bookmark_borderCatastrophic Impacts of Climate Change

A study by University College London (UCL) concludes we heave severely underestimated the health impacts of global warming. “The frequency and intensity of extreme weather events will dramatically increase.”

“In essence, whether we respond to “the biggest global health threat of the 21st century” is no longer a technical or economic question — it is political. An effective international agreement will be one that supports stronger efforts everywhere and at every level,” the report says.

The Business Insider reports, “The direct health impacts will come from heat waves, floods, droughts and storms, but the indirect impacts, such as changes in infectious disease patterns, pollution, malnutrition, mass migrations, and conflicts will be just as impactful.”

“Our analysis clearly shows that by tackling climate change, we can also benefit health, and tackling climate change in fact represents one of the greatest opportunities to benefit human health for generations to come,” Commission co-Chair Professor Anthony Costello, Director of the UCL Institute for Global Health told UCL News.

“The difficulty, essentially, is ourselves: the tendency of humans to ignore or discount unpleasant facts or difficult choices, the nature of companies and countries to defend their own rather than collective interests and the narrow, short term horizons of most human institutions, which feed into the difficulties of global negotiations,” the report concludes.

bookmark_border12.5 Million Dead Trees in California

CALIFORNIA — In a survey conducted by the U.S. Forest Service, they found the severe drought in California has caused the death of over 12 million trees.

California is in its third year of drought. In 2014, a large increase in tree mortality was observed, especially in the Central Coast and Southern Sierra Ranges. Ground observations noted a continued increase in mortality after the 2014 surveys were flown in July. Early season aerial surveys were conducted in the spring of 2015 in response to the continuing drought and the resulting tree mortality. Another early survey over portions of Southern California was flown the week of April 6th.
• More than 4.1 million acres were surveyed; covering western portions of Stanislaus, Sierra and Sequoia National Forests and Yosemite and Sequoia – Kings Canyon National Parks. The Tehachapi Range and nearby private lands were also surveyed.
• In general mortality was quite severe in many pine species especially in ponderosa and pinyon at lower elevations and more southern areas.
• Along thefoothills mortality was often widespread and severe especially in ponderosa but also gray pine and likely blue and live oak. It unknown if the oaks that were mapped were truly dead or had died back/defoliated due to the drought.
• On the Stanislaus, mortality was scattered in northern areas, but pockets of severe ponderosa and other pine mortality were seen in the  southern low areas. Mortality roughly doubled since July 2014 in the areas of the Stanislaus that were resurveyed this spring.
• At higher elevations conifer mortality was scattered. The survey was too early to detect full extent of mortality levels and anemic levels of snow were common.
• On the Sierra and Sequoia NF pine mortality, mostly from western pine beetle, was common and severe almost everywhere at lower elevations. Estimated number of trees killed on these two Forests together exceeded 5 million. Only about 300,000 trees were estimated killed last year in the same area.
• Southeastern portions of the Sequoia NF and Wilderness areas further east were also flown and widespread, at times, intense pinyon mortality was observed.
• On the Tehachapi Range and on private lands along the foothills of the Sierras, extensive areas of pine mortality were common. Large areas of oak mortality was also suspect.
Dead Pine Trees in California

bookmark_borderDesalination

by Daniel Brouse

San Diego County — As drinking water becomes scarcer, desalination will become a rising trend. California is experiencing an extended drought. San Diego County is building a $1 billion desalination plant.

Fresh drinking water will become a larger battle ground as it becomes shorter in supply. Global warming is causing contamination in large fresh water supplies. For example:
Flooding causes sewage treatment plants and other toxic spills to be dispersed.
Droughts cause an obvious shortage of water.
Rising sea water causes salinization. Salt destroys the soil and the drinking water.

San Diego has already seen the need for drinking water. “It was not an easy decision to build this plant,” said Mark Weston, chairman of the agency that supplies water to San Diego County. “But it is turning out to be a spectacular choice. What we thought was on the expensive side 10 years ago is now affordable.”

Since much of the world’s fresh water problems are becoming more severe due to global warming, it is ironic that the plant will use huge amounts of electricity adding to the problem. There is also concern over what the plant will do to sea life. What happens to plants and animals in the 50 million gallons of water a day? “Fish and other marine organisms are killed on the intake screens (impingement); organisms small enough to pass through, such as plankton, fish eggs, and larvae, are killed during processing of the salt water.” [Heather Cooley, Newsha Ajami, Matthew Heberger, The Pacific Institute December 11, 2013]

“Our position is that seawater desalination should be the option of last resort,” said Sean Bothwell, an attorney with the California Coastkeeper Alliance, an environmental coalition that has battled California’s turn toward the technology. “We need to fully use all the sustainable supplies that we have available to us first.”

As the sea level rises, more fresh water sources will become brackish at the same time as extreme weather events will cause extraordinary droughts. It’s a fresh water double whammy.

Reference: The New York Times 2015/04/12

UPDATE:

Claude “Bud” Lewis Carlsbad Desalination Plant – Wikipedia

https://en.wikipedia.org/wiki/Claude_%22Bud%22_Lewis_Carlsbad_Desalination_Plant

The Claude “Bud” Lewis Carlsbad Desalination Plant is a desalination plant that opened on December 14, 2015 in Carlsbad, California, adjacent to the north end of the Encina Power Station. The San Diego County Water Authority (SDCWA), the recipient of the fresh …. “$1-billion desalination plant, hailed as model for state, opens in Carlsbad”.

bookmark_borderSave the Monkey Puzzle Tree

Wildfires in Chile are threatening the Monkey Puzzle trees (Araucaria araucana) some of which are over a thousand years old. Chile has been in an 8 year drought that is largely blamed on global warming.

“Faced with this critical situation, there is no choice but to assume that the lack of water resources is a reality that is here to stay and that puts at risk the development of important regions of our country” President Bachelet said.

The BBC reports, “Scientists in Chile say they are expecting rainfall to drop significantly by 2050 as the country is increasingly affected by climate change. ”

bookmark_borderChina And Climate Change

In a unique statement, the ranking weather official for China has come out publicly about global warming.  The BBC reports:
Climate change could have a “huge impact” on China, reducing crop yields and harming the environment, the country’s top weather scientist has warned, in a rare official admission. Zheng Guogang told Xinhua news agency that climate change could be a “serious threat” to big infrastructure projects.

He said temperature rises in China were already higher than global averages.

China, the world’s biggest polluter, has said its emissions of gases that cause climate change will peak by 2030. However, the country has not set a specific target for cutting emissions of the gases, mainly carbon dioxide.

‘Emphasise climate security’
Mr Zheng, the head of China’s meteorological administration, said warming temperatures exposed his country to a growing “risk of climate change and climate disasters”. He said temperature rises in China had already been higher than the global average for the past century.

These are rare admissions from a Chinese official, BBC Asia analyst Michael Bristow says. China’s leaders have acknowledged the damage from global warming but they usually do not lay out the full scale of the problems.


bookmark_borderCalifornia Running Dry

CALIFORNIA — Jay Famiglietti, a senior water scientist at the NASA Jet Propulsion Laboratory in California said, “As our ‘wet’ season draws to a close, it is clear that the paltry rain and snowfall have done almost nothing to alleviate epic drought conditions. January was the driest in California since record-keeping began in 1895. Groundwater and snowpack levels are at all-time lows. We’re not just up a creek without a paddle in California, we’re losing the creek too.

As difficult as it may be to face, the simple fact is that California is running out of water — and the problem started before our current drought. NASA data reveal that total water storage in California has been in steady decline since at least 2002, when satellite-based monitoring began, although groundwater depletion has been going on since the early 20th century.

Right now the state has only about one year of water supply left in its reservoirs, and our strategic backup supply, groundwater, is rapidly disappearing. California has no contingency plan for a persistent drought like this one (let alone a 20-plus-year mega-drought), except, apparently, staying in emergency mode and praying for rain.”

bookmark_borderClimate-related Health Risks

The World Health Organization calls for stronger action on climate-related health risks:

“The evidence is overwhelming: climate change endangers human health,” says Dr Margaret Chan, WHO Director-General. “Solutions exist and we need to act decisively to change this trajectory.”

Previously unrecognized health benefits could be realized from fast action to reduce climate change and its consequences. For example, changes in energy and transport policies could save millions of lives annually from diseases caused by high levels of air pollution. The right energy and transport policies could also reduce the burden of disease associated with physical inactivity and traffic injury.

Measures to adapt to climate change could also save lives around the world by ensuring that communities are better prepared to deal with the impact of heat, extreme weather, infectious disease and food insecurity.

Cholera, malaria and dengue highly sensitive to weather and climate

WHO and its partners highlight the importance of acting now to help protect health in the present as well as the future. The health community is working hard to improve its capacity for surveillance and control of infectious diseases such as cholera, malaria and dengue, which are highly sensitive to weather and climate.

Climate change is already causing tens of thousands of deaths every year from shifting patterns of disease, from extreme weather events, such as heat-waves and floods, and from the degradation of water supplies, sanitation, and impacts on agriculture, according to the most recent WHO data.

“Vulnerable populations, the poor, the disadvantaged and children are among those suffering the greatest burden of climate-related impacts and consequent diseases, such as malaria, diarrhoea and malnutrition, which already kill millions every year”, notes Dr Flavia Bustreo, WHO Assistant Director-General, Family, Women’s and Children’s Health. “Without effective action to mitigate and adapt to the adverse effects of climate change on health, society will face one of its most serious health challenges,” she says.

“But the good news is that reducing climate change can yield substantial and immediate health benefits” says Dr Maria Neira, WHO Director, Department of Public Health, Environmental and Social Determinants of Health. “The most powerful example is air pollution, which in 2012 was responsible for 7 million deaths – one in eight of all deaths worldwide. There is now solid evidence that mitigating climate change can greatly reduce this toll,” she adds.

bookmark_borderStrange July Weather

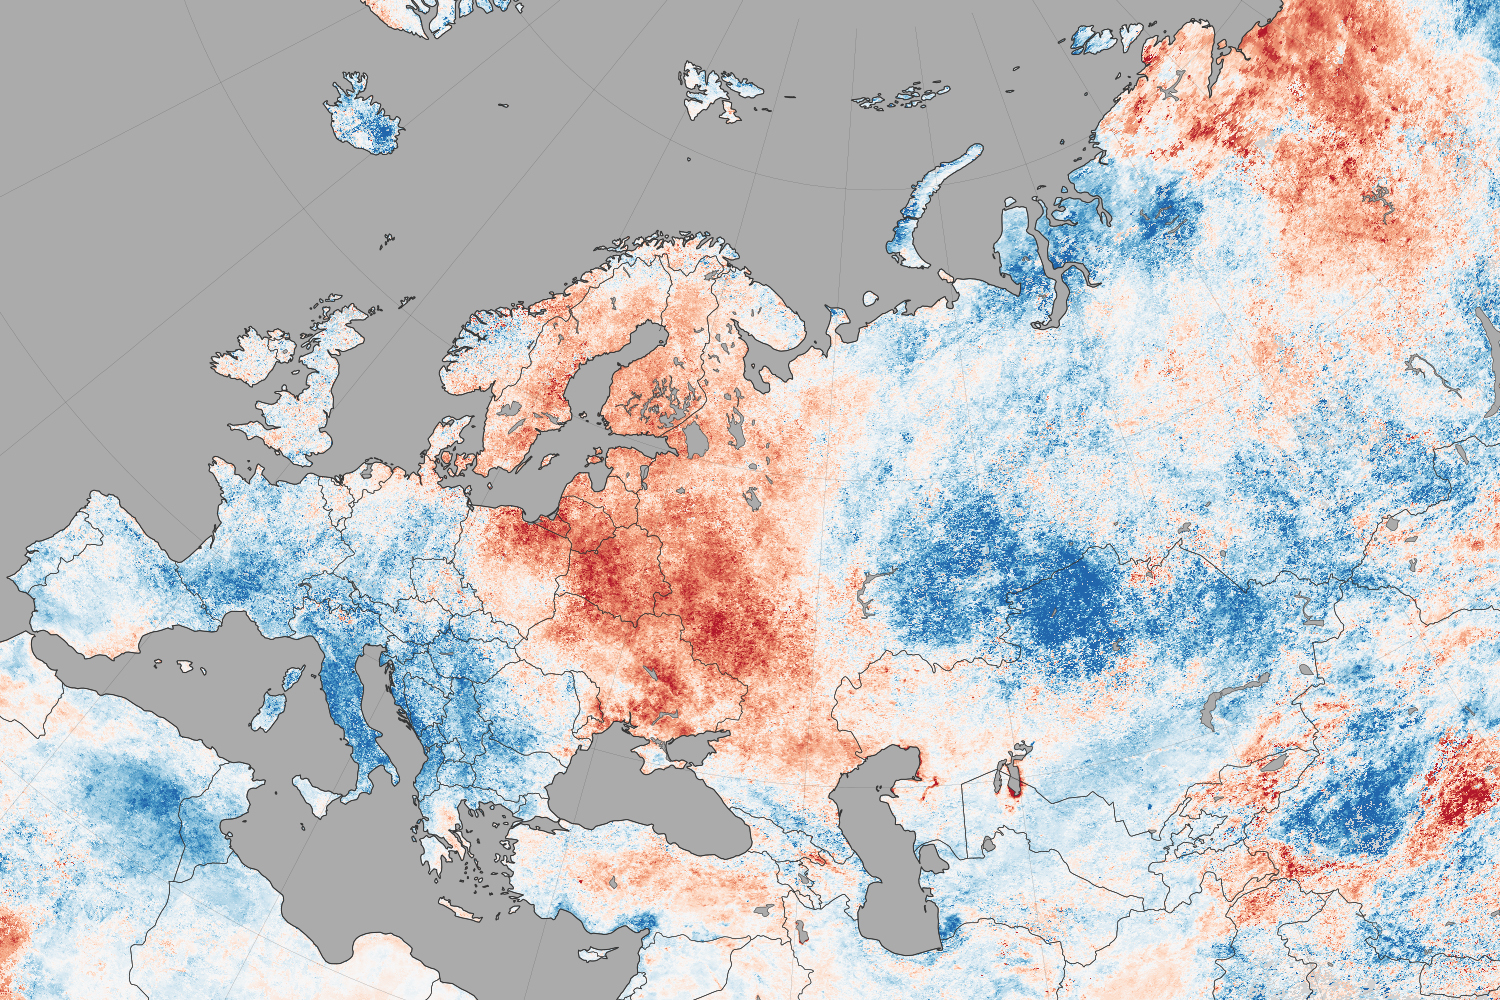
NASA reports that North America weather patterns for July 2014 were upside down:

If you live in the northern hemisphere, the past few weeks have been strange. In places where it should be seasonably hot—the eastern and southern United States and western Europe—it’s just been warm. In places where weather is usually mild in the summer—northern Europe, the Pacific coast of North America—it has been ridiculously hot.

Records for high temperatures (mid-30s°C, mid-90s°F) were approached or broken in Latvia, Poland, Belarus, Estonia, Lithuania, and Sweden in late July and early August. Searing temperatures also dried out forests and fueled wildfires in Siberia; in the U.S. states of Oregon, Washington, and California; in the Canadian provinces of British Columbia, Alberta, and Northwest Territories; and even in Sweden. At the same time, cool air moved from high northern latitudes into much of the U.S., setting record-low daytime and nighttime temperatures as far south as Florida and Georgia. Temperatures dropped to the winter-like levels in the mountains of Tennessee.

The maps on this page shows land surface temperature (LST) anomalies for July 27–August 3, 2014. They were built from data collected by the Moderate Resolution Imaging Spectroradiometer (MODIS) on NASA’s Aqua satellite, and the 2014 data is compared to the average for the same week as observed from 2005–2013. You can visit NASA Earth Observations for a view of temperature anomalies for the entire month of July.

Unusual July Temperatures

Color bar for Unusual July Temperatures

Observed by satellites uniformly across the entire globe, land surface temperatures are a measure of the amount of infrared energy (thermal radiance) emitted by Earth’s surface as it is heated by daylight and cooled in the dark of night. LSTs are sometimes referred to as land “skin” temperatures, and indeed they are a reflection of how hot a surface would feel to the touch. LST anomalies, as shown on this page, are not absolute temperatures; instead, they show how much temperatures were above or below the average. The darkest reds show areas that were as much as 10°C (20°F) above the norm; blues show areas that were below normal; light gray depicts areas with incomplete data (often due to cloud cover, such as in the area of the Indian monsoon); dark gray is ocean.

Meteorologists saw several possible and related causes for the heat waves and cooling patterns. High pressure systems over Scandinavia and northern Russia, as well as over the Pacific Northwest of North America, allowed stable air masses to build up heat domes and “block” incoming fronts that could bring changes in winds, precipitation, and temperatures. These blocking patterns worked together with unusual bends and meanders in the jet stream, which took on a see-sawing north-south pattern over the northern hemisphere. The jet moved air northward over the Pacific Ocean and warmed northwest Canada and the west coast of the U.S.; it dove south from cooler areas of Canada into the central and eastern U.S.; and it drove warm Atlantic air north into northern Europe. The jet took a similar north-south zig-zag in western and eastern Siberia. This pattern is more common in winter than in summer.

bookmark_borderConsequences Of Climate Change

NASA scientists warn:

Global climate change has already had observable effects on the environment. Glaciers have shrunk, ice on rivers and lakes is breaking up earlier, plant and animal ranges have shifted and trees are flowering sooner.

Effects that scientists had predicted in the past would result from global climate change are now occurring: loss of sea ice, accelerated sea level rise and longer, more intense heat waves.

Scientists have high confidence that global temperatures will continue to rise for decades to come, largely due to greenhouse gasses produced by human activities. The Intergovernmental Panel on Climate Change (IPCC), which includes more than 1,300 scientists from the United States and other countries, forecasts a temperature rise of 2.5 to 10 degrees Fahrenheit over the next century.

According to the IPCC, the extent of climate change effects on individual regions will vary over time and with the ability of different societal and environmental systems to mitigate or adapt to change.

The IPCC predicts that increases in global mean temperature of less than 1.8 to 5.4 degrees Fahrenheit (1 to 3 degrees Celsius) above 1990 levels will produce beneficial impacts in some regions and harmful ones in others. Net annual costs will increase over time as global temperatures increase.

“Taken as a whole,” the IPCC states, “the range of published evidence indicates that the net damage costs of climate change are likely to be significant and to increase over time.” 1

Below are some of the regional impacts of global change forecast by the IPCC:

  • North America: Decreasing snowpack in the western mountains; 5-20 percent increase in yields of rain-fed agriculture in some regions; increased frequency, intensity and duration of heat waves in cities that currently experience them.2
  • Latin America: Gradual replacement of tropical forest by savannah in eastern Amazonia; risk of significant biodiversity loss through species extinction in many tropical areas; significant changes in water availability for human consumption, agriculture and energy generation.3
  • Europe: Increased risk of inland flash floods; more frequent coastal flooding and increased erosion from storms and sea level rise; glacial retreat in mountainous areas; reduced snow cover and winter tourism; extensive species losses; reductions of crop productivity in southern Europe.4
  • Africa: By 2020, between 75 and 250 million people are projected to be exposed to increased water stress; yields from rain-fed agriculture could be reduced by up to 50 percent in some regions by 2020; agricultural production, including access to food, may be severely compromised.5
  • Asia: Freshwater availability projected to decrease in Central, South, East and Southeast Asia by the 2050s; coastal areas will be at risk due to increased flooding; death rate from disease associated with floods and droughts expected to rise in some regions.6

Global Climate Change: Recent Impacts7

Phenomena Likelihood that trend occurred in late 20th century
Cold days, cold nights and frost less frequent over land areas Very likely
More frequent hot days and nights Very likely
Heat waves more frequent over most land areas Likely
Increased incidence of extreme high sea level * Likely
Global area affected by drought has increased (since 1970s) Likely in some regions
Increase in intense tropical cyclone activity in North Atlantic (since 1970) Likely in some regions

* Excluding tsunamis, which are not due to climate change.

Global Climate Change: Future Trends8

Phenomena Likelihood of trend
Contraction of snow cover areas, increased thaw in permafrost regions, decrease in sea ice extent Virtually certain
Increased frequency of hot extremes, heat waves and heavy precipitation Very likely to occur
Increase in tropical cyclone intensity Likely to occur
Precipitation increases in high latitudes Very likely to occur
Precipitation decreases in subtropical land regions Very likely to occur
Decreased water resources in many semi-arid areas, including western U.S. and Mediterranean basin High confidence

bookmark_borderSwimming In Ice Cubes

Air temperatures in the states and provinces around the Great Lakes suggest that meteorological summer has arrived. But the icy grip of winter is lingering in cool water temperatures and drifting chunks of ice. For nearly seven months, ice has been afloat somewhere on the Great Lakes, an ice season longer than anything in the satellite records and in anyone’s memory. In an average year, the lakes are ice free by late April or early May.

As recently as May 20, 2014, Lake Superior was still nearly 7 percent ice covered; on June 3, it was 1.3 percent. The ice was concentrated mostly in the far western and southern parts of the lake—even as air temperatures onshore approached 80 degrees Fahrenheit (27 degrees Celsius) on some days. In the second week of June, boaters, fishermen, and scientists were still capturing photos of ice chunks in the water, though the Great Lakes Environmental Research Laboratory officially declared the region to be effectively ice free for the sake of shipping interests.

The Operational Land Imager (OLI) on the Landsat 8 satellite captured the top image on May 23, 2014, the start of Memorial Day weekend (and unofficial start of summer in the United States). The second image was acquired on June 8, 2014. Both show Lake Superior near Chequamegon Bay, Wisconsin, about 60 miles east of Duluth, Minnesota. The bay lies near the western end of Lake Superior, which is bounded by the American states of Wisconsin, Michigan, and Minnesota and by Canada’s Ontario Province. Turn on the image comparison tool to see the changes in ice cover and river sediment outflow over two weeks.

The residual ice in June is not necessarily a surprise given the record-setting cold weather and extensive ice cover this winter. The Weather Channel reported that temperatures in nearby Marquette, Wisconsin, stayed below freezing for a record 75 days in the midst of winter. Lake Superior was still 64 percent ice-covered in mid-April 2014. And water temperatures in Lake Superior were still in the 30s (0 to 5 Celsius) as of June 10, 2014.

Nonetheless, the icy waters made for some interesting summer fishing and sunbathing scenes.

Lake Superior Summer Iice