bookmark_borderEvaporation at the Surface: A Backyard Measure of Global Water Cycle Disruption

by Daniel Brouse
September 6, 2025

During the 2025 pool season (May through September), water levels showed a net loss of 16 inches solely due to evaporation. While this may seem like a localized measurement, it illustrates a much broader hydrological imbalance already underway. The same processes driving evaporation in a backyard pool are simultaneously pulling moisture out of soils, wetlands, forests, and croplands. In other words, the land surface is drying while the atmosphere is becoming more moisture-laden. This shift not only stresses ecosystems and agriculture through soil desiccation, but also loads the atmosphere with excess water vapor—the most powerful greenhouse gas—fueling heavier rainfall events, flash flooding, and hydraulic whiplash across regions. What looks like a simple 16-inch seasonal loss is, in reality, a microcosm of how climate-driven water cycle disruption is playing out on a global scale.

The Human Induced Climate Change Experiment

bookmark_borderU.S. Threatens Tariffs and Sanctions to Undermine U.N. Marine Fuel Emissions Deal

The United States has reportedly warned countries to reject a United Nations–brokered agreement aimed at reducing marine fuel emissions—or face punitive tariffs, visa restrictions, and additional port levies, according to U.S. and European officials familiar with the matter.

The U.N. initiative, designed to curb the shipping industry’s significant contribution to global greenhouse gas emissions, has broad international support. Shipping accounts for nearly 3% of total global emissions, and the deal represents one of the most ambitious multilateral efforts to regulate marine fuels in history.

Instead of cooperating, the Trump administration has chosen confrontation. By pressuring countries with the threat of economic and diplomatic retaliation, the White House is engaging in strong-arm tactics that not only undermine global climate action but also erode U.S. credibility on the world stage.

“This is exactly the type of bully-and-extort approach that permanently damages U.S. exceptionalism, trust, and reliability,” said one European trade official. The move has been described by analysts as a short-sighted attempt to shield U.S. shipping and oil interests from environmental standards—at the cost of international partnerships and long-term global stability.

Critics warn that the Trump administration’s actions jeopardize not just climate progress, but also America’s role as a trusted global leader. By rejecting cooperative frameworks in favor of coercion, the U.S. risks further isolating itself while ceding moral, economic, and environmental leadership to other nations.

Trumpenomics: The Decline of the US

bookmark_borderTexas-Sized Climate Change

by Daniel Brouse
September 3, 2025

The CO₂ Coalition released a report titled “Texas and Climate Change: No Climate Crisis in the Lone Star State,” making a series of sweeping claims: that Texas has experienced no “unprecedented or unusual” warming despite rising atmospheric CO₂, and that current temperatures are comparable to those over a century ago. The report argues that the annual number of 100 °F days in Texas shows an overall decreasing trend, and that precipitation has modestly increased by 0.0245 inches per year from 1850–2023, supposedly indicating no danger of increasing aridity. It further asserts that droughts are not becoming more severe or frequent; tornadoes, hurricanes, and floods are not occurring more often; sea-level rise and coastal subsidence are not threatening Texas’s coast; and wildfires are not becoming more frequent or severe in the United States. According to the report, U.S. air quality is “generally good and getting better,” agriculture in Texas is “thriving,” and carbon dioxide is not only essential to life on Earth but beneficial — enhancing plant growth, increasing food production, and improving drought resistance.

Why the CO₂ Coalition’s Texas Report Is Dangerous and Misleading

The CO₂ Coalition’s claims are scientifically false, cherry-picked, and deliberately misleading. They rely on outdated, selective data while ignoring the overwhelming body of peer-reviewed climate science showing Texas is warming rapidly, experiencing escalating extreme weather, and facing mounting economic fallout.

1. “No unusual warming” – False
Texas has already warmed by ~2.2 °F since 1970 (NOAA data). Heatwaves are becoming longer, hotter, and more humid, driving spikes in hospitalizations and deaths. While the Coalition cherry-picks single metrics like “100 °F days,” this ignores the wet-bulb temperature rise that makes heat more physiologically dangerous even at lower dry-bulb readings.

2. “Precipitation is stable” – Misleading
Yes, Texas has seen slightly higher annual rainfall on average, but what matters is distribution and intensity. Rainfall is increasingly delivered in extreme bursts, fueling flash floods and billion-dollar storm disasters. At the same time, longer dry spells and hotter summers intensify drought risk, hitting agriculture and water supply.

3. “No increase in hurricanes, tornadoes, or floods” – Misleading
While tornado frequency is shifting geographically, hurricanes in the Gulf are becoming more intense and rain-heavy. Hurricane Harvey (2017) alone dumped 50 inches of rain, caused $125 billion in damages, and is widely recognized as a climate-amplified event. Billion-dollar floods in Texas are now commonplace.

4. “No sea-level threat” – False
The Texas Gulf Coast is experiencing one of the fastest rates of relative sea-level rise in the U.S. due to a combination of global sea rise + land subsidence. Galveston, Houston, and Corpus Christi face direct coastal inundation and storm surge risks, putting billions in infrastructure and property at risk.

5. “Wildfires not worse” – False
Texas wildfire seasons are lengthening. In 2011, drought-driven fires burned 4 million acres, destroyed 3,000 homes, and killed 47 people. Rising heat and drought variability mean wildfire risk is climbing across Texas’s grasslands and forests.

6. “Agriculture thriving” – Misleading
While CO₂ fertilization can increase plant growth in controlled conditions, it does not offset climate extremes. Texas farmers are already facing drought losses in the billions. In 2022 alone, drought wiped out ~74% of Texas cotton, costing the state’s economy over $2 billion. Crop failures, livestock stress, and water shortages are accelerating.

Texas: Climate Costs and Collapsing Insurance

Beyond the false claims, the real story is that Texas is already paying some of the highest climate costs in the U.S.

  • Insurance Industry Collapse: Texas has some of the highest homeowners insurance premiums in the country, driven by hurricanes, hail, floods, and wildfires. Insurers are withdrawing or raising rates sharply, putting much of Texas real estate at risk of value collapse as homes become uninsurable.

  • Billion-Dollar Disasters: Texas leads the nation in NOAA billion-dollar climate disasters. Since 1980, Texas has suffered nearly 200 major disasters totaling over $300 billion in losses.

  • Heat & Health: Texas is one of the most vulnerable states for extreme heat deaths, especially as wet-bulb temperatures rise in urban centers like Houston, Austin, and Dallas.

  • Future Threats: By 2050, Texas is projected to experience 30+ additional “dangerous heat days” annually, worsening agricultural collapse, grid stress, and mortality.

Bottom Line

The CO₂ Coalition’s narrative is propaganda, designed to confuse the public and protect fossil fuel interests. The reality is that Texas is already on the frontlines of climate change, facing skyrocketing economic losses, collapsing insurability, and lethal health risks. Far from being “beneficial,” continued CO₂ emissions are putting the state’s economy, real estate, food systems, and population at existential risk.

The Human Induced Climate Change Experiment

bookmark_borderHealth and Quality of Life in Florida

by Daniel Brouse
September 3, 2025

Florida faces mounting challenges in health, education, and climate resilience—each reinforcing the state’s declining quality of life.

Life Expectancy
Florida’s life expectancy has fallen sharply. Recent estimates put it at ~77.5 years, down from 79 in 2019, with COVID-19 and drug overdoses driving much of the decline. The state now lags far behind leaders such as Hawaii and California, which exceed 80 years.

Education
Educational outcomes remain uneven. Florida consistently ranks low in national comparisons, and with the state sitting 50th in overall teacher pay, the quality of instruction is threatened by underfunding and high turnover.

Climate and Insurance Vulnerability
Florida is one of the most climate-vulnerable states in the U.S. Its state-owned insurer, Citizens Property Insurance Corporation, is now the largest taxpayer-funded insurance program in the nation—a bailout many describe as the biggest act of state-level socialism in U.S. history. With the largest coastal population living in low-elevation zones, Florida faces severe flooding risks. More than 590,000 South Florida residents—many socially or medically vulnerable—are directly threatened. Hurricanes and tropical storms bring lethal flooding, prolonged power outages, healthcare disruptions, and cascading long-term effects on mental health, maternal health, and community stability.

Skin Cancer
The Blue Cross Blue Shield Association reports that ~7.1% of Floridians have been diagnosed with skin cancer—including basal cell carcinoma, squamous cell carcinoma, and melanoma. This ranks Florida among the highest in the nation for skin cancer burden, driven by high UV exposure and inadequate protection.

Heat-Related Illness
Between 2005–2012, Florida recorded 23,981 non-work-related emergency department visits, 4,816 hospitalizations, and 139 deaths from heat-related illness (HRI) during the warm season (May–October). Work-related HRI also caused thousands of cases, particularly among outdoor laborers. Pregnant individuals are disproportionately at risk: from 2020–2024, the state averaged 28 pregnancy heat-risk days per year, 19 attributable directly to climate change, raising risks of preterm birth, low birth weight, and long-term health complications. Looking forward, Florida’s annual days with a heat index above 100°F are expected to rise from about 25 today to 105 by 2050, and 141 by 2100—a dramatic escalation that will make outdoor work and daily living increasingly hazardous.

The Human Induced Climate Change Experiment

bookmark_borderRunaway Climate Feedbacks and Systemic Collapse

Daniel Brouse and Sidd Mukherjee
September 3, 2025


Our probabilistic, ensemble-based climate model — incorporating complex socio-economic and ecological feedback loops within a dynamic, nonlinear system — projects that global temperatures could rise by as much as 9°C (16.2°F) within this century. This far exceeds earlier estimates, which predicted a 4°C rise over the next thousand years, and signals a dramatic acceleration of warming.

Sidd responded: “9°C this century is a stretch. Consensus so far is closer to ~3°C.”

I ask: What do you make of the physics given the observable data?
We’re already at 1.5°C, which makes 3°C this century seem almost unavoidable. I used to think 9°C was a worst-case scenario — now I fear it’s shifting toward the “highly likely” range. In just the last couple of years, I’ve seen at least nine tipping points trigger feedback loops with my own eyes.

What strikes me most is not just that each loop accelerates warming, but that they are now amplifying each other. The interactions are compounding in ways that exceed current models.

So my question is: What do you think about the physics of reaching 9°C this century, given the observed interactions of feedback loops and tipping points, including:

  • Greenland and East Antarctic ice sheet tipping
  • Slowing of the Atlantic Meridional Overturning Circulation (AMOC)
  • Mountain glacier loss
  • Amazon rainforest dieback
  • Arctic sea ice loss
  • Boreal forest degradation and wildfire
  • Permafrost thawing and burning
  • Warm-water coral bleaching
  • West Antarctic Ice Sheet instability

Sidd replied: “I think ~3°C is likely this century, and that estimate already includes tipping points. But of course, I could be wrong. The oceans have the last word — and they take centuries to drive a 9°C+ shift.”


The Arctic as a Harbinger

The Arctic is warming far faster than the global average — ~2–3°C already, about 3–4 times faster than the planet as a whole. Projections vary:

  • Low emissions (~1.5–2°C global): Arctic warms 3–5°C by 2100.
  • High emissions (~3–4°C global): Arctic warms 7–10°C by 2100, with even higher local spikes.
  • Worst-case runaway: With reinforcing tipping points (permafrost, albedo collapse, ocean disruption), Arctic warming could exceed 12°C this century.

Consequences include seasonal ice-free summers by mid-century, permafrost fires releasing CO₂ and methane, and destabilization of AMOC, accelerating sea-level rise and global weather extremes.


Global Runaway Feedbacks

If multiple tipping points reinforce each other, the climate may enter a self-perpetuating heating cycle beyond human control. The main candidates include:

  1. Ice-Albedo Collapse — Ice loss locks in warming.
  2. Permafrost Thaw + Boreal Fires — Gigatons of CO₂/CH₄ released.
  3. Amazon & Rainforest Dieback — Carbon sinks flip to carbon sources.
  4. Ocean Circulation Breakdown — Jet stream chaos, monsoon collapse, food shocks.
  5. Marine Ecosystem Collapse — Coral death and plankton loss undermine food security.
  6. Soil & Crop Failure Feedbacks — Drought, famine, and forced migration.

Temperature outcomes:

  • Linear physics: ~3–5°C by 2100.
  • With feedbacks: 6–9°C this century is plausible.
  • Runaway: A “Hothouse Earth” trajectory of 10°C+ over centuries–millennia.

Feedback-Driven Warming Beyond 1.5 °C

As global mean temperature exceeds 1.5 °C and multiple climate tipping points activate, the critical question is not simply how much warmer the planet becomes, but how quickly feedbacks amplify that warming.

Scientific consensus: Current models suggest that carbon-cycle feedbacks — permafrost thaw, weakening ocean and land sinks, methane release from wetlands, and fire-driven emissions — could add ~0.2–1.0 °C of warming by 2100 on top of direct human emissions. This range reflects assumptions that:

  • Warming is held close to ~2 °C by policy.
  • Tipping points unfold slowly and largely independently.
  • Ecosystems and oceans continue absorbing a significant share of emissions.

Under a high-emissions trajectory, with multiple tipping elements engaged, the upper end of this estimate (or beyond) becomes more plausible.

My concern: These consensus estimates are already lagging reality. Observations suggest that at least nine major tipping points are not only triggered but are now reinforcing each other. Instead of unfolding over centuries or millennia, the pace is measured in years or decades. Models have struggled to keep up with this rapid nonlinearity.


Cascading Feedbacks in Real Time

Regardless of the rise in global mean temperature, cascading feedbacks are already reshaping weather extremes.

In just ten days during July 2025, the U.S. experienced:

  • Hundreds of flash floods nationwide, with hundreds of fatalities and billions in damages.
  • At least five “1-in-1,000-year” rainfall events (Texas, New Mexico, North Carolina, Florida, Illinois).
  • Multiple “500-year floods” across Pennsylvania, Delaware, New Jersey, Maryland, Virginia, and Iowa as extreme rainfall overwhelmed infrastructure.

These events illustrate how tipping feedbacks manifest in human terms — not only as gradual warming, but as sudden escalations in climate volatility and infrastructure failure.


Permafrost: From Slow Thaw to Year-Round Fire

The permafrost is one of the starkest examples of the gap between theory and reality:

  • Old assumption: Permafrost would thaw gradually over thousands of years, steadily releasing CO₂ and CH₄ into the atmosphere.
  • Observed reality: Large regions are no longer “permanently” frozen. Instead, they are catching fire and burning year-round, releasing greenhouse gases on much shorter timescales.

This raises new scientific uncertainties:

  • Fires combust organic matter directly, accelerating CO₂ emissions.
  • If methane is burned in situ during these fires, some fraction may be converted into CO₂ (a less potent but still powerful greenhouse gas) — effectively acting as a “natural flare.”
  • Yet, unburned methane still escapes, and the net balance between flaring vs. direct release remains poorly quantified.

What is clear is that the pace of release is orders of magnitude faster than assumed, and the feedbacks are already active, not hypothetical.


What 9°C Warming Would Mean for Humanity

  • Uninhabitable Tropics — Wet-bulb > 31–35°C renders regions physiologically uninhabitable.
  • Multi-Meter Sea-Level Rise — Coastal megacities drowned.
  • Food System Collapse — Crop yields crash across tropics and mid-latitudes.
  • Oceanic Collapse — Fisheries and reefs vanish.
  • Mass Extinction — 50–70% of species lost.
  • Mass Mortality & Migration — Billions displaced, political collapse, conflict.
  • Refugia Shrink — Only high-latitude/high-altitude zones remain marginally habitable.

At this level, modern civilization likely collapses, with human survival reduced to scattered refugia.


Why “Global Average” Misleads

The idea of a global average temperature obscures human experience. For example, while the average may rise 3°C, some regions (like the Arctic) could see 10°C+ increases. What matters more is regional extremes and wet-bulb thresholds — the real determinants of human survival.


Wet-Bulb Heat: The Real Threat

Wet-bulb temperatures >31°C are already being observed in parts of the U.S. Gulf Coast, Florida, and Mississippi River Valley, with lethal consequences. These levels were once thought “impossible” in the U.S., but climate change is shifting baselines.

This metric — not the global average — is the clearest signal of existential risk to human health and survival.


Conclusion: Humanity’s Chosen Fate

The question is not whether Earth will warm — it is how fast, how far, and how violently feedbacks will accelerate the process. A 9°C rise this century may or may not occur, but even “consensus” outcomes (~3°C) would be catastrophic.

The decisive factor is human action: whether we allow runaway feedbacks to trigger an irreversible “Hothouse Earth,” or whether we cut emissions, restore ecosystems, and adapt quickly enough to keep habitable zones intact.

We are not just modeling the future — we are choosing it.

* Our probabilistic, ensemble-based climate model — which incorporates complex socio-economic and ecological feedback loops within a dynamic, nonlinear system — projects that global temperatures are becoming unsustainable this century. This far exceeds earlier estimates of a 4°C rise over the next thousand years, highlighting a dramatic acceleration in global warming. We are now entering a phase of compound, cascading collapse, where climate, ecological, and societal systems destabilize through interlinked, self-reinforcing feedback loops.

We examine how human activities — such as deforestation, fossil fuel combustion, mass consumption, industrial agriculture, and land development — interact with ecological processes like thermal energy redistribution, carbon cycling, hydrological flow, biodiversity loss, and the spread of disease vectors. These interactions do not follow linear cause-and-effect patterns. Instead, they form complex, self-reinforcing feedback loops that can trigger rapid, system-wide transformations — often abruptly and without warning. Grasping these dynamics is crucial for accurately assessing global risks and developing effective strategies for long-term survival.
The Human Induced Climate Change Experiment

bookmark_borderRunaway Feedbacks: Can Earth Warm 9°C This Century?

by Daniel Brouse and Sidd Mukherjee
September 1, 2025

I said: Our climate model — incorporating complex social-ecological feedback loops within a dynamic, non-linear system — projects that global temperatures could rise by up to 9°C (16.2°F) within this century. This far exceeds earlier estimates, which predicted a 4°C rise over the next thousand years, and signals a dramatic acceleration of warming.

Sidd replied: 9C this century is a stretch… so far consensus is 3 C or so.

I ask:

What do you make of the physics given the observable data? We’re already at 1.5°C, which makes 3°C this century seem almost unavoidable. I used to think 9°C was a worst-case scenario — now I fear it’s shifting toward the “highly likely” range. In just the last couple of years, I’ve seen with my own eyes at least nine tipping points trigger feedback loops.

What strikes me most is not just that each loop accelerates warming on its own, but that they’re now amplifying each other. The interactions are compounding in ways that exceed the models.

So my question is: what do you think about the physics of reaching 9°C this century when we consider the observed interactions of these feedback loops and tipping points, including:

  • Greenland and East Antarctic ice sheet tipping

  • Slowing of the Atlantic Meridional Overturning Circulation (AMOC)

  • Mountain glacier loss

  • Amazon rainforest dieback

  • Arctic sea ice loss

  • Boreal forest degradation and wildfire

  • Permafrost thawing and burning

  • Warm-water coral bleaching

  • West Antarctic Ice Sheet instability

Sidd responded: I think 3 C is likely this century and that estimate includes tipping points. But of course, I could be wrong. The oceans have the last word, and they take more than centuries to change to a 9C plus state.

I ask: What do you think about this math?

The Arctic is the fastest-warming region on Earth, and future projections are sobering. Here’s what current science says:

  • Baseline: Over the past century, the Arctic has already warmed ~2–3 °C, roughly 3–4 times the global average (the IPCC’s “Arctic amplification”).

  • Projections (depending on emissions):

    • Low-emissions scenario (Paris goals ~1.5–2 °C global warming): The Arctic could still warm by 3–5 °C above pre-industrial levels by 2100, because amplification doesn’t go away even with mitigation.

    • High-emissions scenario (business-as-usual, ~3–4 °C global warming): The Arctic could warm by 7–10 °C by 2100, with local peaks higher in winter and over land.

    • Worst-case runaway feedbacks (multiple tipping points reinforcing each other): Some studies suggest the Arctic could hit upwards of 12 °C warming this century, especially if permafrost carbon release, ice–albedo collapse, and ocean circulation disruptions all compound.

  • Consequences of a 7–10 °C Arctic warming:

    • Seasonal ice-free Arctic Ocean within decades (likely before 2050).

    • Permafrost thaw and fires releasing massive CO₂ and methane.

    • AMOC disruption from Greenland meltwater, destabilizing weather globally.

    • Accelerated sea-level rise from Greenland and West Antarctic ice sheet tipping.

So,  within this century, the Arctic could plausibly warm anywhere from ~5 °C (with strong global action) to ~10–12 °C (with high emissions and interacting tipping points).

Worldwide

The worst-case runaway feedbacks for the entire Earth go beyond just linear warming — they involve tipping points that reinforce each other, creating a self-perpetuating heating cycle that humanity cannot reverse once triggered. Here’s how it could unfold:

Worst-Case Runaway Feedbacks (Global)

1. Ice–Albedo Collapse

  • Trigger: Loss of Arctic summer sea ice + collapse of Greenland and parts of Antarctica.

  • Effect: Dark ocean and land absorb far more heat, locking in warming even if emissions stop.

2. Permafrost Thaw + Boreal Fires

  • Trigger: Permafrost in Siberia, Alaska, and Canada thaws; peatlands ignite.

  • Effect: Release of hundreds of gigatons of CO₂ and methane (CH₄ is >80x more powerful than CO₂ over 20 years). This alone could add several °C of warming.

3. Amazon & Tropical Rainforest Dieback

  • Trigger: Drought, fire, and deforestation push the Amazon and Congo toward savannah transition.

  • Effect: Instead of absorbing carbon, they become carbon sources, releasing billions of tons of CO₂.

4. Ocean Circulation Breakdown (AMOC, Southern Ocean overturning)

  • Trigger: Greenland meltwater and Antarctic ice disrupt global heat transport.

  • Effect: Jet stream chaos, monsoon collapse, global food shocks, and further polar warming.

5. Warm-Water Coral & Marine Food Web Collapse

  • Trigger: Ocean heatwaves and acidification kill reefs and plankton.

  • Effect: Loss of a major carbon sink + food security collapse for billions.

6. Soil & Crop Failure Feedbacks

  • Trigger: Heat waves, drought, and shifting rainfall make large parts of the tropics uninhabitable.

  • Effect: Widespread famine, mass migration, political collapse → more emissions from land-use change.

Worst-Case Temperature Outcomes

  • Conservative physics (linear models): ~4–5 °C global average by 2100 (IPCC’s high-end).

  • With interacting feedbacks: 6–9 °C this century is plausible — consistent with paleoclimate evidence (the PETM, ~55 million years ago, saw ~6–8 °C warming from runaway carbon release).

  • Runaway scenario (beyond human control): If permafrost, methane hydrates, and major biosphere collapses all reinforce, Earth could enter a “Hothouse Earth” trajectory of 10+ °C warming over centuries to millennia. That would mean large parts of the planet become uninhabitable for humans.


The “worst-case runaway” isn’t just about higher temperatures. It’s about crossing thresholds where Earth’s system drives itself into a hotter state regardless of human emissions — a true runaway greenhouse scenario. Humanity would lose control of the climate dial.

Humanity’s Chosen Fate

A 9 °C rise in global average temperature this century would be catastrophic — not just “bad” in terms of economics or infrastructure, but existential for organized human civilization. At that level of warming, the Earth system would move into conditions not seen for tens of millions of years, well outside the Holocene climate in which agriculture, cities, and modern society developed.

Here’s what it would likely mean for humanity:

Physical and Ecological Impacts

  • Uninhabitable Tropics
    Wet-bulb temperatures (heat + humidity) would routinely exceed the threshold (~35 °C wet-bulb) at which humans cannot survive outdoors, even in shade with unlimited water. Large regions of South Asia, the Middle East, Africa, and parts of the Americas would become physiologically uninhabitable.

  • Sea-Level Rise
    Melting of Greenland and large parts of West Antarctica would accelerate. By 2100, multi-meter rise is possible; over subsequent centuries, 20–70+ meters is locked in. Coastal megacities (New York, Shanghai, Mumbai, Lagos, London) would be drowned.

  • Collapse of Food Systems
    Staple crops (wheat, maize, rice) have heat tolerances ~30–35 °C. At +9 °C global warming, yields crash across the tropics and subtropics, and mid-latitudes face heat, drought, and water scarcity. Global famine becomes likely.

  • Oceanic Collapse
    +9 °C means ocean stratification, mass bleaching of all coral reefs, collapse of plankton and fisheries. Billions of people who depend on marine protein lose their food source.

  • Mass Extinction
    Up to 50–70% of species would not adapt fast enough. Biodiversity loss undermines ecosystem services humans rely on (pollination, water purification, soil fertility).

Direct Impacts on Humanity

  • Mass Mortality from Heat Stress
    Heatwaves would kill millions each summer in regions without full climate control. Infrastructure (power grids, water supply) would break under demand.

  • Mass Migration
    Billions of people displaced from coasts, tropics, and deserts. Migration on this scale would overwhelm political systems, trigger conflict, and collapse borders.

  • Pandemics
    Climate-stressed ecosystems increase disease spillover (mosquito expansion, permafrost pathogens, etc.). Public health systems overwhelmed by simultaneous climate disasters.

  • Collapse of Civilization
    Agriculture, trade, and finance rely on stability. At +9 °C, economic collapse is almost certain. Wars over water, food, and habitable land become chronic. Nuclear conflict risk rises as states fight for survival.

  • Loss of Human Habitats
    Safe zones shrink to high latitudes and high altitudes (Canada, Scandinavia, Siberia, New Zealand, Patagonia). Even these may face ecological collapse, food scarcity, and climate refugee pressures.

Long-Term Outlook

  • Human Survival vs. Extinction
    While humans as a species might persist in isolated refugia, modern civilization would not. Population could decline from 10 billion (projected mid-century peak) to under 1 billion or less.

  • Locked-in “Hothouse Earth”
    With runaway feedbacks (methane, permafrost, Amazon dieback, AMOC collapse), Earth could move into a semi-permanent hot state. Even if emissions ceased, the climate would not stabilize for centuries–millennia.


A 9 °C rise this century is not just “worse than we expected” — it represents an existential threat to humanity, putting civilization and billions of lives at risk. It would transform Earth into a planet fundamentally hostile to human survival.

Another Perspective

Now that I think about it, the concept of a ‘global average’ is misleading at best—and nearly meaningless for the average person trying to understand their lived reality. What I’m more interested in:

1) As global mean temperature exceeds 1.5 °C and multiple climate tipping points are activated, what is the projected rate and magnitude of additional warming driven by feedbacks from CO₂, methane, and other greenhouse gas releases?

2) Within the next century, what proportion of Earth’s land area is expected to exceed human survivability thresholds due to rising wet-bulb temperatures (≥ 35 °C at 100% relative humidity, or ≥ 46 °C at 50% relative humidity), and how might this distribution evolve under different emissions and feedback scenarios?

1) Extra warming from feedbacks once we pass ~1.5 °C

Short answer: Carbon-cycle feedbacks (permafrost thaw, weaker ocean/land uptake, wetland CH₄, fire) add non-trivial warming on top of direct emissions. By 2100, they likely contribute ~0.2–1.0 °C of additional warming under high-emissions pathways, with tails that could be larger if ice and ecosystem tipping cascades unfold quickly. ScienceDirectWiley Online LibraryPNAS

What underpins that range

  • Observed acceleration in ocean heat uptake, Greenland/Antarctic mass loss, and permafrost thaw shows the carbon sink is weakening and amplifying warming (positive “carbon-cycle feedback”). AR6 assessed a positive net feedback this century, raising CO₂ in the air per unit of emissions and adding warming relative to models without these feedbacks. PNAS

  • Permafrost & high-latitude feedbacks: Thaw releases CO₂/CH₄ and is already occurring; AR6 judges additional warming from these processes this century as likely positive though still uncertain in magnitude. PNAS

  • Methane & wetland response: A warmer, wetter world tends to raise natural CH₄ emissions; several recent syntheses project increases that materially add to radiative forcing by 2100 under high-emissions scenarios. PNAS

  • Wildfire/vegetation shifts: Heat and drought increase fire activity and can flip forests from sinks to sources (e.g., boreal, Amazon edges), again nudging warming up beyond direct anthropogenic forcing. PNAS

Bottom line: If policy keeps global warming near ~2 °C, feedback-driven extra warming is likely toward the low end of that 0.2–1.0 °C band. Under high emissions with multiple tipping elements engaged, the upper end (or higher) becomes more plausible. PNAS

2) How much land could exceed lethal wet-bulb thresholds?

Key thresholds: A wet-bulb temperature (TW) of 35 °C (~35 °C at 100% RH or ~46 °C at 50% RH) is often cited as a hard physiological limit for continuous exposure. New lab work indicates functional limits for healthy adults doing light activity occur lower, ~31–33 °C, and are even lower for older or vulnerable people—so harmful exposure happens well before TW = 35 °C. PMC

What models and observations show

  • Already observed: TW ≈ 31–33 °C is no longer theoretical. In the U.S., dangerous wet-bulb conditions have been documented in the Gulf Coast, Mississippi Valley, and desert Southwest during recent extreme heat waves, with peaks during 2020–2023 summers. Globally, places like Jacobabad (Pakistan) and the Persian Gulf have already briefly exceeded even the 35 °C TW line. Reuters

  • End-century, high emissions (SSP5-8.5/RCP8.5):

    • Where TW ≥ 35 °C becomes possible: parts of the Persian Gulf, Indus River Valley (Pakistan/India), and Red Sea coasts—typically for hours to a few days in extreme years. Multiple studies converge on this regional pattern. Geographically, this is likely <~1% of global land area, but it includes densely populated regions. IDEAS/RePEcPMCCarbon Brief

    • Deadly heat (below TW 35 but still lethal): Using empirically derived deadly heat thresholds (not just TW 35), ~74% of the world’s population could face ≥ 20 days/year of deadly heat by 2100 if emissions keep rising; even with strong mitigation, exposure could still reach ~48%. These estimates account for temperature and humidity. NatureCarbon Brief

  • Land-area perspective: Beyond the TW 35 line, much larger fractions of land will experience TW 30–33 °C (dangerous for work and outdoor life), with recent work showing land TW rises ~17% faster than sea-surface temperatures, increasing inland risk. resources.environment.yale.edu

How this evolves by scenario

  • Strong mitigation (~1.5–2 °C global): TW ≥ 35 °C remains rare and localized; population exposure to deadly heat still increases but is roughly halved versus high-emissions futures. Nature

  • Intermediate (~2.5–3 °C): Expansion of regions with TW 30–33 °C into South Asia, parts of Southeast Asia, the Sahel, coastal China—bringing chronic outdoor work constraints and surge mortality during heatwaves. PMC

  • High emissions + strong feedbacks (≥ 3–4 °C): Episodic TW ≥ 35 °C across the Persian Gulf/Indus/Red Sea belts; widespread TW > 30–33 °C across much of the tropics and subtropics. The fraction of global land breaching TW ≥ 35 °C remains relatively small, but hundreds of millions to billions of people would live where workable hours collapse and cooling becomes survival-critical. IDEAS/RePEcPMC

Takeaways

  • Lethal heat risk is primarily a population-exposure problem, not just a land-fraction problem: even a small fraction of land with extreme TW can threaten very large populations. Nature

  • Because practical limits for humans are below TW 35 °C, the area and population at risk are much larger than what the hard 35 °C line implies. PMC

  • Rapid mitigation (cutting CO₂/CH₄) and adaptation (cooling access, urban design, early-warning, labor policies) dramatically reduce lethal exposure even though they cannot eliminate it. Nature

Tipping points and feedback loops drive the acceleration of climate change. When one tipping point is breached and triggers others, the cascading collapse is known as the Domino Effect.

The Human Induced Climate Change Experiment

bookmark_borderThe Accelerating Collapse of the AMOC–Jet Stream Feedback Loop

By Daniel Brouse
September 1, 2025

The Atlantic Meridional Overturning Circulation (AMOC) and the jet stream are unraveling much faster than science once believed possible. What was once thought to take millennia, and later centuries, has now accelerated into mere decades.

Earlier this year, I wrote about the unsettling transition from spring to summer in Pennsylvania. A damp, cool spring gave way almost overnight to record-breaking heat, scorching the state in the very first days of summer. At first glance, these whiplash conditions might seem like disconnected events. In reality, they are symptoms of a deeper crisis: the breakdown of Earth’s major circulation systems that once stabilized climate.

Two of the most important of these systems—the jet stream and the AMOC—have now crossed critical tipping points. Both govern weather across the North and Mid-Atlantic United States, and both systems now oscillate directly over Pennsylvania, placing the state in the crosshairs of instability.

Atmospheric and oceanic circulation normally work in tandem to transport thermal energy across the planet, preventing extremes. But as Arctic ice melt pours freshwater into the North Atlantic, the AMOC weakens. The sinking of dense, salty water that drives this great current is slowing, stalling the northward transport of heat. Meanwhile, the jet stream—once strong and stable—has grown irregular. With the temperature difference between the poles and the tropics shrinking, the jet stream now stalls, bends, and meanders, allowing cold Arctic air to linger while trapping heat in other regions.

The consequence is a climate marked by contradiction, where sudden swings between extremes are no longer anomalies but the new normal. What happened in Pennsylvania this year illustrates this shift: a record-wet spring with atmospheric rivers and torrential rains, followed almost immediately by drought and heat domes. Now, as summer fades to autumn, the pendulum has swung again—this time toward a stalled polar vortex draped across much of the United States.

Compounding this instability is the intensification of Rossby Waves, those giant meanders in the jet stream that now drive hydrologic whiplash. The alternating floods and droughts, combined with extremes of heat and cold, are signatures of a nonlinear, chaotic climate system spinning further out of balance.

Perhaps most alarming is the speed of this transformation. Earlier models projected AMOC collapse and jet stream destabilization unfolding over many centuries. But today, feedback loops between these systems are accelerating change by thousands of years beyond those initial predictions. If this trajectory continues, the Northeast could face summers that resemble swamps—hot, humid, and stifling—followed by winters of unprecedented severity.

The collapse is no longer theoretical. It is here, it is accelerating, and it is reshaping daily life in Pennsylvania and across the globe. The only real uncertainty left is how much worse it will get, and how quickly.

The Human Induced Climate Change Experiment

bookmark_borderFederal Appeals Court Strikes Down Key Trump Tariffs, Deepening Trade Uncertainty

by Daniel Brouse

On August 29, 2025, heading into the Labor Day holiday weekend, the U.S. Court of Appeals for the Federal Circuit in Washington, D.C. delivered a major ruling: most of President Donald Trump’s “reciprocal” tariffs, along with a separate set imposed earlier this year, are illegal. The decision represents both a constitutional challenge to executive authority and a new source of turmoil for an already fragile global economy.

Scope of the Ruling

The court’s decision addressed two major elements of Trump’s trade war:

  • “Reciprocal” tariffs, unveiled in April 2025, which Trump claimed were necessary to “balance” trade by matching foreign tariff rates.
  • A separate set of tariffs imposed in February 2025 against China, Canada, and Mexico, which had immediately escalated tensions with America’s largest trading partners.

The ruling does not impact tariffs issued under other legal authority. For example, Trump’s tariffs on steel and aluminum imports remain intact. This distinction highlights a broader complexity: with a wide variety of tariffs in play, the ruling may not provide relief to many businesses or consumers in the short term. Instead, it complicates the already daunting task of determining which tariff rates apply in specific cases, leaving companies mired in uncertainty.

Constitutional Clash

At its core, the ruling strikes at the legality of Trump’s unilateral approach to trade policy. The court found that the president exceeded his executive authority by imposing tariffs without proper congressional authorization. This confirms long-standing warnings from constitutional scholars that Trump’s trade war strategy was on shaky legal ground.

Economic Fallout

Even though the ruling is limited in scope, the implications are sweeping:

  • Businesses now face greater uncertainty as tariff structures become harder to predict or plan around.
  • Consumers are unlikely to see quick relief, since other tariffs remain in place and global supply chains are still disrupted.
  • Markets may react with volatility, as investors recalibrate expectations for trade flows, corporate profits, and Federal Reserve independence.

Global and Political Consequences

For U.S. trading partners—particularly China, Canada, and Mexico—the ruling offers partial vindication but not full clarity. Global markets will be watching whether Trump doubles down with new measures or is forced to negotiate under congressional oversight. Domestically, the decision reignites debate over the balance of power between Congress and the presidency, especially in matters that directly affect the U.S. and global economies.

A Warning for the Future

The ruling is not the end of tariffs under Trump, but it underscores a deeper truth: trade wars are costly, legally fragile, and economically destabilizing. For businesses and workers, this decision changes little in the immediate term but raises profound questions about the sustainability of America’s current economic path.

Insanity Unleashed

President Trump wasted no time firing back after the ruling, issuing a late-night statement laced with all-caps fury. In part, he declared: “ALL TARIFFS ARE STILL IN EFFECT! Today a Highly Partisan Appeals Court incorrectly said that our Tariffs should be removed, but they know the United States of America will win in the end. If these Tariffs ever went away, it would be a total disaster for the Country.”

He went even further, warning that: “If allowed to stand, this Decision would literally destroy the United States of America.”

For now, the appeals court has allowed the contested tariffs to remain in effect until October 17, giving the Supreme Court time to decide whether to intervene. The unusual delay has left markets and trading partners in limbo.

The Attorney General of Oregon—one of the states that brought the lawsuit—was blunt in his reaction, calling the tariffs “bonkers” and arguing they have done measurable harm to both state economies and global trade.

The ultimate fate of Trump’s tariffs now rests with the Supreme Court, where the outcome remains highly uncertain. Economists warn that if the Court sides with the appeals panel, the administration could be forced to refund billions in ill-gotten tariff revenues. Many believe such a refund would provide overdue relief to businesses and consumers, but in the meantime the uncertainty continues to roil markets at home and abroad.

Trumpenomics: The Decline of the US

bookmark_borderSea Level Denial vs. Climate Reality: The Accelerating Collapse of Ice Sheets and Ocean Circulation

by Daniel Brouse
August 29, 2025

Here’s an example response you can use when confronting a climate denier—this one addresses the accelerating rise in sea levels and the collapse of the AMOC.

The climate denier said to me: “What an absolute load of BS. Sea level hasn’t changed to ANY verifiable degree in 2,000 years. Sit down, and STFU.”

I replied:
Wrong. Sea level rise has already accelerated far beyond your denialist talking point. For most of the past 2,000 years, sea levels were relatively stable. But since the industrial revolution, we’ve seen an exponential shift. Sea level rise was doubling at a rate of about every 100 years. A decade ago, that doubling time dropped to every 10 years. Now, it is doubling every two years. And that still doesn’t account for the compounding feedback loops currently destabilizing the system.

For example, the collapse of the Atlantic Meridional Overturning Circulation (AMOC) is slowing ocean circulation, heating the tropics, warming the Arctic, and accelerating polar ice melt—all of which cause faster sea level rise. Melting Greenland and Antarctic ice also inject massive volumes of freshwater into the North Atlantic, further destabilizing the AMOC in a reinforcing loop.

The same disrupted system drives Amazon drought and dieback, reducing its ability to recycle rainfall and store carbon. That adds more greenhouse gases to the atmosphere, which further accelerates warming, ice melt, and sea level rise. Meanwhile, the albedo effect from melting ice, brown carbon from megafires, and permafrost methane releases are amplifying the chaos.

To put numbers on it:

  • Greenland alone holds enough ice to raise sea levels by ~20 feet, much of which is already destabilizing.

  • West Antarctica could add another 10 feet within decades.

  • Sudden “cork release” pulses of 1–3 feet per year are possible once key ice sheet thresholds break.

  • The East Antarctic Ice Sheet, the true wildcard, holds ~170 feet of potential rise.

This isn’t speculation—it’s backed by observational data, paleoclimate records, and validated climate models. My own work, alongside colleagues, uses a probabilistic, ensemble-based climate model that integrates complex socio-economic and ecological feedback loops within a dynamic, nonlinear system. Our projections indicate global temperatures could rise up to 9°C this century—far exceeding earlier estimates. That level of warming virtually guarantees catastrophic sea level rise.

You can yell “BS” all you want, but physics doesn’t care about emojis and denial. The evidence is overwhelming, and if you’d like to attempt literacy, here’s a starting point:
👉 http://membrane.com/global_warming/Ignite-a-Domino-Effect.html

The Human Induced Climate Change Experiment

bookmark_borderSlate Auto: Reinventing the EV With a “Blank Slate” Approach

by Daniel Brouse
August 28, 2025

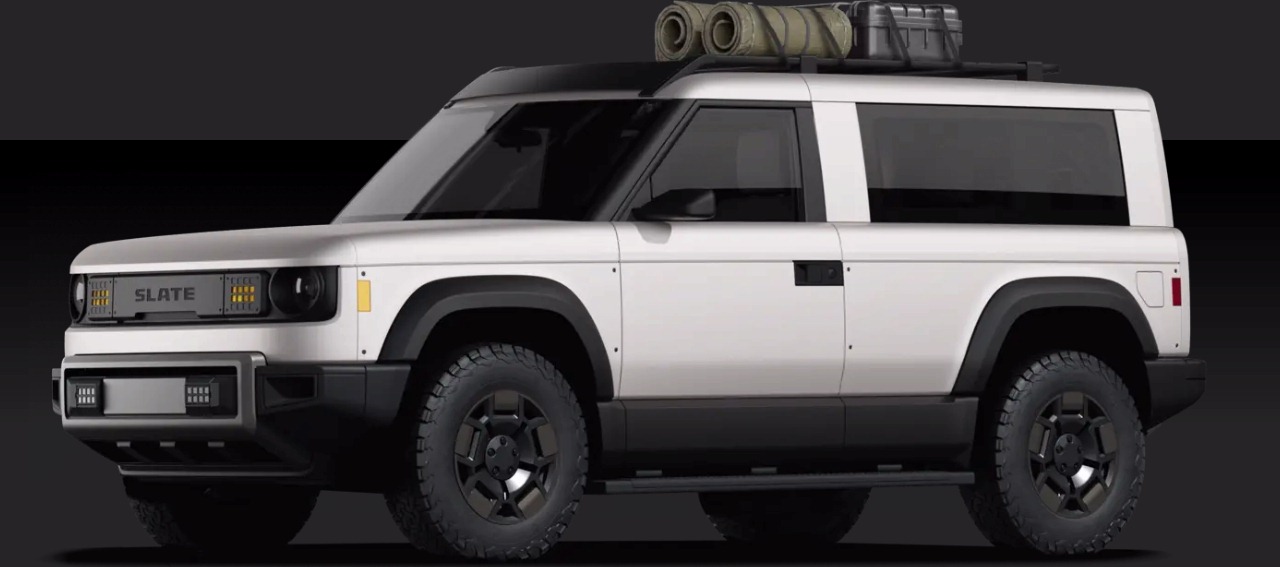
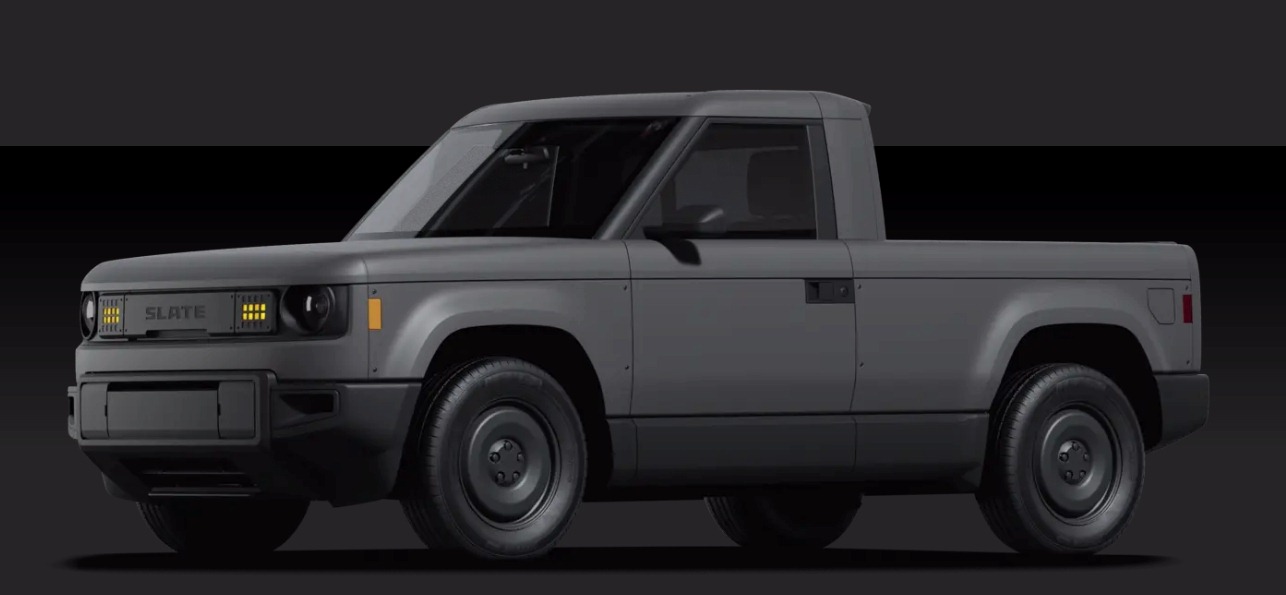
Founded in 2022, Slate Auto is an American startup with a bold mission: to deliver an affordable, highly customizable electric vehicle that challenges traditional automaking. At the center of its strategy is the company’s first product, the Slate Truck—a modular electric pickup designed to transform seamlessly into an SUV. This dual-purpose design reflects Slate’s vision of giving consumers flexibility and control over how they use and personalize their vehicles.

A Different Kind of Affordability

Unlike established automakers that load vehicles with expensive add-ons, Slate aims to bring the base cost of ownership down to earth. With a starting price of $25,000, the Slate Truck undercuts most competitors in the EV market. Affordability is achieved not by compromising core functionality but by eliminating traditional overheads. For example:

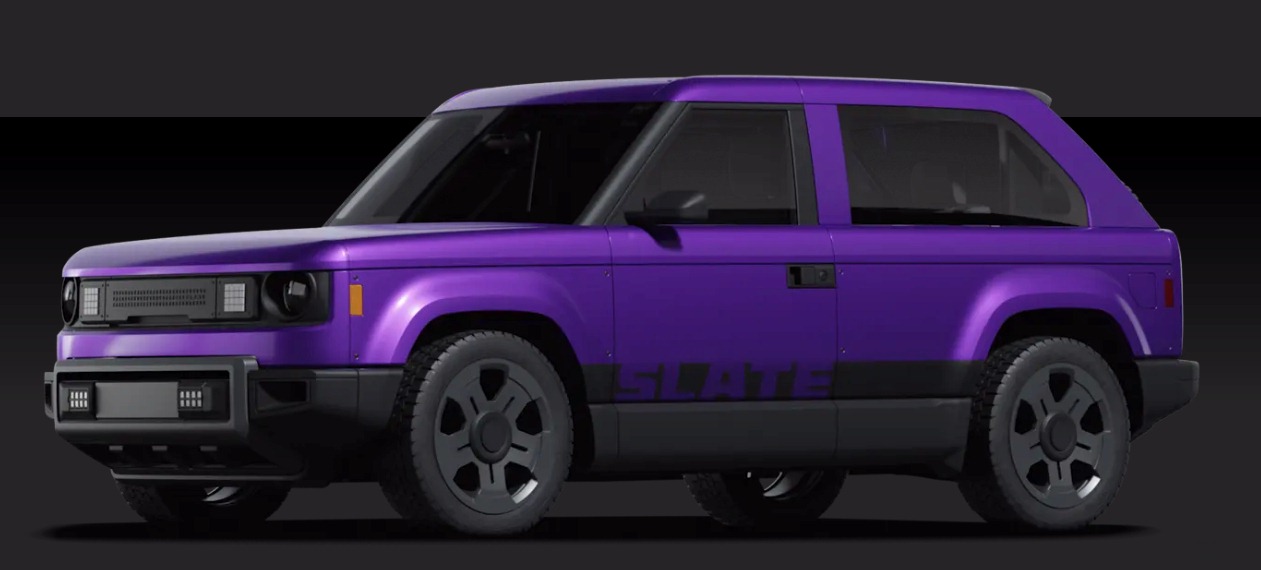
  • No costly paint shop: instead, vehicles come in a neutral molded-gray base designed to be “wrapped” in a wide range of colors, patterns, and finishes.

  • A lean manufacturing model: leveraging a reindustrialized factory in Warsaw, Indiana, Slate avoids the legacy costs that weigh down older automakers.

  • Simplified design: fewer built-in extras mean lower production costs and more room for owner-driven customization.

Customization at the Core

The company brands its philosophy as the “blank slate” approach—a stripped-down, modular vehicle that consumers can personalize through aftermarket kits, accessories, and wraps. Buyers can choose whether they want a rugged work truck, a family-ready SUV, or something entirely unique. This flexibility not only appeals to DIY enthusiasts but also taps into growing consumer demand for products that reflect individual identity and lifestyle.

Manufacturing and Market Timeline

Production is slated to begin at the Indiana facility with the first consumer-ready models expected by late 2026. Slate Auto is positioning itself at the intersection of affordability, sustainability, and personalization—offering a product that could disrupt both the EV market and broader consumer expectations of what a vehicle can be.

A Startup With Big Implications

If Slate succeeds, it could redefine not just EV affordability but the relationship between automaker and consumer. Rather than dictating every feature and finish, Slate is betting that future car buyers want control, creativity, and cost savings. The Slate Truck may not just be another EV—it could be the blueprint for a new era of modular, user-customized vehicles.

The Human Induced Climate Change Experiment