bookmark_borderGlobal Warming Exponential Damage

The U.N. Intergovernmental Panel on Climate Change reported that global warming is spiraling out of control. “The world, in many cases, is ill-prepared for risks from a changing climate,” the IPCC said.

FAQ 1: Are risks of climate change mostly due to changes in extremes, changes in average climate, or both?

People and ecosystems across the world experience climate in many different ways, but weather and climate extremes strongly influence losses and disruptions. Average climate conditions are important. They provide a starting point for understanding what grows where and for informing decisions about tourist destinations, other business opportunities, and crops to plant. But the impacts of a change in average conditions often occur as a result of changes in the frequency, intensity, or duration of extreme weather and climate events. It is the extremes that place excessive and often unexpected demands on systems poorly equipped to deal with those extremes. For example, wet conditions lead to flooding when storm drains and other infrastructure for handling excess water are overwhelmed. Buildings fail when wind speeds exceed design standards. For many kinds of disruption, from crop failure caused by drought to sickness and death from heat waves, the main risks are in the extremes, with changes in average conditions representing a climate with altered timing, intensity, and types of extremes.

FAQ 2: How much can we say about what society will be like in the future, in order to plan for climate change impacts?

Overall characteristics of societies and economies, such as population size, economic activity, and land use, are highly dynamic. On the scale of just one or two decades, and sometimes in less time than that, technological revolutions, political movements, or singular events can shape the course of history in unpredictable ways. To understand potential impacts of climate change for societies and ecosystems, scientists use scenarios to explore implications of a range of possible futures. Scenarios are not predictions of what will happen, but they can be useful tools for researching a wide range of “what if” questions about what the world might be like in the future. They can be used to study future emissions of greenhouse gases and climate change. They can also be used to explore the ways climate-change impacts depend on changes in society, such as economic or population growth or
progress in controlling diseases. Scenarios of possible decisions and policies can be used to explore the solution space for reducing greenhouse gas emissions and preparing for a changing climate. Scenario analysis creates a foundation for understanding risks of climate change for people, ecosystems, and economies across a range of possible futures. It provides important tools for smart decision-making when both uncertainties and consequences are large.

FAQ 3: Why is climate change a particularly difficult challenge for managing risk?

Risk management is easier for nations, companies, and even individuals when the likelihood and consequences of possible events are readily understood. Risk management becomes much more challenging when the stakes are higher or when uncertainty is greater. As the WGII AR5 demonstrates, we know a great deal about the impacts of climate change that have already occurred, and we understand a great deal about expected impacts in the future. But many uncertainties remain, and will persist. In particular, future greenhouse gas emissions depend on societal choices, policies, and technology advancements not yet made, and climate-change impacts depend on both the amount of climate change that occurs and the effectiveness of development in reducing exposure and vulnerability. The real challenge of dealing effectively with climate change is recognizing the value of wise and timely decisions in a setting where complete knowledge is impossible. This is the essence of risk management.

bookmark_borderWashington Mudslide

You would think with all the mud slinging in Washington DC that would be the Washington with the mudslide. No, the mudslide that killed over a dozen people and left over 100 missing was in Oso, Washington. Oso is a small village 55 miles northeast of Seattle (or, perhaps we should say *was*.) The village was “obliterated” after weeks of heavy rain.

This sort of extreme weather event is expected to become more normal due to the effects of global warming.

bookmark_borderNews from the Ice Wars

The Membrane Domain has been conducting Human Induced Climate Change Experiments since 1999. One of the first scientist to hypothesize that global warming was exponential (as opposed to the linear models) requested fellow scientists to conduct studies.

One Membrane Domain scientists began a study on the decline of the ice mass. The analysis is on-going; however, recent data leads to the conclusion that the process is exponential:

The two largest ice sheets on earth, Greenland and Antarctica, are losing mass faster and faster. The figure below is from Velicogna and Wahr, “Time-variable gravity observations of ice sheet mass balance: Precision and limitations of the GRACE satellite data” GEOPHYSICAL RESEARCH LETTERS, VOL. 40, 3055-3063, doi:10.1002/grl.50527, 2013

Mass loss for Greenland and  Antarctica from 2003-2013

For reference, 360 GTonne of mass loss results in 1 mm sea level rise. Greenland lost more than that in 2012 alone.

Causes of Mass Loss

I. Marine terminated glaciers flow to the ocean and calve off icebergs. The figure below is from Rignot and Mouginot,”Ice flow in Greenland for the International Polar Year 2008-2009,” GEOPHYSICAL RESEARCH LETTERS, VOL. 39, L11501, doi:10.1029/2012GL051634, 2012

Read More on the Decline of the Ice Mass

bookmark_borderIf the Ice were Gone

The Membrane Domain has been conducting Human Induced Climate Change Experiments since 1999. One of the first scientist to hypothesize that global warming was exponential (as opposed to the linear models) requested fellow scientists to conduct studies.

Another of the Membrane Domain scientists began a study on the ice mass of Greenland. The analysis is on-going; however, recent data leads to the conclusion that the process is exponential:

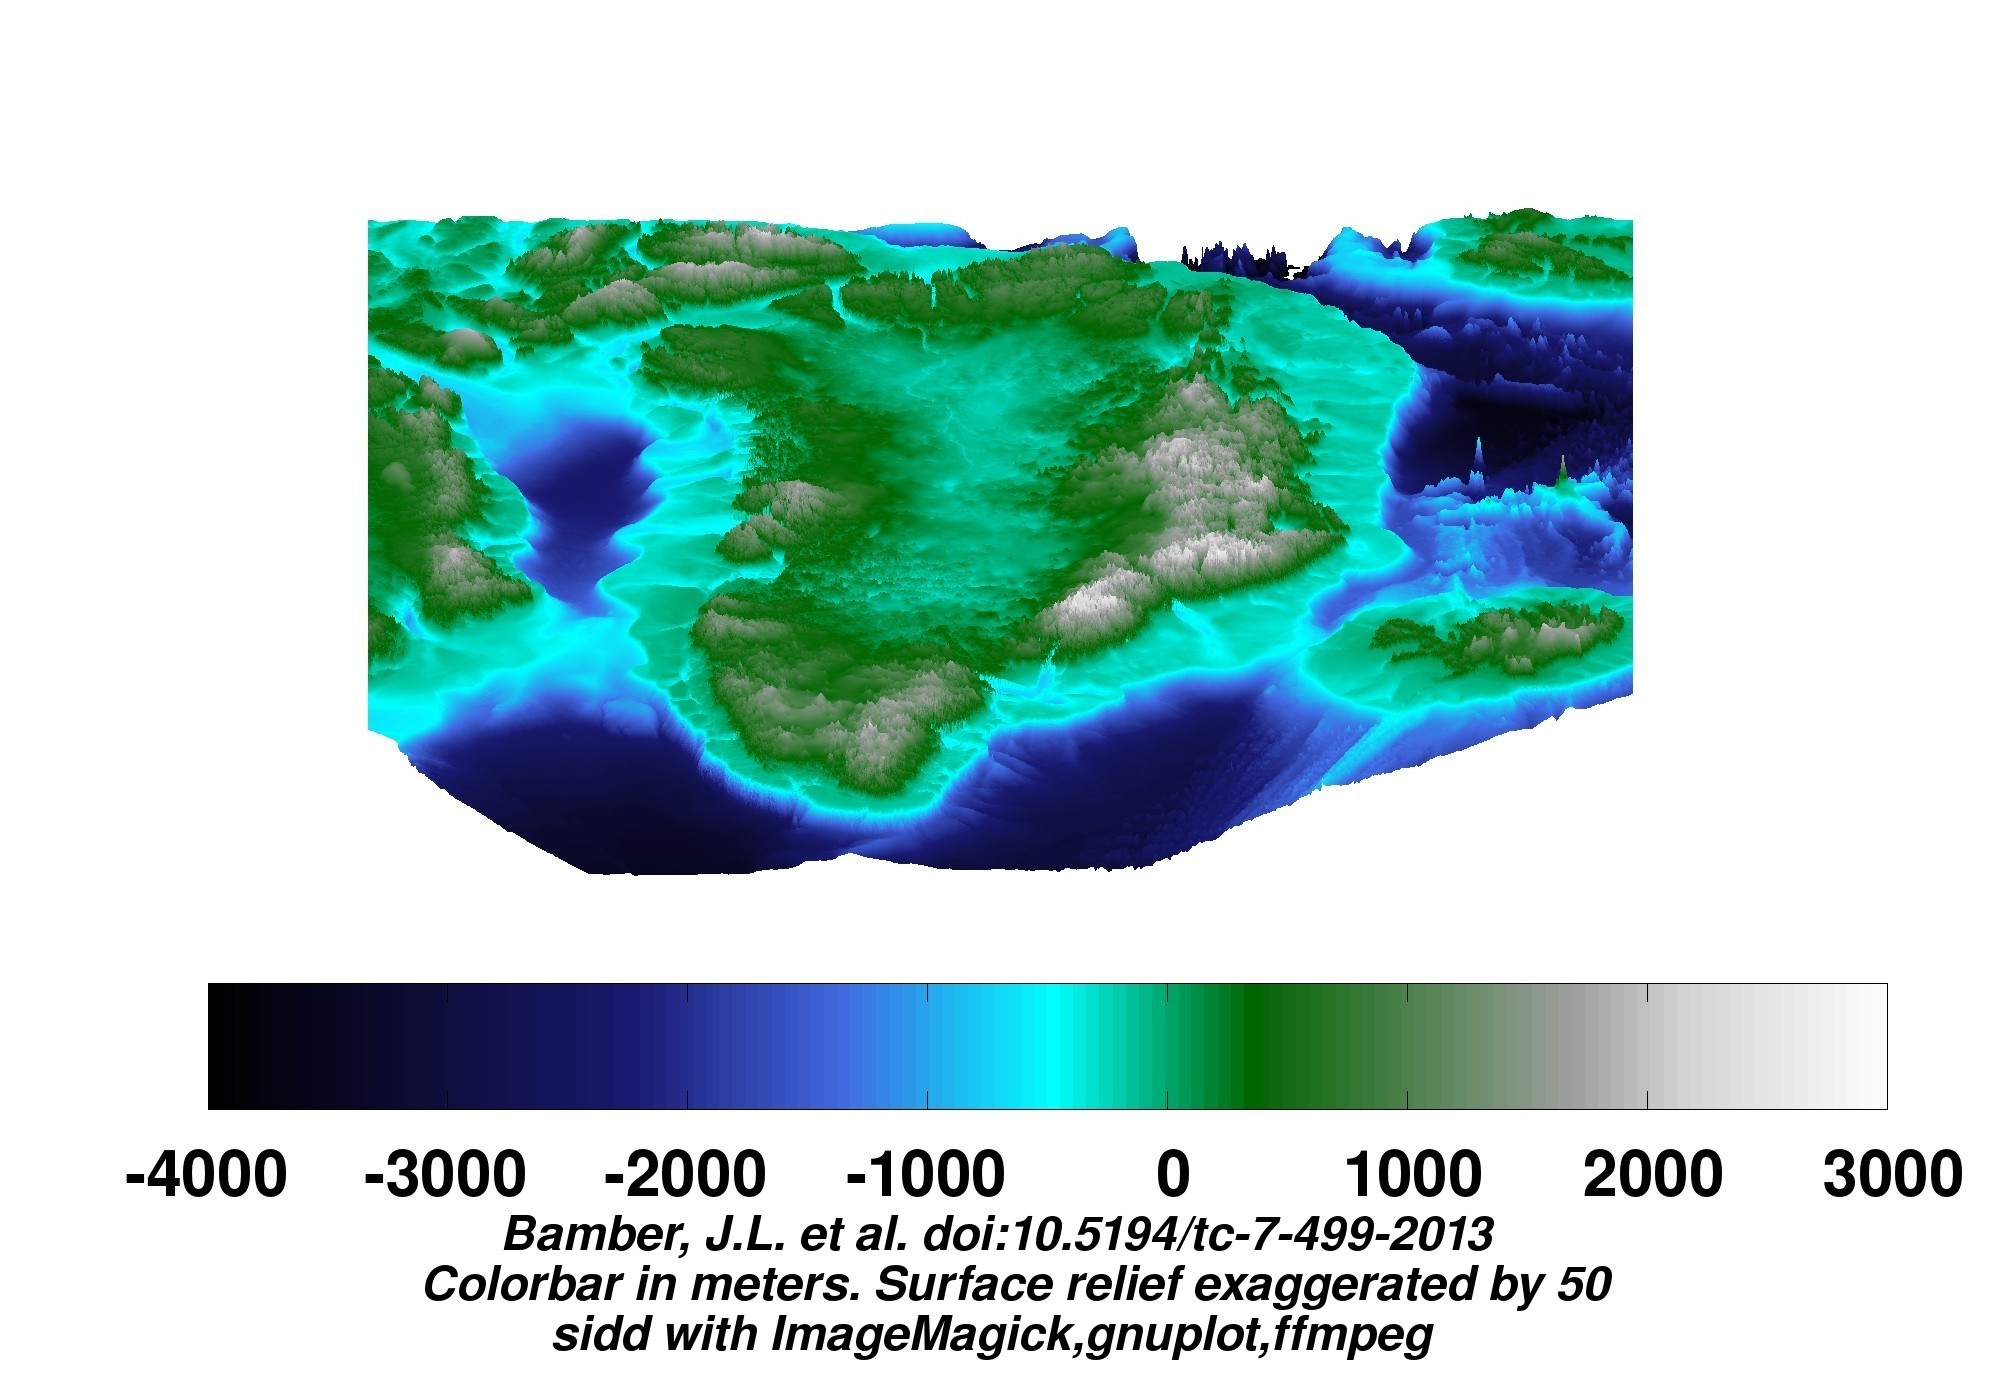
A new map of Greenland has been made.

For ice surface views, go here. For dual ice surface and bedrock views, go here. The images below are links to larger versions. Click on the image to view the larger version.

Some bedrock views follow. No isostatic rebound included. (When the ice melts, the earth beneath will rise as she is unburdened. This effect is not included in the depictions here.)

45 degree projection looking toward the four cardinal points:

View of Greenland


More of “If the Ice were Gone”

More on Global Warming

bookmark_borderExtreme Weather Events and the Meandering Jet Stream

The extreme weather events effecting the USA, England and Australia by be a result of a change in the Jetstream. The BBC reports:

New research suggests that the main system that helps determine the weather over Northern Europe and North America may be changing.

The study shows that the so-called jet stream has increasingly taken a longer, meandering path.

This has resulted in weather remaining the same for more prolonged periods.

The work was presented at the annual meeting of the American Association for the Advancement of Science (AAAS) in Chicago.

The observation could be as a result of the recent warming of the Arctic. Temperatures there have been rising two to three times faster than the rest of the globe.

According to Prof Jennifer Francis of Rutgers University in New Jersey: “This does seem to suggest that weather patterns are changing and people are noticing that the weather in their area is not what it used to be.”

The meandering jet stream has accounted for the recent stormy weather over the UK and the bitter winter weather in the US Mid-West remaining longer than it otherwise would have.

“We can expect more of the same and we can expect it to happen more frequently,” says Prof Francis

bookmark_borderExtreme Weather Hits U.S., England and Australia

The United States, England and Australia are all experiencing severe and extreme weather events. In the United States, the East and Southeast have been hit with all types of winter storms. On the West Coast, the drought has reached critical stages of water conservation, as well as, causing wildfires. England is getting hit with the worst precipitation and flooding in the last 250 years. Australia is getting record temperature heat waves while other parts are underwater from deluges.

“Fire crews spend the day battling fires in South Australia and Victoria as the southern states endure a weekend of extreme weather conditions.” “The weather records keep tumbling in Adelaide – this time due to heavy rainfall. “– Australian Broadcasting Corporation

“Thousands of sandbags are being piled up to protect homes and businesses as more heavy rain and gale-force winds sweep across southern Britain.” — British Broadcasting Corporation

“Global Warming — We are not saying that the Earth’s temperature is just going to rise. In general, as energy is added to a system, the fluctuations in the system increase. So, we expect more storms, more droughts, more wildfires, more floods, more fluctuations of all kinds. What we are saying is that weather conditions will become more volatile due to the impact of humans.” — S. Mukherjee & D. Brouse (2004)

More On Global Warming

bookmark_borderWinter Storm Battering Mid-Atlantic and New England

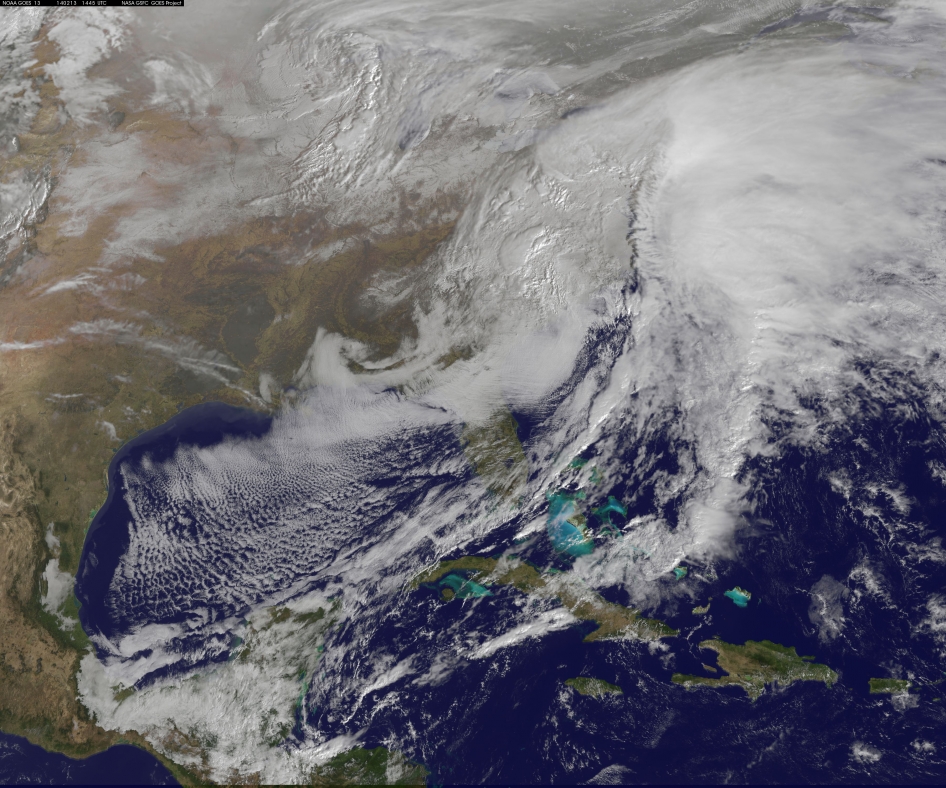
This visible image of the winter storm over the U.S. south and East Coast was taken by NOAA's GOES-13 satellite on Feb. 13 at 1455 UTC/9:45 a.m. EST. Snow covered ground can be seen over the Great Lakes region and Ohio Valley. Image Credit:  NASA/NOAA GOES Project
This visible image of the winter storm over the U.S. south and East Coast was taken by NOAA’s GOES-13 satellite on Feb. 13 at 1455 UTC/9:45 a.m. EST. Snow covered ground can be seen over the Great Lakes region and Ohio Valley. Image Credit: NASA/NOAA GOES Project

NASA — The monster winter storm that brought icing to the U.S. southeast moved northward along the Eastern Seaboard and brought snow, sleet and rain from the Mid-Atlantic to New England on February 13. A new image from NOAA’s GOES satellite showed clouds associated with the massive winter storm stretch from the U.S. southeast to the northeast.

Data from NOAA’s GOES-East satellite taken on Feb. 13 at 1455 UTC/9:45 a.m. EST were made into an image by NASA/NOAA’s GOES Project at NASA’s Goddard Space Flight Center in Greenbelt, Md. The clouds and fallen snow data from NOAA’s GOES-East satellite were overlaid on a true-color image of land and ocean created by data from the Moderate Resolution Imaging Spectroradiometer or MODIS instrument that flies aboard NASA’s Aqua and Terra satellites.The image showed that the clouds associated with the storm were blanketing much of the U.S. East Coast.

At 3:11 a.m. EST, a surface map issued by the National Weather Service or NWS showed the storm’s low pressure area was centered over eastern North Carolina. Since then, the low has continued to track north along the eastern seaboard. By 11 a.m. EST, precipitation from the storm was falling from South Carolina to Maine, according to National Weather Service radar.

By 11 a.m. EST, the Washington, D.C. region snow and sleet totals ranged from 3″ in far eastern Maryland to over 18″ in the northern and western suburbs in Maryland and Virginia. NWS reported that snow, sleet and rain were still falling and more snow is expected as the back side of the low moves into the region.

The New York City region remained under an NWS Winter Storm Warning until 6 a.m. on Friday, February 14 and the National Weather Service expects minor coastal impacts Thursday into Friday afternoon.

New England was also being battered by the storm. At 10:56 a.m. EST, Barnstable, Mass. on Cape Cod was experiencing rain and winds gusting to 28 mph. An NWS wind advisory is in effect for Cape Cod until 7 p.m. EST.

Further north, Portland, Maine was experiencing heavy snow with winds from the northeast at 6 mph. The National Weather Service in Gray, Maine noted “Significant snowfall is likely for much of western Maine and New Hampshire as this storm passes by. There will be a mix or changeover to sleet and freezing rain over southern and coastal sections tonight…before all areas end as a period of snow Friday (Feb. 14) morning.”

On February 13 at 10 a.m. EST, NOAA’s National Weather Service noted “An abundance of Atlantic moisture getting wrapped into the storm will continue to fuel widespread precipitation…which should lift through the Mid-Atlantic States and Northeast Thursday into Friday. A wide swath of heavy snow accumulations are expected with this storm…but air [moving] off the warmer ocean water should change snow over to rain along the coastal areas. Also…a narrow axis of sleet and freezing rain will be possible within the transition zone…which is expected to set up near the I-95 corridor.” For updates on local forecasts, watches and warnings, visit NOAA’s www.weather.gov webpage.

GOES satellites provide the kind of continuous monitoring necessary for intensive data analysis. Geostationary describes an orbit in which a satellite is always in the same position with respect to the rotating Earth. This allows GOES to hover continuously over one position on Earth’s surface, appearing stationary. As a result, GOES provide a constant vigil for the atmospheric “triggers” for severe weather conditions such as tornadoes, flash floods, hail storms and hurricanes.

For updated information about the storm system, visit NOAA’s WPC website: http://www.hpc.ncep.noaa.gov/

bookmark_borderCalifornia Zero Water Allocation

Though much of the United States has been experiencing a cold, high precipitation winter, California has had extreme drought and fire conditions. The State Water Project announced the state reservoir will “effectively be closed for business.”

“This is the most serious drought we’ve faced in modern times,” Felicia Marcus, chairwoman of the State Water Resources Control Board said. “We need to conserve what little we have to use later in the year, or even in future years.”

“Today’s action is a stark reminder that California’s drought is real,” said Gov. Jerry Brown. “We’re taking every possible step to prepare the state for the continuing dry conditions we face.”

“The exceptional drought extends from north to south across parts of 11 counties including, southeast Santa Cruz, far southern Santa Clara, San Benito, Merced, western Fresno, eastern Monterey, eastern San Luis Obispo, western Kern, western Madera, Kings and southwest Tulare,” notes weather.com meteorologist Chris Dolce.

“Truly staggering was the fact that some locations picked up less than half the precipitation in 2013 of their previous record dry year, including Santa Cruz, Calif. (4.78″ vs. old record of 11.85″ in 1929) and the north San Francisco Bay suburb of Kentfield (7.80″ vs. old record of 20.30″ in 1939),” writes weather.com meteorologist Jon Erdman.

bookmark_borderRecord Breaking Cold Weather and Global Warming

Since we began studying global warming, there has been one thing all scientists could agree on — man-made warming of the Earth will cause an increase in extreme weather events.

We are not saying that the Earth’s temperature is just going to rise. In general, as energy is added to a system, the fluctuations in the system increase. So, we expect more storms, more droughts, more wildfires, more floods, more fluctuations of all kinds. What we are saying is that weather conditions will become more volatile due to the impact of humans. — Sidd Mukherjee & Daniel Brouse (2004)

When it come to the record breaking low temperatures of 2013 and 2014 in the United States, some people are tying to diminish the importance of curbing global warming.  The extreme events appear to give some humans the excuse to be delusional about human induced climate change. However, at this point in time, it is the ocean temperature we need be most concerned about.  The changes we are seeing  help cause the increase in volatility and extreme weather events.

Sorry to say, the ocean temperature is rising more rapidly than scientist had predicted.  Because of the way the Earth is warming, island nations are feeling the heat.  In fact, 2013 was the warmest year on record in Australia.

bookmark_borderHottest Year On Record

AUSTRALIA — Data collected and analyzed by the Bureau of Meteorology show that 2013 was Australia’s warmest year on record while rainfall was slightly below average nationally.

  • Summer 2012–13 was the warmest on record nationally, spring was also the warmest on record and winter the third warmest
  • Overall, 2013 was Australia’s warmest year on record: annual national mean temperature was +1.20 °C above average
  • All States and the Northern Territory ranked in the four warmest years on record
  • Nationally-averaged rainfall was slightly below average for the year, with 428 mm (1961–1990 average 465 mm)
  • Rainfall was mostly below average for the inland east and center, and above average for the east coast, northern Tasmania and parts of Western Australia

2013 was Australia’s warmest year since records began in 1910. Mean temperatures across Australia have generally been well above average since September 2012. Long periods of warmer-than-average days have been common, with a distinct lack of cold weather. Nights have also been warmer than average, but less so than days.

The Australian area-averaged mean temperature for 2013 was +1.20 °C above the 1961–1990 average. Maximum temperatures were +1.45 °C above average, and minimum temperatures +0.94 °C above average. Temperatures were above average across nearly all of Australia for maximum, mean and minimum temperatures, with large areas of inland and southern Australia experiencing the highest on record for each.

Australia has experienced just one cooler-than-average year (2011) in the last decade. The 10-year mean temperature for 2004–2013 was 0.50 °C above average, the equal-highest on record. Averages for each of the ten-year periods from 1995–2004 to 2004–2013 have been amongst the top ten records.

The Australian mean rainfall total for 2013 was 428 mm (37 mm below the long-term average of 465 mm). In comparison with rainfall in all years since 1900, 2013 sits close to the median or mid-point of historical observations.

Annual rainfall was below average across a large region of the inland east centered on western Queensland and extending into northern South Australia and the Northern Territory. Rainfall was above average over parts of the Pilbara and the south coast of Western Australia, as well as along the east coast and northern Tasmania.

More On Global Warming and Climate Change