bookmark_borderTurn out the lights… the fossil fuel party’s over.

October 15, 2018:
To: Sidd
RE: Energy and Climate Change
I’ve been thinking about a famous Sidd quote… and wonder if it still holds true?

Back in the day (2001), you recommended one of the best things to do was to turn off the lights!
“Turn out the lights… the fossil fuel party’s over.”
http://membrane.com/oil/

Since that time, some things have changed… sort-of… and I wonder if your thoughts have changed?

1) there is some evidence that light may be beneficial to plants and humans (perhaps other animals, too) … such as, sleep cycle, jet lag, depression, light effects on circadian rhythm, etc.

2) LED, compact fluorescent bulbs, etc. appear to be much less energy intense.

Is it ok to leave on some lights now?

Sidd replied:
heeehee, ya LED is much more energy efficient … but the light it provides is far from daylight. Nevertheless, LED electric consumption is much better.

But best of all is to frolic in the light of the sun.

Next turn off the AC and the heat. Deep eaves for shade and deciduous trees that shed their leaves in winter. And insulation, lots and lots of insulation.

The party’s definitely over tho. Hangover is gonna get worse.

sidd

The Human Induced Climate Change Experiment

bookmark_borderUnderestimated Flood Risk

https://eos.org/opinions/millions-more-americans-face-flood-risks-than-previously-thought

text follows:

Millions More Americans Face Flood Risks Than Previously Thought

A different modeling approach fills large gaps in the U.S. governmentâ??s
flood risk estimates, revealing previously overlooked at-risk areas often
surrounding small flood-prone streams.
A Spring Lake, N.C., resident is carried from her flooded home on 17
September 2018, in the aftermath of Hurricane Florence.
An 84-year-old resident of Spring Lake, N.C., is carried from her flooded
home on 17 September 2018. The home flooded when the Little River, a small
tributary to the Cape Fear River, crested its banks after Hurricane
Florence made landfall. Credit: Joe Raedle/Staff/Getty Images News/Getty
Images

By Oliver Wing, Paul Bates, Christopher Sampson, Andrew Smith, Joseph
Fargione, and Kris Johnson 15 hours ago

Over the past week, the United States saw floodwaters rise near the coast
of North Carolina in the aftermath of Hurricane Florence. Swollen rivers
have effectively cut off Wilmington, a city of some 119,000 residents, and
residents in surrounding regions are being ordered to evacuate as rivers
continue to rise and test the strength of dams. Thus far, the storm has
claimed 36 lives.

The cost in lives and property damage from Florence will take years to
assess; initial estimates suggest that Florenceâ??s damage could reach $30
billion. Add this to last yearâ??s triumvirate of devastating U.S.
hurricanesâ??Harvey, Irma, and Mariaâ??which saw a combined death toll of
3,100 and damages estimated to be $275 billion. Not surprisingly given
these events, decision-makers and the American public are focusing on
issues related to flooding from hurricanes and other sources.

FEMA mapping currently covers only about 60% of the conterminous United
States and may not represent headwater areas and smaller floodplains.
To mitigate potential losses from floods yet to come, we first need an idea
of where these damaging floods can occur. In the United States, this
information is provided by the Federal Emergency Management Agency (FEMA),
which produces maps of flood zones to help enforce regulations under the
National Flood Insurance Program.

The approach FEMA takes involves developing separate hydraulic models for
individual river reaches and then stitching the model outputs together to
generate a nationwide view. This traditional â??bottom-upâ?? approach is
the gold standard in flood inundation modeling.

But although the approach allows important local details to be captured, it
also requires significant resources and time to accomplish. Also, there is
no efficient way to rerun a given simulation to incorporate new data or
test new scenarios. As a result, FEMA mapping currently covers only about
60% of the conterminous United States (CONUS), and the maps may not
represent headwater areas and smaller floodplains.

You may ask, Surely thereâ??s a better way to evaluate flood risks? The
short answer is yes. It involves a â??top-downâ?? approach, harnessing big
data to automatically create flood inundation models from local to global
scales.

A New Approach to Calculating the 100-Year Floodplain

Over the past 5 years, researchers across the globe have started to develop
a set of these alternative top-down approaches to flood inundation modeling
over vast areas, taking advantage of increasingly available large data sets
and high-performance computing resources. These methods take available
digital elevation models (DEMs), river hydrography, and gauging station
data and use them to automatically create flood inundation models of whole
regions, countries, or even the world.

Such approaches do not currently outperform local bespoke modeling, but
many flood management questions can be answered only by consistent flood
maps with the type of complete coverage that these top-down methods
produce. For many flood management questions, it may also be acceptable to
sacrifice a small amount of local accuracy to achieve a national-scale view.

We recently conducted a study [Wing et al., 2018] to quantify the number of
people exposed to flooding in the CONUS using just such a top-down
approach. Our team spanned both sides of the Atlantic, from the University
of Bristol and Fathom (a flood analytics company) in the United Kingdom and
The Nature Conservancy and the Environmental Protection Agency in the
United States.

(top) A new approach shows that 3 times more Americans are exposed to a
1-in-100-year flood than (bottom) FEMAâ??s estimate.
Fig. 1. (top) A large-scale modeling approach [Wing et al., 2018] estimates
the nationwide distribution of people exposed to a 1-in-100-year flood to
be about 3 times the estimate arrived at by (bottom) a local FEMA model
approach.
The regulatory flood zone mapped by FEMA captures the areas of land that
have a 1% or greater chance of being inundated in any given year, or to put
it another way, areas that would be expected to experience at least one
flood every 100 years. Using bottom-up approaches to calculating population
exposure (i.e., within these FEMA flood zones), we estimated that 13
million people are at risk of this so-called 100-year flood (Figure 1).

Our transatlantic team performed the same calculation with an automated,
large-scale hydraulic model covering the entire CONUS at ~30-meter
resolution [Wing et al., 2017]. We found that almost 41 million
peopleâ??more than 3 times the FEMA estimateâ??are exposed to the
possibility of a 100-year flood [Wing et al., 2017; Smith et al., 2015;
Sampson et al., 2015].
Comparing the Flood Maps

Both flood maps are the output of hydraulic models that in their simplest
sense receive input in the form of an extreme river flow. The models then
work out how this translates to flood extent on the ground.

Two key pieces of information are required: the magnitude of the extreme
river flow and the elevation of the adjacent land. The input to both
models, the 1-in-100-year maximum discharge for a particular stretch of
river, is calculated on the basis of historic annual river gauge records.
The lay of the land is determined by a DEM. The quality of DEMs varies
across the United States; the majority of densely populated areas are
covered by highly accurate airborne laser scanning (lidar) data, with
correspondingly sparser coverage in less populated areas.
Flood map in Illinois shows FEMAâ??s tendency to focus on larger rivers,
missing flood risks associated with smaller streams.
Fig. 2. A typical snapshot of the flood maps produced by each model
approach for an area of Illinois demonstrates FEMAâ??s tendency to focus on
larger rivers, missing the flood risk associated with smaller streams. Our
modeling method, on the other hand, captures a finer level of detail.

Thus, although both FEMAâ??s bottom-up approach and our top-down approach
use the same input, the two methods produce different estimates of exposed
populations. Examining the simulation results obtained using both
approaches highlights why the discrepancy in flood-exposed population
estimates arises. Unlike the FEMA map, our map is able to estimate flood
hazard in all basins down to just a few square kilometers in area, thus
capturing the risk posed by smaller streams (Figure 2).

How does our top-down approach achieve a higher precision than FEMAâ??s
bottom-up approach? Our approachâ??s ability to represent smaller streams
is not by virtue of obtaining better or more localized data. Rather, our
spatially consistent, automated, and efficient model-building process,
coupled with our computational capacity, can produce flood maps in every
river basin. In contrast, FEMAâ??s highly detailed approaches take skilled
operators several months to perform for river reaches a few tens of
kilometers in length, and this is why spatial coverage is relatively low.
FEMA engineers triage the larger streams in a catchment, often to the
detriment of the headwaters, whereas our approach captures conditions in
the headwater areas as well.

A map comparing our large-scale model with FEMAâ??s model for an area of
Alabama.
Fig. 3. A map comparing our large-scale model with FEMAâ??s model for an
area of Alabama. The two approaches produce similar results here, where the
FEMA data exist, with our large-scale floodplain model capturing more than
90% of the FEMA floodplain with minimal genuine overprediction. From Wing
et al. [2017].
The caveat here is that our approach sacrifices some local accuracy to
achieve this broad view of flood hazard across the CONUS. In areas where
FEMA models do contain detailed surveys of flow-controlling structures
(e.g., levees, culverts, dikes, bridges), these models will likely
supersede the large-scale alternative. However, a study that performed a
point-by-point comparison between the FEMA model and large-scale models
suggests that where FEMA maps exist, the two approaches often produce
similar results (Figure 3).

Compared to high-quality FEMA flood maps, the large-scale model captured
86% of the specified floodplain [Wing et al., 2017]. The correspondence was
even better on larger rivers, in temperate climates, and in more rural
basins. This top-down model therefore fills in the areas that the bottom-up
FEMA maps miss, such as areas around small streams and across broad swaths
of the midwestern and northwestern United States.

We find that this data gap equates to an extra 28 million Americans living
in the 100-year flood zone. This difference is so large that even amid
likely model uncertainties, it is a significant result.
Implications for Flood Risk Management in the United States

Scientists and policy makers require comprehensive floodplain mapping to
manage U.S. flood risk in a coordinated way. Accurate, engineering-grade
flood models in every river basin in the CONUS would be ideal, but given
realistic financial constraints, it is clear that we need new, affordable
approaches to generating comprehensive national maps.

Through a large-scale modeling approach, nationwide flood maps can be
produced quickly and relatively cheaply.
An understanding of flood risk across the nation, rather than in patches,
could lead to fewer surprises akin to Hurricanes Harvey in Texas and Irma
in Florida. Such a comprehensive understanding could also assist opponents
of continued development in risky areas and ensure that the culture of
preparedness FEMA wishes to build becomes a reality across the country.

In addition, a large-scale modeling approach can answer a number of crucial
questions that cannot be addressed by a patchwork of local models. Because
nationwide flood maps can be produced quickly and relatively cheaply, a
wealth of new products could be generated. For example, in addition to the
100-year floodplain, other return periods can be mapped, which enables
improved risk management through a graded system. With this information,
community authorities could perhaps seek to impose more stringent
regulations on buildings in the 1-in-20-year floodplain while relaxing
those in the 1-in-500-year floodplain.

This nuanced approach could also lead to more realistic risk assessments
and flood preparation measures. Right now, risk zones in maps are treated
as binary, which can be problematic: People who live just outside the
currently mapped 100-year flood boundary do not face considerably less risk
than people who live just within it. Yet new development tends to cluster
around these boundaries, often still in risky areas. Maps that contour
risks in a more detailed way could prevent this effect through ensuring a
smoother gradient of development increase as you move farther outside of
the higher risk zones.
Flood waters from rising rivers inundate the town of Trenton, N.C. on 16
September 2018, following Hurricane Florence.
Floodwaters from rising rivers and streams inundate the town of Trenton,
N.C., on 16 September 2018, following Hurricane Florence. Credit:
Associated Press/Steve Helber

Large-scale and automated modeling approaches offer flexibility as well:
The ability to rerun multiple flood maps allows modelers to test the effect
of different scenarios by perturbing inputs to the model. For example, the
effects of climate change, population growth, land use change, and flood
risk management scenarios can be included for making decisions on a
national scale.

Large-scale models wonâ??t completely replace the bottom-up approach:
Certain decisions can only be made using accurate local modeling
techniques. There is unambiguous value to engineering-grade local models.
Such models are needed, for example, when exploring the effect of
installing or removing levees. Highly localized decisions will still
require a FEMA-style analysis.
What Next for Hydraulic Modelers?

Flood inundation models, two types of which are outlined here, are subject
to fundamental constraints with regard to their accuracy. The performance
of FEMA-style models is approaching a ceiling: The characterization of
extreme flows often imposes a fundamental limit on further model
improvements. Errors of 25% or more are common in gauge observations [Di
Baldassarre and Montanari, 2009], and there are gaps in the data required
for the statistical analysis used to calculate flow return periods [Smith
et al., 2015].

There is little value to a centimeter-scale hydraulic model if you donâ??t
actually know how big the 100-year flow is.
For modeling results to be meaningful, any improvements in calculations
must be accompanied by commensurate improvements in the measured data and
other factors in the modeling approach. For instance, there is little value
to a centimeter-scale hydraulic model if you donâ??t actually know how big
the 100-year flow is.

This need for better data, coupled with the need for many more decades or
even centuries of river flow observations and an expanded river gauge
network, means that the flow characterization gap is not likely to be
resolved any time soon.

There is, however, still plenty of room for improvement in large-scale
modeling. For example, scientists have yet to generate seamless,
hyperresolution DEMs of entire continents, and the remote detection of
local-scale, hydraulically important features is not yet feasible. With
solutions to these problems on the horizon, it may not be long before
large-scale models, too, hit the ceiling imposed by extreme flow
characterization.

Despite these limitations, scientists assessing flood risk could expand and
deepen their insights using a multimodel approach similar to the approach
that climate scientists use. Also, on an international scale, the next big
step is to run flood models with data from the high-accuracy DEM of the
world. Creating a high-resolution global flood hazard model [Sampson et
al., 2015] could help identify at-risk populations in areas like Africa,
South America, and Southeast Asia that donâ??t have FEMA-style local flood
maps.
Floods of Data Can Help Address Flood Risk

To help protect people from floods, we will continue to need a deluge of data.
Without freely available data, we could not have conducted our assessments,
which means that we could not have identified that millions of Americans
face flood risks beyond those charted in FEMA maps. One thing, then, is
clear: To help protect people from floods, we will continue to need a
deluge of data.

Ultimately, better predictions also require better data, which is why
itâ??s so important that the United States continues to fund U.S.
Geological Survey (USGS) efforts to maintain river gauges and expand lidar
data coverage to areas in the United States that lack this coverage. And it
is equally important that the USGS continue to make these data public.
References

Di Baldassarre, G., and A. Montanari (2009), Uncertainty in river discharge
observations: A quantitative analysis, Hydrol. Earth Syst. Sci., 13,
913â??921, https://doi.org/10.5194/hess-13-913-2009.

Sampson, C. C., et al. (2015), A high-resolution global flood hazard model,
Water Resour. Res., 51, 7358â??7381, https://doi.org/10.1002/2015WR016954.

Smith, A., C. Sampson, and P. Bates (2015), Regional flood frequency
analysis at the global scale, Water Resour. Res., 51, 539â??553,
https://doi.org/10.1002/2014WR015814.

Wing, O. E. J., et al. (2017), Validation of a 30 m resolution flood hazard
model of the conterminous United States, Water Resour. Res., 53, 7968-7986,
https://doi.org/10.1002/2017WR020917.

Wing, O. E. J., et al. (2018), Estimates of present and future flood risk
in the conterminous United States, Environ. Res. Lett., 13, 034023,
https://doi.org/10.1088/1748-9326/aaac65.

More About Flood Insurance

bookmark_borderClimate Change Is Happening Faster

Researchers are reporting in the journal Science that climate change is happening faster than what was forecast. What we thought would take 20,000 is going to happen in 100 years if we don’t take serious action.

Past and future global transformation of terrestrial ecosystems under climate change

by Connor Nolan1, Jonathan T. Overpeck2,1, Judy R. M. Allen3, Patricia M. Anderson4, Julio L. Betancourt5, Heather A. Binney

Future predictions from paleoecology

Terrestrial ecosystems will be transformed by current anthropogenic change, but the extent of this change remains a challenge to predict. Nolan et al. looked at documented vegetational and climatic changes at almost 600 sites worldwide since the last glacial maximum 21,000 years ago. From this, they determined vegetation responses to temperature changes of 4° to 7°C. They went on to estimate the extent of ecosystem changes under current similar (albeit more rapid) scenarios of warming. Without substantial mitigation efforts, terrestrial ecosystems are at risk of major transformation in composition and structure.

Science, this issue p. 920

bookmark_borderRising Seas and Declining Infrastructure

Miami’s Other Water Problem

—
If a coastal neighborhood will have to be abandoned anyway, is it worth spending money on new sewers?

“People will hang on with their fingernails to keep what they’ve got,” Stoddard says. “But who’s going to move here? And that’s what’s going to kill us.”

—

Read the whole thing.
sidd

Miami Will Be Underwater Soon. Its Drinking Water Could Go First

Miami-Dade is built on the Biscayne Aquifer, 4,000 square miles of unusually shallow and porous limestone whose tiny air pockets are filled with rainwater and rivers running from the swamp to the ocean. The aquifer and the infrastructure that draws from it, cleans its water, and keeps it from overrunning the city combine to form a giant but fragile machine. Without this abundant source of fresh water, made cheap by its proximity to the surface, this hot, remote city could become uninhabitable.

More About Rising Sea Levels and Real Estate

bookmark_borderFlood Risk and Real Estate Values

The risk of floods increasing do to human induced climate change is affecting real estate values. Though the risk is increasing in all flood zones, coastal areas are already feeling the pain. Most homeowner’s don’t know about flood insurance until they need it. Then, it is too late.

Bloomberg News reports:

Recent research confirms that the climate threat is already showing up in prices. Economists Asaf Bernstein, Matthew Gustafson and Ryan Lewis have a recent paper showing that houses exposed to sea-level rise of between 0 and 6 feet have been selling at a 7 percent discount relative to houses a similar distance from the beach that aren’t exposed. The time period they look at is 2007-2016 — before the damage from Harvey. They also confirm that the discount is higher in locations where people report more worry about climate change.

Another recent study, by environmental researchers Jesse Keenan Thomas Hill and Anurag Gumber, shows something similar. Focusing on Miami-Dade County, they show that higher-elevation locations have risen in price faster than similar locations at low elevations. That’s consistent with the theory that wealthy buyers pay a premium to escape flooding risk.

More About Flood Insurance

bookmark_borderShorefalling Rainstorms

i have been reading of the floods in kerala (india, southwest)
and i just realized it isn’t just sea level rise and storm surge

these shorefalling rainstorms

a) pick up huge amounts of water off the ocean
b) drop it inland as they come ashore
c) all that water has to get out thru existing waterways
d) which is difficult, the same system has dumped a lot closer to shore already
e) and, of course added to stormsurge and sea level rise

the floods will come from both directions, the land and the ocean.
It is difficult to say which is worse, for the floods coming in from the land
will carry debris, and worse, poisons from pollution.

move far inland. The ocean, as i have said b4 is very large and wants in your basement.
But i didnt see clearly until now that watching oceanward is not enuf,
it can go over our heads thru the clouds and come in behind us.

Shoulda figured that out after Sandy.

I’m slo, but i get there.

sidd

LIVE

Kerala floods live
updates: Over 10
lakh in relief
camps; Centre declares disaster ‘calamity of severe nature’
Times of India
17 mins ago

LIVE

Kerala floods LIVE:
Devastation to cost
the state Rs 20000
cr, 40000 crore hectares of crops destroyed, says CM
Moneycontrol
52 mins ago
Bodies Found As
Water Recedes In
Kerala, Hundreds
Still Stuck: 10 Points
NDTV.com

More for kerala flood

Affected area
Affected area map

View on map

bookmark_borderExtreme Weather Events Getting More Extreme

The U.N. has released a report entitled, “Extreme Weather Continues in 2018 – a Continuing Call to Climate Action”.

Addressing the dangers associated with extreme weather conditions, the Executive Secretary of the UN Climate Change Patricia Espinosa said: “We must keep an eye on the future. As the superstorms and monsoon flooding of last year and the extreme heat and extreme cold of this year show – we still have a long way to go to deliver on the promise of the Paris Climate Change Agreement”.

This year, record warmth was observed across parts of North America, Europe and Asia, as well as the Atlantic, Pacific and Indian Oceans. Record cold May temperatures were limited to northeastern Canada and the northern Atlantic Ocean, off the southern coast of Greenland.

The study published in the journal Nature showed that ice losses from Antarctica are causing sea levels to rise faster today than at any time in the past 25 years. Results of the Ice Sheet Mass Balance Inter-Comparison Exercise (IMBIE).

According to NASA, “Antarctica’s potential contribution to global sea level rise from its land-held ice is almost 7.5 times greater than all other sources of land-held ice in the world combined. The continent stores enough frozen water to raise global sea levels by 190 feet (58 meters), if it were to melt entirely. Knowing how much ice it’s losing is key to understanding the impacts of climate change now and its pace in the future.”

NOAA points to climate change as part of the problem causing the largest wildfires in California.

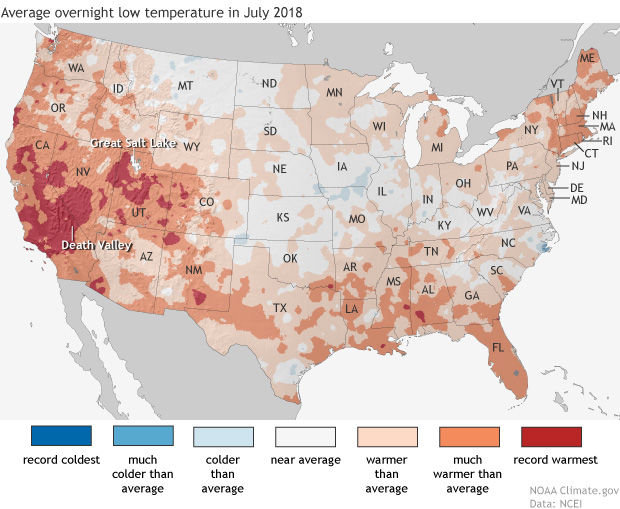
Daytime high temperatures were well above average across much of the western United States in July, but it was overnight low temperatures that were really extreme in large areas of California—where firefighters are battling multiple wildfires—and the Great Basin, and in isolated pockets of Colorado and the Southwest.

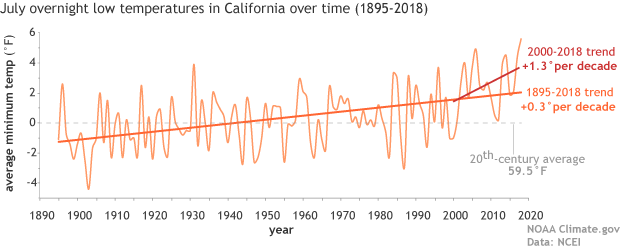
Map of the contiguous United States showing July 2018 overnight low temperature ranksAs the NCEI’s Deke Arndt has blogged about before, nighttime low temperatures are increasing faster than daytime high temperatures across most of the contiguous United States. For much of the West and Southwest, July’s record-breaking nighttime heat is a new highpoint in a long-term trend—one that has rapidly accelerated in recent decades. In California, average overnight low temperature in July rose by 0.3°F per decade over the historical record (1895-2018), but since 2000, the pace of warming has accelerated to 1.3°F per decade.

graph of July minimum temperature 1895–2018 with long-term trend and trend since 2000 shown

Average July minimum temperatures (overnight lows) in California  (light orange line) from 1895–2018. The trend over the historical record is shown in dark orange, and the recent trend (2000-2018) is shown in red. The twentieth-century average is shown with a gray line. NOAA Climate.gov graph, based on data from NCEI’s Climate at a Glance.

According to Tim Brown, director of NOAA’s Western Region Climate Center (WRCC), it’s a pattern that has serious consequences for wildfires and those who combat them. When temperatures cool off overnight, it’s not just a physical relief for firefighters who may be working in conditions that push the limits of human endurance; fire behavior itself relaxes as temperatures drop, winds grow calmer, and relative humidity rises. He explained via email,

Moisture in dead vegetation continuously tries to reach equilibrium with atmospheric moisture. So if nighttime temperature is staying warmer, then the humidity is lower, and the fuels stay drier. A dead fuel moisture reduction of a few percent can increase flammability, flame length, and subsequent overall fire behavior.

When fires remain active at night, it can increase both the time to containment and total burned area, while also affecting public health and safety through more smoke production and lower air quality.  Brown says that qualitatively, there seems to be an increase in firefighters’ reports of active nighttime fire behavior since around 2000.  He and other researchers are currently investigating whether that relationship can be confirmed quantitatively.

satellite image of fires and smoke near Clear Lake, California on August 6, 2018

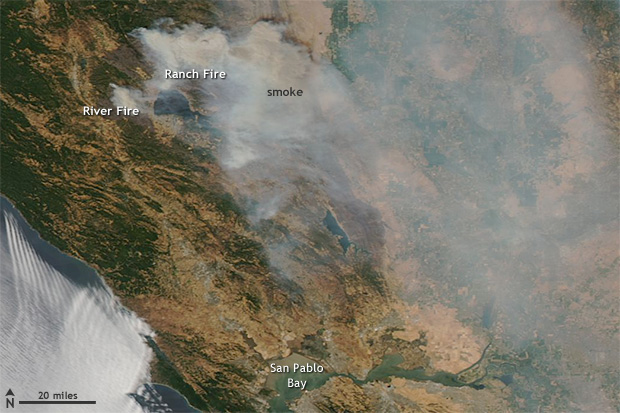
NASA Aqua satellite image of the Ranch and River Fires in Northern California on August 6, 2018, with a pall of smoke spreading to the east.  These fires are part of the Mendocino Complex  Fire, which has become the largest fire in California history.  Extreme fire activity in the state was exacerbated by record-warm overnight low temperatures in July. Image from NASA Worldview website.

Nighttime warming has consequences for other aspects of public health. WRCC climatologist Nina Oakley pointed out via email that the South Coast region of California is experiencing the largest warming trends in nighttime temperatures, according to an environmental health hazard report from the California Environmental Protection Agency. In many communities in the region, air conditioning—rarely needed in the past—is uncommon. In addition, since 2000, heat waves in California have become more humid. In the report, experts offered a warning about the change:

People, animals, and plants that are adapted to California’s traditionally dry daytime heat and nighttime cooling are unable to recover from extreme heat, especially when humidity is high at night. The increase in nighttime heat waves presents an additional risk factor for vulnerable populations.

The rapid increase in the rate of warming in California and other parts of the U.S. West since the start of the new century is a sharp reminder that we can’t necessarily count on the future changing as slowly as the past. Asked about the July nighttime heat in California, California state climatologist Mike Anderson answered via email, “As for the past decade or two, we have noticed observations have looked different than the rest of the historical record. We are consistently sampling at the warm edge of the historical distribution now, and expectations are for that to continue, with new records being set with increasing frequency in the coming years.”

Parts of Pennsylvania recorded record rainfall during the summer of 2018 with frequent “tropical downpours” delivering thirteen or more inches of rain in a 5 day period. The Penn Environment Organization released a report entitled, “Hitting Close to Home | Global Warming is Fueling Extreme Weather Across the U.S.”

Weather-related disasters affect millions

  • Since September 2010, counties housing 84 percent of the total Pennsylvania population (over 10 million residents) were affected by federally-declared weather disasters.
  • Pennsylvania experienced five weather-related disasters, including severe storms, tornadoes, floods, and tropical storms since September 2010.

Extreme weather causes widespread destruction

  • In February 2015 a large winter storm and associated cold wave impacted many central, eastern and northeastern states, including Pennsylvania. The storm and cold wave caused at least 30 deaths and the total estimated costs were over $1 billion in the affected region.
  • In October 2012 Hurricane Sandy caused extensive damage to several states, including Pennsylvania from wind, rain, and heavy snow. Hurricane Sandy caused at least 159 deaths and the total estimated costs were $67.6 billion in the affected regions.
  • Since 2010, extreme weather events have caused at least 30 power outages in Pennsylvania, including one outage that lasted 10 days in 2012 during Hurricane Sandy. [3]


Weather extremes are becoming more common 

Globally, 2015 was Earth’s hottest year on record, surpassing 2014. [4] Many types of extreme weather are expected to become more frequent or severe in a warming world, which could lead to more weather-related disasters.

  • Tropical Storms and Hurricanes: Global warming has the potential to make tropical storms more destructive. Hurricanes and other coastal storms are likely to be more powerful [5] and rainier, [6] while storm surges could be more destructive as sea levels rise. [7]
  • Heavy Rain and Snow: Extreme precipitation is already increasing; continued trends could increase the risk of intense downpours, heavy snowstorms and severe flooding. [8]
  • Droughts and Wildfires: While global warming is anticipated to bring more rain to some areas, it will also likely elevate temperatures and extend dry spells. The potential for stronger drought—and greater area burned by wildfires—will increase, particularly in the West and Southwest.

Every year the World Economic Forum publishes the Global Risks Report. This year’s report suggests that experts anticipate another year of heightened risk. From the approximately 1000 respondents of the annual Global Risks Perception Survey, 59% expect an intensified risk, compared to 7% pointing to declining risks.

Environmental risks have grown in prominence over the 13-year history of the Global Risks Report. This trend continues in the 2018 report. All five risks in the environmental category are ranked higher than average in both likelihood and impact over a 10-year horizon.

“Extreme weather events” and “Natural disasters” rank among the top three risks in terms of likelihood and impact. “Failure of climate-change mitigation and adaptation” ranks among the top five.


The Human Induced Climate Change Experiment (Global Warming Research and Educational Materials)

bookmark_borderFlood Losses

South Carolina, Virginia, Georgia and Florida because of sea
level rise flooding from 2005 to 2017. ”

Florida: -$5.42 billion

South Carolina: -$1.11 billion

North Carolina: -$582 million”

https://www.charlotteobserver.com/news/science-technology/article215476785.html

https://www.floodiq.com/

https://b.floodiq.com/methodology

https://link.springer.com/article/10.1007%2Fs11113-018-9473-5

https://link.springer.com/content/pdf/10.1007%2Fs11113-018-9473-5.pdf

Boston climate risks:

https://www.cnbc.com/2018/05/30/waterfront-real-estate-in-boston-rises-in-the-face-of-stronger-storms.html

bookmark_borderFlood Insurance Rates Rising

“your flood insurance premiums could rise up to 18 percent each year”

A recent article in the Miami Herald reports:

“FEMA confirmed to the Miami Herald that it is looking into switching to risk-based pricing in 2020, which would end the subsidies most coastal communities enjoy on their flood insurance premiums and show the true dollar cost of living in areas repeatedly pounded by hurricanes and drenched with floods — like South Florida.

“That means insurance is about to become very expensive, and it kind of sounds the bell that these are high-risk areas,” said Wayne Pathman, a Miami-based land use attorney and chair of the city’s Sea Level Rise Committee.

Premiums through the National Flood Insurance Policy are already rising an average of eight percent this year; the first wave of pricier policies started in April. That brings the average annual price (including surcharges) for a policy holder to $1,062.

It’s all part of a strategy to make the NFIP financially stable. The program is $20 billion in debt (and that’s after the government forgave $16 billion of that debt last year) because it pays out much more each year than it takes in.”

More about Flood Insurance
More about Climate Change

bookmark_borderRising Sea Level and the Internet

In a study published by the University of Wisconsin-Madison, authors concluded the infrastructure of the Internet is at risk due to global warming and rising sea levels.

“Thousands of miles of buried fiber optic cable in densely populated coastal regions of the United States may soon be inundated by rising seas….”

“Most of the damage that’s going to be done in the next 100 years will be done sooner than later,” says Barford, an authority on the “physical internet” — the buried fiber optic cables, data centers, traffic exchanges and termination points that are the nerve centers, arteries and hubs of the vast global information network. “That surprised us. The expectation was that we’d have 50 years to plan for it. We don’t have 50 years.”

Many of the conduits at risk are already close to sea level and only a slight rise in ocean levels due to melting polar ice and thermal expansion as climate warms will be needed to expose buried fiber optic cables to sea water. Hints of the problems to come, says Barford, can be seen in the catastrophic storm surges and flooding that accompanied hurricanes Sandy and Katrina.

The Human Induced Climate Change Experiment