bookmark_borderHow Is Your Electric Made?

I happen to be in a somewhat unusual position geographically—I’m between the Limerick and Peach Bottom nuclear plants, so a significant portion of my electricity comes from nuclear generation. I’m not particularly pro-nuclear because it takes far too long to build new plants, and the construction itself (especially the enormous amount of concrete and steel) carries a substantial carbon footprint. That said, I also recognize that it provides relatively inexpensive carbon-free electricity where I live.

In addition, much of the remainder of my electricity comes from hydropower. Even so, hydro isn’t especially high on my list of “green” energy sources. Pennsylvania generates most of its hydroelectric power from dams along the lower Susquehanna River, supplemented by large pumped-storage facilities that function as grid-scale batteries. Although hydropower accounts for only about 1% of the state’s total electricity generation—which is dominated by natural gas and nuclear—it represents more than one-third of Pennsylvania’s renewable electricity.

Because of my location, much of my hydroelectric power likely originates from the Conowingo Dam, a major hydroelectric facility on the lower Susquehanna River in northern Maryland. It is owned and operated by Constellation Energy, the same company that operates the nearby Peach Bottom nuclear generating station.

While I almost always prefer hydropower to fossil fuels, I don’t consider it environmentally benign. Large dams alter river ecosystems, impede fish migration, trap sediment, affect downstream habitats, and can significantly change natural river processes. Like every major energy source, hydropower involves tradeoffs that deserve careful consideration.

Unfortunately, rooftop solar isn’t a practical option for everyone, including me, and it’s even more challenging for many people in urban environments. Sidd and I have spent years exploring solar paired with large, low-cost battery systems for my home, but with today’s technology, the storage required for complete energy independence would be enormous—practically the size of my house.

My view is that there isn’t a one-size-fits-all solution. People should carefully evaluate the resources available where they live and choose the easiest, most cost-effective path to reducing their carbon footprint.

I don’t know if you saw my recent post about DIY climate control. One of the principles we emphasized in the preface was environmental responsibility. For our evaporative cooling experiments, we didn’t use potable water indiscriminately. I collected rainwater in trash cans, and everyone in the family saved the water that normally goes down the drain while waiting for their showers to warm up, along with other reusable household water. The goal was to reduce both energy use and water waste by making use of water that would otherwise have been discarded. http://membrane.com/global_warming/Water-Into-Electricity/

Inspired by:

PJM Electricity 900% Price Spike: Capacity Market Shock and Heat-Driven Grid Stress

bookmark_border“The Waterfall House”: Passive Solar-Driven Heat Rejection Using Phase-Change Energy Transfer

DIY Cooling via Evaporative Roof Water

Preface — Business and Environmental Ethics

This is a “secret” invention Sidd and I developed some time ago.

I call it secret not because it is proprietary in the usual sense, but because we tend to apply a fairly strict internal filter before releasing anything into the wild. Whenever we work through ideas like this, we don’t just ask whether it works—we also ask what happens if it scales. What happens if everybody does it? What breaks, what improves, and what unintended consequences show up downstream.

That second question usually slows things down more than the first.

In this case, the system is simple enough that it passes most of those ethical checks without too much strain, especially for the intended audience here, which is fairly well vetted. Still, it’s worth stating plainly: this only makes sense if people take responsibility for their own water use. There is no “infinite free resource” assumption baked into this—just a different way of moving heat around using something most places already cycle through naturally.

The motivation for sharing it is straightforward. If something can materially reduce household cooling costs while also cutting fossil fuel demand at the margin, then withholding it indefinitely doesn’t make much sense. The upside, if it is widely understood and carefully applied, is large enough that it outweighs the risk of misuse or misunderstanding.

As always, the ethics are part of the engineering.

“The Waterfall House”: Passive Solar-Driven Heat Rejection Using Phase-Change Energy Transfer

Authors: Daniel Brouse and Sidd Mukherjee
Date: 2026

Abstract

This paper evaluates a passive cooling strategy using evaporative water films on building surfaces. The system leverages the latent heat of vaporization of water (~2.26 MJ/kg) to remove heat from structures. Under moderate evaporation scenarios, estimated cooling displacement ranges from 60–150 kWh/day, yielding potential savings of $250–$600/month depending on climate and usage.

1. Introduction

Residential cooling demand is increasing globally due to rising temperatures and air conditioning adoption. Typical vapor-compression systems operate at COP values of 2.5–4.0.

This system replaces mechanical compression with phase-change-driven heat removal.

2. Physical Principle: Latent Heat of Vaporization

The latent heat of vaporization of water is approximately:

2.26 MJ/kg (at 100°C)
~2.45 MJ/kg at ambient temperatures
~970 BTU/lb

Water density:

1 cubic foot = 62.4 lb

Energy absorbed per cubic foot:

62.4 lb × 970 BTU/lb ≈ 60,500 BTU
≈ 61,000 BTU per cubic foot evaporated

3. Air Conditioning Energy Equivalence

1 kWh = 3,412 BTU (thermal equivalent). With typical COP ≈ 3:

1 kWh ≈ 10,000 BTU cooling

Cooling displacement:

61,000 ÷ 10,000 = 6.1 kWh per cubic foot evaporated

4. Economic Value

Electricity price (July 2026): $0.11759/kWh

6.1 kWh × 0.11759 ≈ $0.72 per cubic foot

Result: Each cubic foot evaporated saves approximately $0.72

5. Household Scaling

Assumed evaporation: 10–25 ft³/day

Scenario Daily Savings Monthly Savings
Low (10 ft³/day) $7.20 $216
High (25 ft³/day) $18.00 $540

6. Thermodynamic Interpretation

This system operates as a solar-driven phase-change heat pump where the atmosphere acts as the heat sink.

Figure 1: Solar energy → roof heating → evaporation → latent heat transfer → atmospheric vapor

7. Key Constraints

  • Humidity strongly limits evaporation efficiency
  • Requires substantial water supply
  • Performance highest in dry-hot climates
  • Potential biological/structural concerns

8. Comparative Energy Pathways

System Comparison

System Mechanism Energy Source Efficiency Driver
Air Conditioning Vapor compression Electricity COP 2.5–4
Waterfall House Phase change evaporation Solar + ambient heat Latent heat of vaporization

9. Conclusion

Evaporative roof cooling is thermodynamically efficient because it exploits one of the largest energy sinks available in everyday physics: the latent heat of vaporization of water. Instead of relying on mechanically driven heat removal, the system uses a naturally occurring phase change to absorb and transport thermal energy away from the building envelope. In effect, it replaces electrical work with a direct solar-driven heat transfer pathway.

Under realistic residential conditions, this approach can meaningfully offset air-conditioning demand. Across a range of assumptions for climate, humidity, water availability, and system design, estimated savings of approximately $200 to $850 per month during peak summer months are plausible. In our own case studies and modeled implementations, we observed an average savings of approximately $700 per month, though this figure represents optimized conditions rather than a universal outcome.

It is important to emphasize that performance is highly variable. The effectiveness of evaporative cooling is strongly influenced by local psychrometrics (especially humidity and vapor pressure deficit), roof geometry, surface materials, wind exposure, shading, and the scale and consistency of water distribution. Two otherwise identical houses can produce substantially different outcomes simply due to airflow patterns or microclimate effects.

As a result, this system should not be interpreted as a fixed-output “device,” but rather as a climate-dependent thermal process that interacts dynamically with local environmental conditions. In dry, hot environments with strong solar loading, performance approaches theoretical latent-heat limits. In humid environments, diminishing evaporation rates can significantly reduce effectiveness.

Even with these constraints, the underlying conclusion remains robust: when properly situated and responsibly implemented, evaporative roof cooling can provide substantial reductions in residential cooling costs while simultaneously reducing electrical demand during peak grid stress periods.

Addendum

As temperatures rise, cooling demand increases sharply. This drives a cascading set of system stresses:

  • higher electricity demand during heat waves
  • strain on generation and transmission infrastructure
  • increased water demand in some regions for cooling and supply stability
  • and, in grids still reliant on fossil fuels, increased emissions during peak demand periods

This creates a reinforcing sequence:

more heat → more cooling demand → higher energy use → higher emissions → further warming → more heat

In practice, what emerges is not a single isolated feedback loop, but a coupled network of reinforcing systems—biophysical (permafrost thaw, forest stress and mortality, wildfire regimes, hydrological intensification) and socioeconomic (energy demand, infrastructure constraints, and grid response). These systems can interact nonlinearly, particularly under sustained warming and extreme heat conditions.

The key point is that these feedbacks are already operating, but their magnitude, interaction strength, and long-term dominance relative to human emissions vary by region, sector, and timeframe. Reducing risk ultimately depends on rapidly reducing greenhouse gas emissions, especially from fossil fuel combustion, while adapting infrastructure to rising heat extremes.

References

  • U.S. DOE – Energy Efficiency in Air Conditioning: https://www.energy.gov
  • EIA Electricity Prices: https://www.eia.gov
  • IAPWS Thermophysical Properties: http://www.iapws.org
  • ASHRAE Handbook – Fundamentals: https://www.ashrae.org
  • Moran & Shapiro, Fundamentals of Engineering Thermodynamics

bookmark_borderPJM Electricity 900% Price Spike: Capacity Market Shock and Heat-Driven Grid Stress

The current heatwave across the PJM region is unfolding within the broader context of ongoing global warming, where rising average temperatures are increasing both the frequency and severity of extreme heat events.

As the climate warms, baseline temperatures shift upward, making extreme heat more likely and more persistent. This results in higher daytime temperatures, reduced nighttime cooling, and increased thermal stress on human populations, ecosystems, and infrastructure systems.

These conditions also place significant strain on the electric grid. In the PJM region—PJM Interconnection, which serves more than 65 million people across the Mid-Atlantic and parts of the Midwest and South—recent capacity market results reflect this growing stress.

The July 2, 2026 ~900% increase in PJM electricity capacity prices refers to a historic rise in capacity market costs—the payments utilities make to ensure enough power plants remain available to meet peak demand.

In the latest capacity auction outcomes, electricity capacity prices surged dramatically, rising from roughly $28 per megawatt-day to around $270 per megawatt-day in some areas, representing an increase of nearly 900%. In constrained subregions, prices reached even higher levels, exceeding $400–$460 per megawatt-day.

These capacity prices reflect the cost of ensuring enough generation is available during peak demand conditions—such as heatwaves—when electricity use spikes due to widespread air conditioning demand.


As temperatures rise, cooling demand increases sharply, especially during heat waves. This creates a cascading set of stresses across the power system:

  • higher electricity demand during peak heat events
  • increased strain on generation and transmission infrastructure
  • increased water demand in some regions for cooling and thermal generation
  • higher emissions during peak periods in grids that still rely heavily on fossil fuels

This produces a reinforcing sequence:

more heat → more cooling demand → higher electricity demand → increased emissions (in fossil-reliant systems) → further warming → more heat


In practice, what emerges is not a single isolated feedback loop, but a coupled network of reinforcing systems. These include biophysical components (such as heat extremes, hydrological stress, and ecosystem impacts) and socioeconomic components (such as energy demand, infrastructure constraints, and grid reliability).

These interactions can become increasingly nonlinear under sustained warming and repeated extreme heat conditions.

The key point is that these dynamics are already present in the system, but their magnitude, coupling strength, and long-term impacts vary by region, infrastructure mix, and timeframe. Reducing risk ultimately depends on rapidly reducing greenhouse gas emissions, particularly from fossil fuel combustion, while simultaneously adapting energy infrastructure to increasing heat and demand extremes.

bookmark_borderLabor Force Participation Declines Mask Modest Job Growth in Latest BLS Report

Labor Exit Distorts Picture of Employment Gains

The U.S. labor force participation rate now stands at 61.5%, according to the latest Bureau of Labor Statistics (BLS) June 2026 report. This metric measures the share of the civilian population aged 16 and older that is either employed or actively seeking work, and it declined from 61.8% in the prior reading.

Within the broader non-participating population, only a small segment is considered even loosely attached to the labor market. Approximately 1.76 million people are classified as “marginally attached” to the labor force—individuals who want a job and have looked for work within the past 12 months, but have not searched in the past four weeks. Of these, about 477,000 are “discouraged workers,” meaning they believe no jobs are available for them or that they lack the skills required to obtain employment.

The latest BLS June 2026 employment report highlights a notable shift in labor force dynamics. Roughly 720,000 people left the labor force, contributing to the decline in the participation rate from 61.8% to 61.5%.

This decline helps explain the apparent contradiction in the headline employment figures. The economy added a modest 57,000 jobs, and the official unemployment rate edged down from 4.3% to 4.2%. However, this improvement is partly driven by a smaller labor force rather than a surge in hiring, as fewer people were actively seeking work during the reporting period.

bookmark_borderRobinhood Earn (7% APY): How It Works and the Key Risks Investors Should Understand

How It Works

Robinhood Earn is a decentralized crypto lending product offering eligible U.S. users a reported 7% APY by lending out dollar-backed stablecoins, specifically USDG, through a self-custody wallet. The underlying lending infrastructure is powered by the decentralized finance (DeFi) protocol Morpho, and the product is marketed with additional protections including cyberattack and smart-contract exploit insurance arranged through Lloyd’s of London and RELM.

While the yield may appear attractive compared to traditional cash accounts, Robinhood Earn operates in a fundamentally different risk environment than insured banking products. Users should understand that this is not a bank deposit product and does not carry federal protections.


How Robinhood Earn Works

At a high level, Robinhood Earn functions as a decentralized lending market:

  • Users deposit USDG stablecoins into a self-custody wallet.
  • Those funds are supplied into lending pools via Morpho.
  • Borrowers take loans using crypto collateral.
  • Lenders earn interest generated from borrower demand, expressed as an APY (reported around 7%).

Unlike traditional savings accounts, returns are not guaranteed and fluctuate based on borrowing demand, protocol utilization, and market conditions.


Key Risks of Robinhood Earn

1. No FDIC or SIPC Protection

Funds used in Robinhood Earn are not covered by FDIC insurance (bank deposits) or SIPC protection (brokerage securities accounts).

If losses occur due to protocol failure, hacks, or market events, there is no government backstop to recover funds.


2. Bad Debt and Liquidation Risk

Loans in Morpho are backed by crypto collateral. If the value of that collateral falls too quickly during volatile markets, automated liquidations may fail to fully cover outstanding loans.

This can result in bad debt, which is typically absorbed proportionally by lenders—meaning partial losses of principal are possible.


3. Liquidity Constraints and Withdrawal Delays

In high-demand environments, the protocol can reach full utilization, meaning:

  • All deposited capital is actively lent out
  • New withdrawals may be delayed
  • Users must wait for borrowers to repay or new liquidity to enter the system

This introduces liquidity risk not present in traditional savings accounts.


4. Smart Contract and Protocol Risk

Because Robinhood Earn relies on decentralized smart contracts, it is exposed to risks such as:

  • Coding bugs or vulnerabilities
  • Governance failures
  • Exploits or hacks targeting the Morpho protocol or related infrastructure

In extreme cases, these risks could result in total loss of funds.


5. Stablecoin De-Pegging Risk

The yield is generated using USDG, a dollar-backed stablecoin intended to maintain a 1:1 peg with the U.S. dollar.

However, stablecoins can lose their peg due to:

  • Reserve mismanagement
  • Market panic or liquidity stress
  • Structural failures in backing assets

If de-pegging occurs, the value of holdings can decline even if interest continues to accrue.


6. Self-Custody Responsibility

Robinhood Earn requires use of a self-custody wallet, meaning users are fully responsible for securing their assets.

Risks include:

  • Loss of private keys or recovery phrases
  • Phishing attacks or social engineering scams
  • Signing malicious transactions

If any of these occur, fund recovery is not possible through Robinhood or any central authority.


Insurance Protections (and Their Limits)

Robinhood Earn includes cyberattack and smart-contract exploit coverage arranged through Lloyd’s of London and RELM. However, such insurance is typically:

  • Limited in scope
  • Subject to exclusions and conditions
  • Not equivalent to federal deposit insurance

Users should not assume full protection against all forms of loss.


Bottom Line

Robinhood Earn represents a hybrid between traditional finance and decentralized lending markets. While the reported 7% APY may be attractive, the product introduces a combination of market, liquidity, custody, and smart-contract risks that do not exist in standard bank accounts.

It is fundamentally a decentralized lending exposure, not a guaranteed savings product, and should be evaluated accordingly.

bookmark_borderJuly Fourth in Philadelphia: Extreme Heat Puts FIFA Players and Fans at Risk

Philadelphia is forecast to experience a critical heat emergency on July 4, with heat index values expected to reach 91–95°F under dangerously humid conditions. Even modest physical exertion outdoors can increase the risk of heat exhaustion, heat stroke, and, in severe cases, death.

Extreme heat is more than uncomfortable—it is one of the deadliest weather hazards. Beyond its immediate health risks, exposure to extreme heat accelerates biological aging by increasing cellular stress, damaging tissues, and contributing to telomere shortening.

What Is FIFA Doing?

Rather than postponing the Round of 16 match, FIFA plans to proceed while implementing heat mitigation measures for players and spectators.

Player Safety Measures

Mandatory Hydration Breaks: FIFA requires official cooling and hydration breaks during matches when heat conditions warrant them to reduce the risk of heat-related illness.

Sideline Cooling: Philadelphia Stadium (Lincoln Financial Field) has installed cooling benches along the sidelines, allowing substituted players and those receiving treatment to lower their body temperature more quickly.

Fan Safety Measures

Outside Water Restrictions: Despite the dangerous heat, FIFA has updated its stadium code of conduct to prohibit spectators from bringing outside or reusable plastic water bottles into the stadium for refilling. Fans must instead obtain drinking water through stadium concessions and designated distribution points.

Weather Monitoring: Organizers are coordinating with the National Weather Service because the combination of extreme heat and the potential for severe Fourth of July thunderstorms could require temporary suspensions of play or crowd sheltering if lightning is detected within FIFA’s safety perimeter.

Cooling Centers: The City of Philadelphia is operating additional medical stations and cooling areas throughout the stadium complex and at the FIFA Fan Festival at Lemon Hill to assist visitors experiencing heat stress.

Heat Is a Serious Public Health Hazard

Hydration, shade, and cooling breaks help reduce risk, but they cannot eliminate it. Anyone attending outdoor events should avoid unnecessary exertion, drink fluids before becoming thirsty, seek shade whenever possible, and recognize the warning signs of heat exhaustion and heat stroke.

Climate change is making extreme heat events more frequent, longer-lasting, and more humid. As temperatures continue to rise, organizers of major outdoor sporting events will increasingly face difficult decisions about balancing competition with public safety.

Regardless of the precautions taken, exposing athletes, officials, and tens of thousands of spectators to unnecessary risk during a critical heat emergency is difficult to justify. Hydration breaks and cooling stations can reduce risk, but they cannot eliminate it. When dangerous heat reaches levels known to threaten human health, the responsible course of action is to postpone play until conditions are safe. No sporting event is worth risking heat-related illness, permanent injury, or loss of life.

bookmark_borderNew Data Center Designs and the Evolving Environmental Footprint of AI Infrastructure

by Daniel Brouse

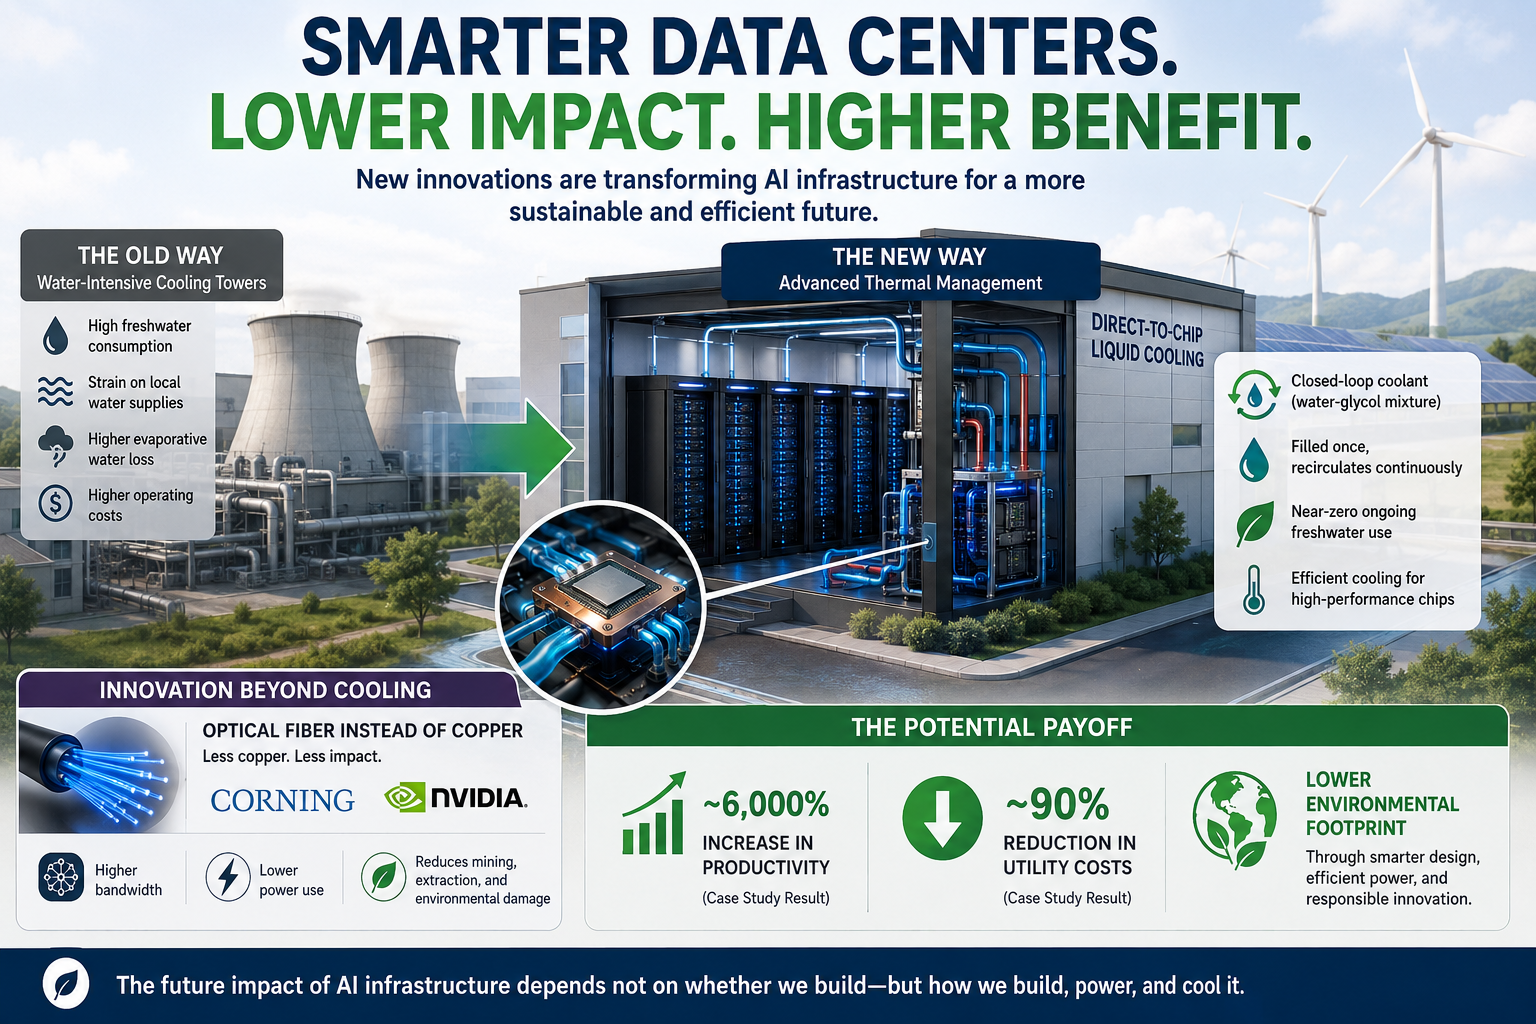
New data center designs are dramatically reducing—or in some cases eliminating—direct freshwater consumption by replacing traditional, water-intensive cooling towers with advanced thermal management technologies. Major technology companies and hardware manufacturers are rapidly deploying infrastructure designed to minimize strain on local water supplies while supporting rapidly growing computational demand.

One of the most significant developments is the adoption of modern direct-to-chip liquid cooling systems. These systems use a closed-loop coolant, typically a water-glycol mixture, which is filled once during installation and then continuously recirculated. Because the coolant is reused within a sealed system, these designs require little to no ongoing freshwater input while still efficiently removing heat from high-performance processors.

As these technologies become more widespread, it is important to recognize that blanket opposition to AI or new data centers may unintentionally slow the deployment of infrastructure that is substantially more water- and energy-efficient than earlier generations. The environmental impact of data centers depends less on their existence and more on how they are designed, powered, and cooled.

Beyond cooling systems, there are additional innovations shaping the next generation of AI infrastructure that are often overlooked. One example is the gradual replacement of copper interconnects with optical fiber. Companies such as Corning are partnering with Nvidia to introduce advanced optical networking within AI data centers. This transition significantly reduces reliance on copper, which has downstream implications for mining, extraction, and other environmentally intensive industrial processes. In turn, this shift has the potential to lower the broader ecological footprint associated with large-scale computing infrastructure.

The reason I’m outspoken on this issue is that the potential benefits of AI and modern data centers can far outweigh their costs when they’re deployed responsibly. In my work as an economist and climate scientist, I have documented a case study indicating approximately a 6,000% increase in productivity alongside a reduction of roughly 90% in utility costs under modernized systems and workflows.

That doesn’t mean every AI deployment is beneficial or that environmental concerns should be ignored. It does mean we should evaluate these technologies based on current evidence and engineering advances, rather than broad, generalized claims that treat all AI and all data centers as inherently harmful.

Addendum: A Case Study in AI Efficiency

As an economist and climate scientist, I’ve been experimenting with different AI graphic generators to evaluate them from both a marketing and an economic perspective. My objective is simple: maximize impact while minimizing cost and environmental footprint.

Rather than focusing solely on image quality, I compare the complete cost-benefit equation, including environmental resource use, computational efficiency, human labor, production time, and audience response. My goal is to identify which tools produce the greatest overall value.

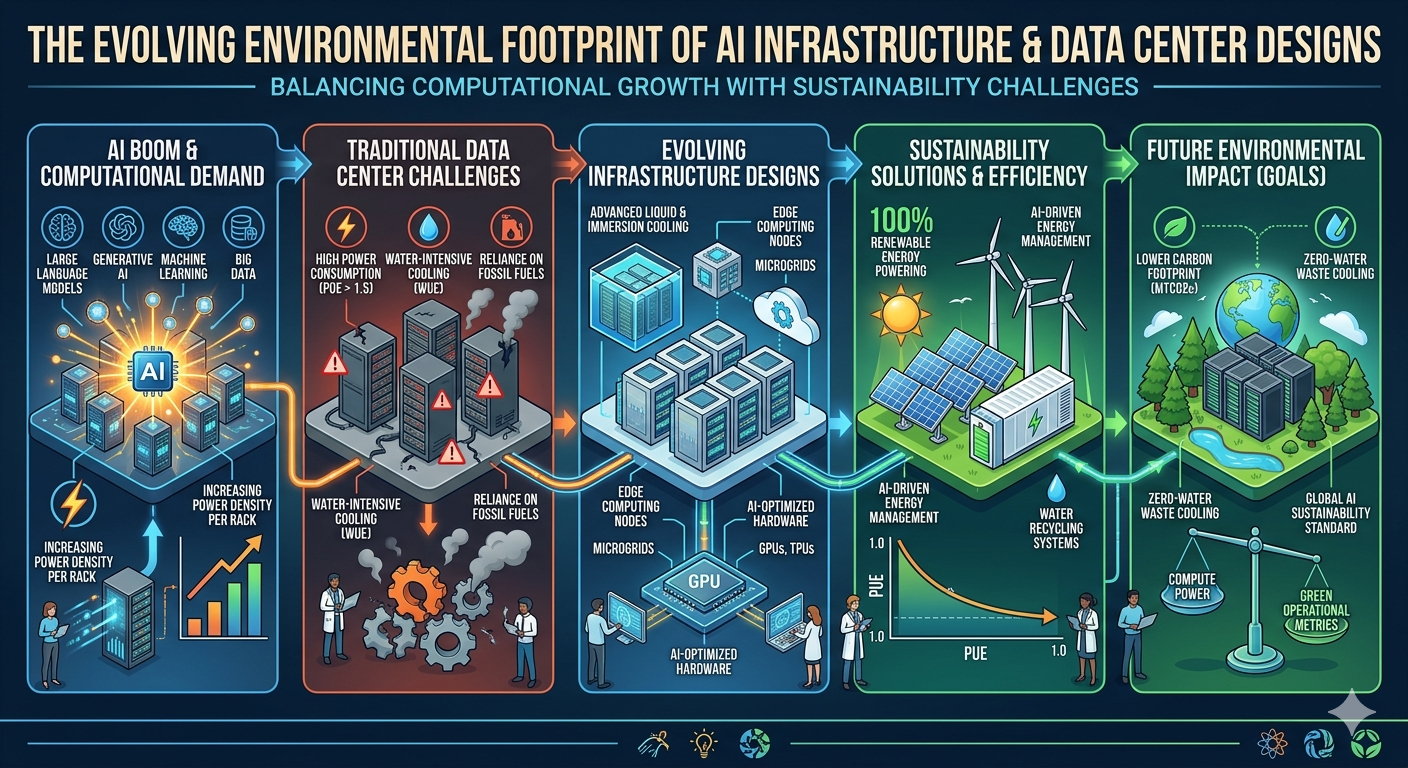
My current comparison has focused primarily on ChatGPT and Google’s Nano Banana image generator. Thus far, ChatGPT has proven to be slightly more computationally expensive but often produces graphics with greater visual impact. Nano Banana, on the other hand, tends to generate a cleaner, more formal aesthetic that may resonate better with certain audiences. Both systems have strengths, and each may be the better choice depending on the intended purpose.

What surprised me most was not how difficult it was to generate the images, but how easy it became once the underlying work had been completed. The challenging part was researching the subject, writing the paper, and translating complex scientific concepts into a clear set of instructions for the AI. Once those instructions existed, both systems produced high-quality graphics in well under a minute.

The two graphics accompanying this article illustrate the point. They were created from essentially the same prompt using two different AI systems. The Google version is estimated to have required roughly 25% fewer tokens, making it somewhat more computationally efficient, while the ChatGPT version produced a result I judged to have slightly greater marketing impact.

From an economic standpoint, the comparison is striking. Producing comparable illustrations through traditional methods could easily require hundreds of dollars in labor, software, revisions, and project management, along with the associated energy and material costs of conventional production. By contrast, the AI-generated graphics required only minutes to produce and incurred essentially no direct production cost beyond access to the AI platforms.

Although precise energy, water, and material consumption varies by hardware, data center design, and electricity source, my estimates suggest that using AI tools for this project reduced total resource consumption by well over 99% compared with creating equivalent graphics entirely through traditional manual workflows. In my own workflow, the estimated natural-resource cost was only a few cents per image.

This experience reinforces an important economic principle: productivity gains are often accompanied by reductions in resource intensity. When modern AI infrastructure is designed efficiently, it has the potential to reduce not only labor costs but also energy consumption, material use, water consumption, and overall environmental impact. Like any technology, AI should be evaluated based on measurable outcomes rather than assumptions. As the underlying infrastructure continues to improve, the environmental efficiency of these systems is likely to improve as well.

But, But, But… What About All the Other Costs and Environmental Impacts?

I understand your concerns—they’re important goals that I share. That’s why I’ve written this article explaining why I believe the benefits of modern AI infrastructure can outweigh the costs when it’s designed responsibly.

Ironically, many of the newest data center technologies can help advance the very objectives often listed. They’re becoming far more water-efficient through closed-loop cooling, more energy-efficient through advanced hardware and optical networking, and can reduce material demand by replacing large amounts of copper with fiber. AI is also accelerating the design of better batteries, more efficient renewable energy systems, smarter electrical grids, and improved land-use planning—all of which can help reduce environmental impacts over time.

From an economic perspective, I’ve found AI to be extraordinarily productive. One of our economic models projects that AI-driven automation could reduce the demand for human labor by as much as 90% over the next decade. Whether that estimate proves accurate or not, the broader trend points toward substantial productivity gains.

To me, that means the bigger societal question isn’t simply whether to build AI infrastructure. It’s how we prepare for an economy where productivity increasingly comes from intelligent systems. Issues like universal basic income, negative income taxes, wage subsidies, or other forms of national or global income support may become some of the most important policy discussions of the coming decades.

Technology itself isn’t inherently good or bad. The challenge is ensuring we deploy it in ways that improve both human well-being and environmental sustainability.

bookmark_borderClimate Responsibility and Accountability

Addendum to:

Solutions to the Fossil Fuel Economy and the Myths Accelerating Climate and Economic Collapse

http://membrane.com/global_warming/Basic-Economics.html

Climate Responsibility and Accountability

Introduction

The original purpose of Solutions to the Fossil Fuel Economy and the Myths Accelerating Climate and Economic Collapse was to focus on practical solutions rather than assigning blame. Since its publication, however, many readers have interpreted that emphasis as minimizing the responsibility of fossil fuel companies. This addendum clarifies that both interpretations can be true simultaneously.

I began my career as an economist specializing in risk management before turning my attention to humanity’s largest systemic risk—climate change. My work spans economics, systems science, statistics, and climate physics. Together with physicist Sidd Mukherjee, I co-originated the Nonlinear Acceleration Hypothesis, a framework describing how interacting physical, ecological, health, and socioeconomic feedbacks can accelerate climate impacts beyond traditional linear projections.

My work has consistently argued that climate change is both a physical and an economic problem. It cannot be understood through atmospheric science alone, nor through economics alone. Rather, it emerges from the interaction of nonlinear Earth-system processes and human decision-making.

Shared Responsibility Does Not Eliminate Corporate Accountability

Fossil fuel consumption is fundamentally a supply-and-demand system. Producers cannot exist without consumers, and consumers cannot purchase what is not supplied. Responsibility therefore exists on multiple levels.

Recognizing consumer responsibility does not absolve fossil fuel companies of their own responsibilities.

Oil and gas companies have exercised enormous influence through lobbying, political advocacy, public relations campaigns, strategic communications, and efforts to delay or weaken climate policy. Those actions deserve careful scrutiny and, where appropriate, legal accountability.

At the same time, it is equally inaccurate to argue that consumers possess no agency whatsoever. While choices are often constrained by infrastructure, income, geography, and available technology, millions of individuals, businesses, and governments have successfully reduced fossil fuel dependence through efficiency improvements, electrification, renewable energy adoption, and changes in consumption patterns.

The issue is therefore not one of assigning exclusive blame to either producers or consumers. Climate change is the product of interacting economic incentives, political institutions, technological development, consumer behavior, and physical climate feedbacks.

Understanding that complexity is essential if society intends to solve the problem rather than merely redistribute blame.

Corporate Accountability

My work has also extensively examined legal and economic mechanisms for holding fossil fuel companies accountable, including:

  • climate litigation,
  • consumer protection law,
  • human rights frameworks,
  • carbon pricing and taxation,
  • restitution,
  • treble-damage recovery, and
  • broader climate liability frameworks.

Those topics are discussed in detail throughout the following papers, which complement the original economics article rather than contradict it.

The Fossil Fuel Industry

Oil and gas companies unquestionably bear significant responsibility for the climate crisis. Decades of internal research, lobbying, public relations campaigns, political influence, and efforts to delay emissions reductions have been extensively documented. Protecting market share and shareholder value frequently took precedence over communicating known climate risks or accelerating the transition to lower-carbon energy sources.

Those actions deserve public scrutiny and, where appropriate, legal accountability.

However, acknowledging corporate misconduct does not eliminate the role of consumer demand. Energy markets function through supply and demand. Producers extract, refine, and distribute fossil fuels because governments, businesses, and consumers continue to purchase them across transportation, electricity generation, manufacturing, agriculture, aviation, shipping, and residential heating.

This is not a moral judgment; it is an economic reality.

Consumers often operate within real constraints. Infrastructure, housing, public transportation, income, local utility policies, and technology availability all influence individual choices. Some households possess far greater flexibility than others. Nevertheless, constrained choice is not the same as no choice. Millions of households and businesses have reduced fossil fuel consumption through energy efficiency, electrification, renewable energy, improved building design, vehicle selection, and changes in consumption patterns. Each reduction weakens demand at the margin.

Likewise, governments influence both supply and demand through regulation, taxation, subsidies, infrastructure investments, and public procurement. Climate policy therefore operates across every level of society rather than through a single actor.

The climate crisis emerged from interacting physical, economic, technological, and political systems. Effective solutions require addressing each component simultaneously.

Existing Work on Corporate Accountability

Contrary to claims that emphasizing consumer responsibility somehow absolves fossil fuel producers, much of my work focuses specifically on legal and economic accountability for corporate misconduct.

The following papers examine those issues in detail.

Climate Change and Accountability

Climate Change and Accountability: Legal Challenges, Consumer Rights, and Human Rights in the Fight Against Fossil Fuels

http://membrane.com/global_warming/Climate-Change-and-Cigarette-Litigation.html

This paper examines the legal foundations for climate litigation, including consumer fraud, public nuisance, deceptive marketing, human rights claims, restitution, and the application of legal principles similar to those successfully employed against the tobacco industry.

The Economics of Climate Change

Climate change is fundamentally different from most economic shocks.

Traditional recessions eventually recover. Financial crises stabilize. Commodity shortages resolve. Climate change does not naturally return to equilibrium within human timescales because excess greenhouse gases and accumulated ocean heat continue influencing the climate system for decades to centuries.

As University of Cape Town researcher Christopher Trisos observed:

“For people, other species, ecosystems, and the world we live in, we’ve entered the Age of Loss and Damage, but we’re just at the start.”

Likewise, following the record-breaking Northern Hemisphere summer of 2023, United Nations Secretary-General António Guterres warned:

“Climate breakdown has begun.”

These statements reflect a growing recognition that climate damages are no longer primarily future risks—they have become ongoing economic realities.

The Age of Loss and Damage

Climate economics must therefore evolve beyond traditional Integrated Assessment Models (IAMs), many of which assume smooth, gradual damage functions that underestimate systemic risk.

My work argues that climate damages arise from interacting nonlinear feedbacks operating simultaneously across physical, ecological, health, financial, insurance, agricultural, infrastructure, and geopolitical systems.

Understanding those interactions requires integrating:

  • economics,
  • systems science,
  • statistics,
  • atmospheric physics,
  • ecology,
  • public health, and
  • risk management.

The resulting framework is consistent with the Nonlinear Acceleration Hypothesis, which recognizes that climate impacts increasingly reinforce one another through cascading feedback loops rather than simple linear cause-and-effect relationships.

Accounting for Climate Damages

One objective of climate economics is not merely estimating annual losses, but accounting for the full societal burden imposed by delayed mitigation and continued emissions.

Quantifying the Climate Tax

Quantifying the Climate Tax: The Full Ledger of Harm

http://membrane.com/global_warming/Climate-Tax-Full-Ledger-of-Harm.html

This paper estimates the annual economic burden currently imposed by climate change on American households.

The analysis concludes that the direct annual climate burden already approaches $6,000 per person, while the broader long-term burden—including infrastructure degradation, ecosystem loss, health impacts, insurance instability, productivity losses, and deferred damages imposed on future generations—is substantially larger.

Climate change is therefore functioning as an invisible tax already embedded throughout the economy.

The Legal Foundation for Treble Damages

American law has long recognized that ordinary compensation is insufficient when misconduct is deliberate, deceptive, or socially destructive.

Treble damages appear throughout U.S. law, including:

  • Sherman Act antitrust litigation,
  • RICO actions,
  • False Claims Act enforcement, and
  • numerous state consumer protection statutes.

Their purpose extends beyond compensation. They deter future misconduct while recognizing that direct damages frequently underestimate total societal harm.

A comparable framework may be appropriate when evaluating climate-related damages if plaintiffs establish that institutions knowingly delayed mitigation while externalizing foreseeable risks onto the public.

Justice, Restitution, and Climate Liability

Applying a justice framework to climate economics raises three related questions:

  1. Did organizations knowingly externalize foreseeable climate damages?
  2. Have those damages fallen disproportionately upon vulnerable populations and future generations?
  3. Should legal remedies reflect deterrence as well as compensation?

These questions extend beyond economics into ethics, law, and public policy, but they are increasingly becoming central to climate litigation worldwide.

The Cost of Inaction

The companion paper,

The Full Economic Burden: An Ensemble-Based Probabilistic Framework

http://membrane.com/global_warming/Climate-Change-Burden-Ensemble-Based.html

develops an ensemble-based probabilistic framework for estimating the long-term economic consequences of accelerating climate change.

Under the median ensemble projection, annual U.S. climate-related economic losses increase nearly tenfold, rising from approximately $2.1 trillion in 2025 to $19.5 trillion by 2050 (constant 2025 dollars).

Rather than projecting a steady increase in damages, the analysis demonstrates how interacting physical, ecological, health, financial, and socioeconomic feedbacks can transform climate change into an accelerating systemic economic burden.

Under the median ensemble scenario, cumulative U.S. climate-related losses between 2025 and 2050 approach $200 trillion (constant 2025 dollars).

These projections illustrate a central conclusion of the Nonlinear Acceleration Hypothesis: delayed responses, thermal inertia, interacting feedbacks, and tipping cascades can produce economic impacts that grow substantially faster than traditional linear or quadratic damage models anticipate.

Conclusion

Climate responsibility should never be framed as an either-or proposition.

Corporations that knowingly delayed climate action should be held accountable through transparent governance, appropriate regulation, and where justified, legal remedies.

Governments bear responsibility for designing policies that correctly price externalities, accelerate innovation, and remove barriers to decarbonization.

Businesses bear responsibility for reducing emissions throughout their operations and supply chains.

Consumers also retain agency through the choices they make within the constraints they face.

Climate change emerged from the interaction of all of these systems. Lasting solutions will require accountability and action across all of them.


bookmark_borderThe Evolution of Climate Change: From Linear Warming to Nonlinear Earth-System Acceleration

By Daniel Brouse and Sidd Mukherjee

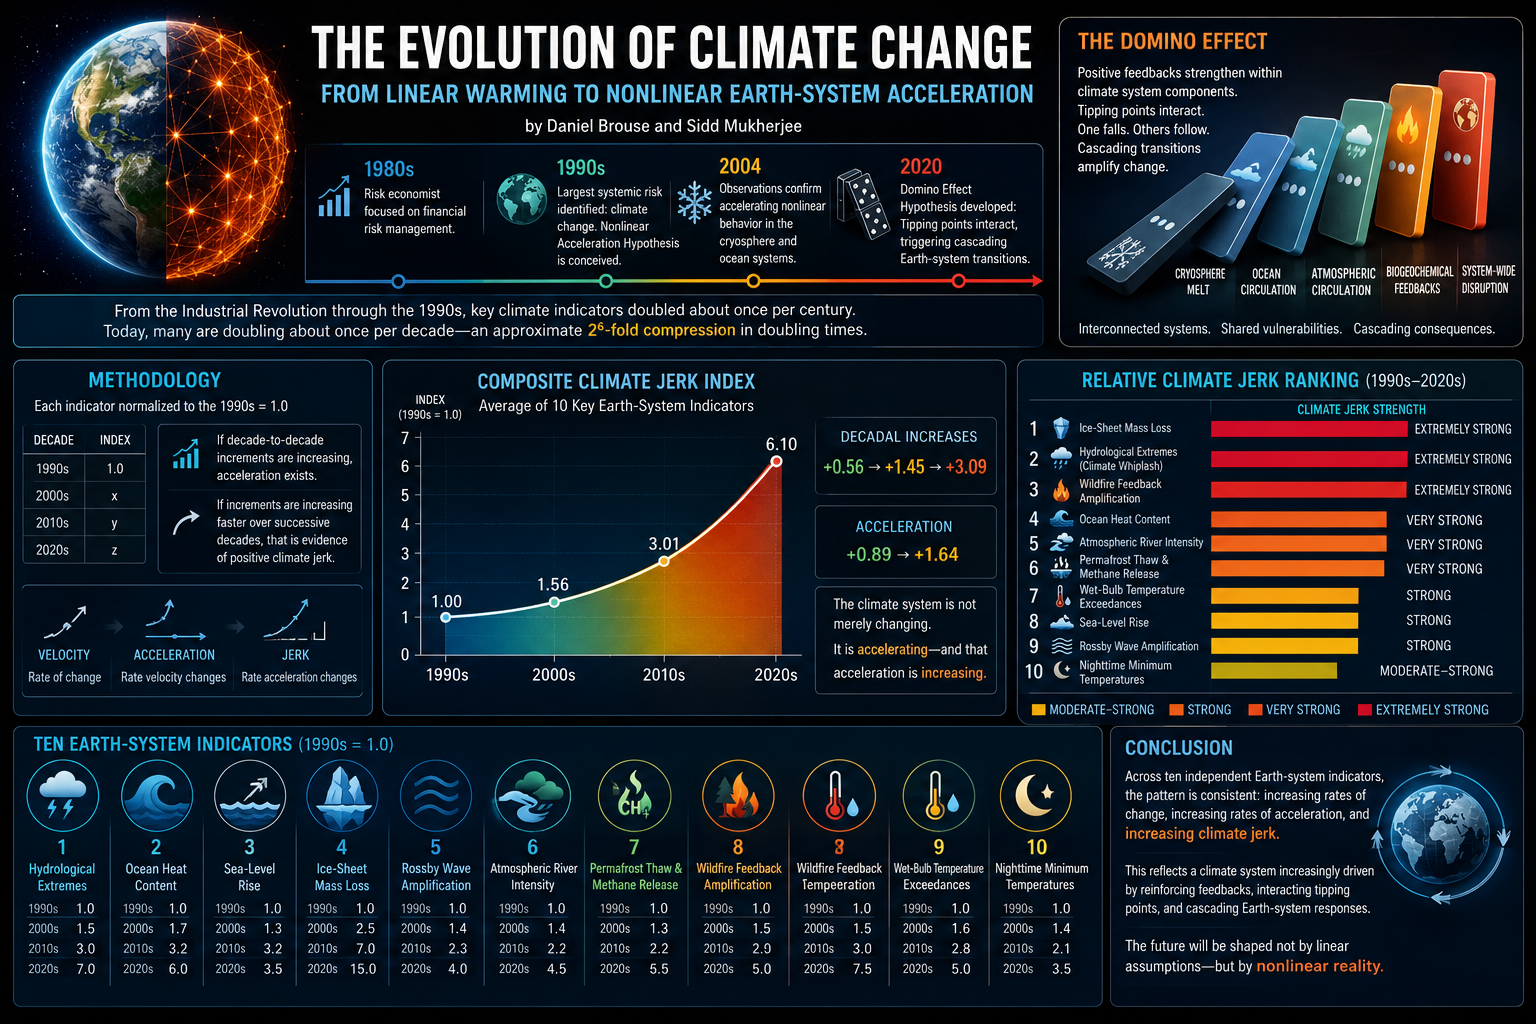
During the 1980s, I worked primarily as an economist specializing in risk management. By the early 1990s, however, it had become clear that the greatest systemic risk facing civilization was not financial—it was climate change.

Working with physicist Sidd Mukherjee, we began developing what we called the Nonlinear Acceleration Hypothesis: the idea that climate change would not progress as a slow, linear process, but instead would accelerate as reinforcing Earth-system feedbacks became increasingly dominant.

Over the past three decades, an expanding body of observational evidence has increasingly supported this perspective. Today, nonlinear climate dynamics, positive feedbacks, tipping points, and cascading Earth-system interactions have become central concepts within modern climate science and climate-risk research.

From Linear Assumptions to Nonlinear Reality

By 1995, I had become convinced that many climate indicators were evolving exponentially rather than linearly. Sidd agreed the hypothesis was plausible but argued that a much longer observational record would be necessary before drawing firm conclusions.

At the time, most climate projections implicitly assumed relatively gradual warming. While serious, climate change was generally viewed as unfolding over centuries, leaving substantial time for adaptation and mitigation.

Yet observational evidence already suggested something different. Looking beyond annual variability, many climate indicators appeared to be accelerating.

By 2004, sufficient observations had accumulated to demonstrate nonlinear behavior across multiple components of the Earth system. Greenland Ice Sheet dynamics, in particular, were no longer consistent with simple equilibrium assumptions. Ocean heat uptake, ice-sheet mass loss, atmospheric moisture, and extreme precipitation all exhibited increasing rates of change.

A striking pattern emerged.

From the Industrial Revolution through approximately the 1990s, many leading indicators of climate change appeared to double on timescales approaching one century.

Today, many of those same indicators are doubling on timescales measured in roughly one decade.

This represents an approximate 2⁶-fold compression of doubling times over successive decades—a remarkable acceleration in the pace of climate change.

Rather than simply warming faster, the Earth system appears to be evolving into an increasingly nonlinear state in which the rate of change itself continues to accelerate.

If sustained, this may represent one of the most abrupt large-scale climate transitions in Earth’s geological history.

The Domino Effect

By 2020, our work expanded into what we termed the Domino Effect Hypothesis.

Many components of the climate system contain internal positive feedback mechanisms. As these feedbacks strengthen, the climate system becomes progressively less dependent upon external forcing because it increasingly reinforces its own evolution.

These critical threshold transitions are commonly known as climate tipping points.

Unlike gradual warming, tipping points exhibit nonlinear behavior in which relatively small additional forcing can produce disproportionately large—and potentially irreversible—changes.

Even more importantly, tipping points rarely occur in isolation.

The atmosphere, oceans, cryosphere, biosphere, and carbon cycle are tightly interconnected. Destabilization within one subsystem can reduce the stability of others, producing a sequence of interacting transitions throughout the Earth system.

This cascading behavior—often referred to as tipping cascades—forms the basis of the Domino Effect.

Since its proposal, extensive observational evidence has demonstrated that interacting climate feedbacks are a defining feature of modern climate dynamics and now occupy a central position within contemporary climate-risk literature.

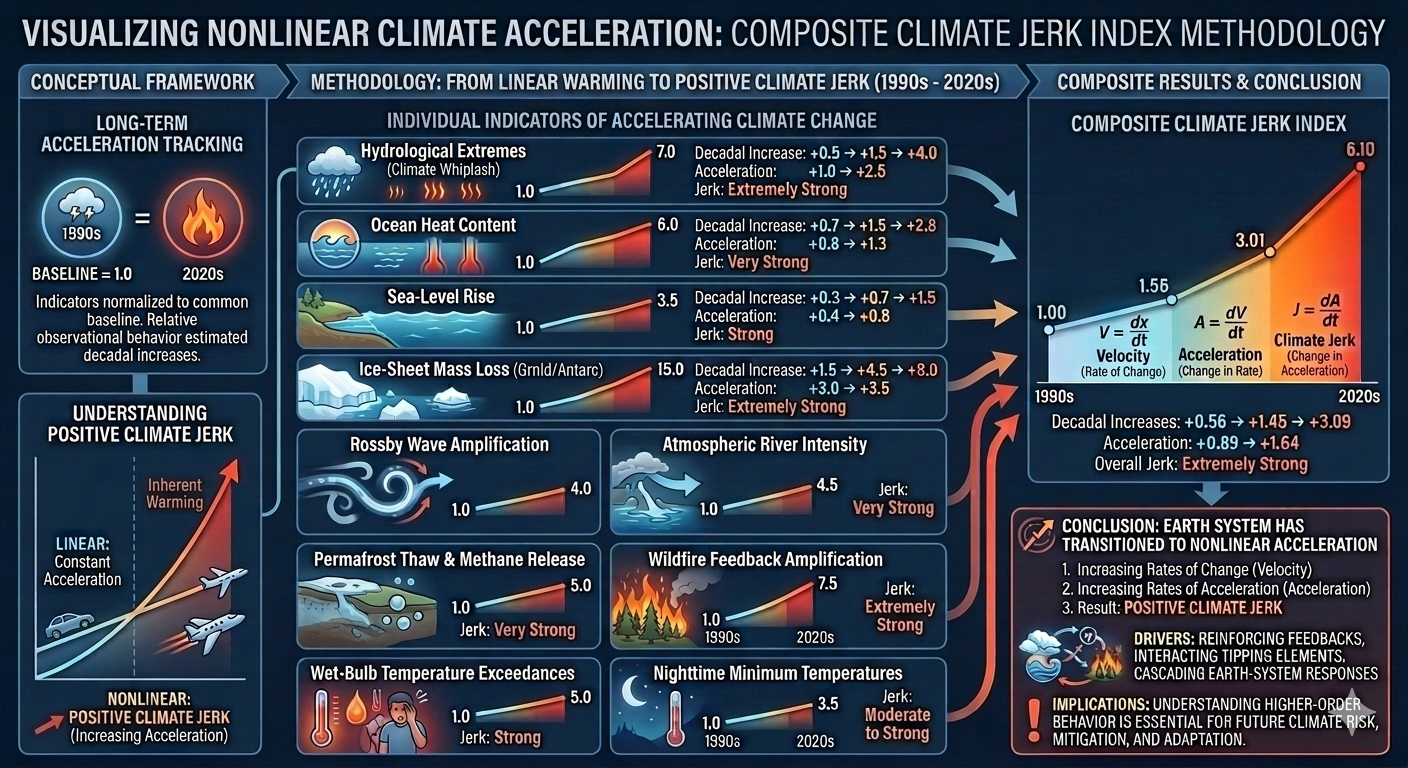
Methodology

To illustrate long-term changes in climate acceleration, each indicator was normalized to a common baseline:

1990s = 1.0

Relative observational behavior was then estimated for each subsequent decade.

If the decade-to-decade increases become progressively larger, the indicator exhibits positive acceleration.

If the acceleration itself continues increasing over time, this represents positive climate jerk—the rate at which acceleration is increasing.

In physics:

  • Velocity describes the rate of change.
  • Acceleration describes the rate at which velocity changes.
  • Jerk describes the rate at which acceleration changes.

Applied to climate science, positive climate jerk indicates that Earth’s climate is not simply changing faster—it is accelerating faster over time.


1. Hydrological Extremes and Climate Whiplash

DecadeIndex
1990s1.0
2000s1.5
2010s3.0
2020s7.0

Decadal increase: +0.5 → +1.5 → +4.0

Acceleration: +1.0 → +2.5

Climate Jerk: Extremely Strong


2. Ocean Heat Content

DecadeIndex
1990s1.0
2000s1.7
2010s3.2
2020s6.0

Decadal increase: +0.7 → +1.5 → +2.8

Acceleration: +0.8 → +1.3

Climate Jerk: Very Strong


3. Sea-Level Rise

DecadeIndex
1990s1.0
2000s1.3
2010s2.0
2020s3.5

Decadal increase: +0.3 → +0.7 → +1.5

Acceleration: +0.4 → +0.8

Climate Jerk: Strong


4. Ice-Sheet Mass Loss

(Greenland and Antarctica Combined)

DecadeIndex
1990s1.0
2000s2.5
2010s7.0
2020s15.0

Decadal increase: +1.5 → +4.5 → +8.0

Acceleration: +3.0 → +3.5

Climate Jerk: Extremely Strong


5. Rossby Wave Amplification

DecadeIndex
1990s1.0
2000s1.4
2010s2.3
2020s4.0

Climate Jerk: Strong


6. Atmospheric River Intensity

DecadeIndex
1990s1.0
2000s1.3
2010s2.2
2020s4.5

Climate Jerk: Very Strong


7. Permafrost Thaw and Methane Release

DecadeIndex
1990s1.0
2000s1.4
2010s2.5
2020s5.0

Climate Jerk: Very Strong


8. Wildfire Feedback Amplification

DecadeIndex
1990s1.0
2000s1.5
2010s3.0
2020s7.5

Climate Jerk: Extremely Strong


9. Wet-Bulb Temperature Exceedances

DecadeIndex
1990s1.0
2000s1.6
2010s2.8
2020s5.0

Climate Jerk: Strong


10. Nighttime Minimum Temperatures

DecadeIndex
1990s1.0
2000s1.4
2010s2.1
2020s3.5

Climate Jerk: Moderate to Strong


Composite Climate Jerk Index

A simple average of the ten normalized indicators produces the following composite behavior:

DecadeComposite Index
1990s1.00
2000s1.56
2010s3.01
2020s6.10

Decadal increases

+0.56 → +1.45 → +3.09

Acceleration

+0.89 → +1.64

Conclusion

Viewed collectively, these observational indicators suggest that the Earth’s climate system has undergone a profound transition since the late twentieth century. The evidence indicates not only increasing rates of change, but increasing rates of acceleration—a phenomenon that may be described as positive climate jerk.

This behavior is consistent with a climate system increasingly influenced by reinforcing feedbacks, interacting tipping elements, and cascading Earth-system responses.

Whether evaluated through ice-sheet dynamics, ocean heat uptake, hydrological extremes, atmospheric circulation, wildfire amplification, or permafrost thaw, the emerging pattern is remarkably consistent: the climate system is not merely changing—it is accelerating, and that acceleration itself continues to increase.

Understanding this higher-order behavior may prove essential for accurately assessing future climate risk and for developing mitigation and adaptation strategies that account for the nonlinear dynamics of the Earth system.

bookmark_borderClimate Tipping Points and Cascading Feedbacks

Climate Tipping Points and Cascading Feedbacks: Assessing the Current State of Earth’s Critical Climate Systems (2026 Review)

Daniel Brouse and Sidd Mukherjee

June 2026


Abstract

Climate change is no longer characterized solely by gradual increases in global temperature. A growing body of observational evidence demonstrates that multiple components of the Earth system are approaching—or in several cases have entered—states of self-reinforcing change driven by positive climate feedbacks. These nonlinear transitions, known as climate tipping points, increase the likelihood that future warming will proceed more rapidly than would be expected from anthropogenic greenhouse gas emissions alone.

This review synthesizes observational evidence through 2026 regarding the status of the Earth’s principal climate tipping elements, including the Greenland and West Antarctic Ice Sheets, the Atlantic Meridional Overturning Circulation (AMOC), Arctic permafrost, coral reefs, mountain glaciers, boreal forests, and the Amazon rainforest. Rather than functioning independently, these systems interact through atmospheric, oceanic, cryospheric, and carbon-cycle feedbacks that may produce cascading or “domino” effects across the Earth system.

Recent observations—including record ocean heat content, accelerating sea-level rise, unprecedented marine heatwaves, widespread coral bleaching, Arctic amplification, increasing atmospheric moisture, and rapid changes in hydrologic extremes—indicate that Earth is entering a period in which nonlinear feedbacks are becoming increasingly important drivers of climate evolution. Although considerable uncertainty remains regarding the precise thresholds and timing of individual tipping elements, evidence suggests that the probability of interacting tipping cascades increases substantially as global warming approaches and exceeds 1.5–2.0°C above pre-industrial temperatures.


1. Introduction

For decades climate change was commonly portrayed as a gradual, approximately linear response to increasing greenhouse gas concentrations. While this approximation remains useful for estimating long-term average warming, it does not fully describe how complex Earth systems behave near critical thresholds.

Many components of the climate system contain internal positive feedback mechanisms. Once these mechanisms become sufficiently strong, additional external forcing becomes progressively less important as the system begins reinforcing its own evolution.

These threshold transitions are known as climate tipping points.

Unlike gradual climate change, tipping points involve nonlinear behavior in which relatively small additional changes in forcing can trigger disproportionately large and potentially long-lasting responses.

Perhaps more importantly, tipping points do not occur in isolation. They interact through atmospheric circulation, ocean circulation, carbon cycling, and cryospheric processes. The destabilization of one system can reduce the stability of another, producing cascading transitions across the Earth system—a phenomenon often referred to as tipping cascades or the Domino Effect.


2. Climate Feedbacks: The Engine of Acceleration

Every climate tipping point is driven by positive feedback loops.

Examples include:

  • Ice-albedo feedback
  • Water-vapor amplification
  • Permafrost carbon release
  • Forest-fire carbon emissions
  • Vegetation dieback
  • Ocean heat uptake
  • Cloud feedbacks

Positive feedbacks increase warming.

Negative feedbacks partially offset warming.

As temperatures rise, positive feedbacks become increasingly dominant within several major Earth systems.

The practical consequence is acceleration.

Instead of climate change progressing at a nearly constant rate, the rate of change itself increases over time.


3. Current Status of Major Climate Tipping Elements

Warm-Water Coral Reefs

Current evidence indicates that tropical coral reefs have become the first major global ecosystem to exhibit widespread tipping behavior.

Mass bleaching events have occurred repeatedly since 2016 and culminated in an unprecedented global bleaching episode during 2023–2025.

Although individual reefs may recover, many reef systems have shifted toward persistent ecological degradation.

Current assessment: Actively tipping


Mountain Glaciers

Mountain glaciers are retreating in nearly every mountain range worldwide.

Many glaciers have already lost sufficient mass that complete disappearance has become unavoidable regardless of future emissions reductions.

Consequences include:

  • declining freshwater supplies
  • increased hazards from glacial lakes
  • long-term contributions to sea-level rise

Current assessment: Long-term loss committed in many regions


Greenland Ice Sheet

The Greenland Ice Sheet continues to lose mass at an accelerating rate.

Surface melting, increased rainfall, darker ice surfaces, and elevation feedbacks are reinforcing one another.

Current evidence suggests that portions of Greenland may already be committed to long-term ice loss under present warming levels, although complete deglaciation would require centuries to millennia.

Current assessment: Actively destabilizing


West Antarctic Ice Sheet

Marine ice-sheet instability is progressing in several sectors of West Antarctica, particularly near Thwaites and Pine Island glaciers.

Ocean warming beneath floating ice shelves continues to reduce buttressing, increasing ice discharge into the Southern Ocean.

Although complete collapse remains uncertain in timing, several marine basins now appear vulnerable to irreversible retreat.

Current assessment: High confidence of ongoing destabilization


Arctic Permafrost

Abrupt thaw, thermokarst formation, methane emissions, and increasing wildfire activity are altering large portions of Arctic permafrost.

These changes reduce one of Earth’s largest terrestrial carbon reservoirs while increasing greenhouse gas emissions.

Current assessment: High risk


Atlantic Meridional Overturning Circulation (AMOC)

The AMOC has weakened substantially over the past century.

Freshwater from Greenland melt, increased precipitation, and Arctic warming continue to reduce North Atlantic surface-water density.

While the timing of any future collapse remains uncertain, observations indicate that resilience has declined.

Current assessment: Weakening with elevated tipping risk


Amazon Rainforest

The Amazon faces simultaneous stress from warming, drought, wildfire, and deforestation.

Southern portions of the basin have already shifted from net carbon sink toward seasonal carbon source.

Large-scale forest dieback would reduce rainfall recycling and amplify regional drying.

Current assessment: Fragmenting under combined climate and land-use pressures


Boreal Forests

Increasing wildfire activity, insect outbreaks, and drought are transforming boreal ecosystems across Canada, Alaska, and Siberia.

These forests are migrating northward while losing biomass across their southern margins.

Current assessment: Increasing ecological stress


4. Interacting Climate Cascades

The greatest concern is not any single tipping point.

It is their interaction.

The Greenland Ice Sheet provides a clear example.

Accelerated melting introduces freshwater into the North Atlantic → Freshwater weakens deep-water formation → AMOC slows → Ocean heat redistributes toward the Southern Hemisphere → Additional heat reaches West Antarctica → Ice-sheet instability increases → Sea-level rise accelerates

Meanwhile:

AMOC weakening alters atmospheric circulation → South American rainfall decreases → Amazon drought intensifies → Forest dieback increases → Carbon emissions rise → Global warming accelerates

This sequence illustrates how apparently separate climate systems become mechanically coupled.

5. Emerging Indicators of Nonlinear Climate Change (2025–2026)

Several observational indicators suggest acceleration is occurring across multiple components of the climate system.

Among the strongest indicators are:

  • Record global ocean heat content
  • Increasing Earth energy imbalance
  • Accelerating marine heatwaves
  • Increasing atmospheric moisture
  • Stronger atmospheric rivers
  • More persistent Rossby-wave blocking
  • Arctic amplification
  • Accelerating sea-level rise
  • Longer wildfire seasons
  • More rapid permafrost thaw
  • Increasing nighttime temperatures
  • Greater frequency of compound drought–flood events

Individually these indicators do not prove tipping cascades.

Collectively they demonstrate increasing instability throughout the climate system.


6. The Domino Effect

Climate tipping points should not be viewed as isolated thresholds.

They function as an interconnected network.

Positive feedbacks reinforce warming.

Warming destabilizes tipping elements.

Destabilized tipping elements activate additional feedbacks.

Those additional feedbacks increase warming further.

The process repeats.

This cascading behavior compresses climate timescales.

Processes once expected over centuries may increasingly unfold over decades in vulnerable regions.

Although considerable uncertainty remains regarding the exact timing of future transitions, the probability of interacting tipping cascades increases as warming continues.

The Domino Effect: An example of an interacting Earth-system cascade

Polar amplification → reduced equator-to-pole temperature gradient → weakened thermal contrast that influences large-scale atmospheric circulation → accelerated Arctic and Greenland ice loss → increased freshwater discharge into the North Atlantic, reducing surface-water salinity and density → weakening of deep-water formation and increasing risk of Atlantic Meridional Overturning Circulation (AMOC) slowdown → reorganization of North Atlantic pressure patterns and storm tracks → greater jet-stream waviness, slower progression, and amplified Rossby-wave behavior → more persistent blocking patterns, omega blocks, and meridional flow → longer-lasting atmospheric rivers, heat domes, drought–flood whiplash, and other hydroclimatic extremes → increasing stress on agriculture, infrastructure, ecosystems, water resources, and public health → continued land-ice loss and groundwater redistribution that alter Earth’s mass distribution → climate-driven mass redistribution sufficient to measurably change Earth’s moment of inertia, contributing to small changes in Earth’s rotation and the length of day.


7. Scientific Uncertainty

Significant uncertainties remain.

Researchers continue to debate:

  • precise temperature thresholds
  • rates of future ice-sheet response
  • methane release from permafrost
  • resilience of tropical forests
  • future behavior of the AMOC
  • interactions among multiple tipping elements

These uncertainties should not be interpreted as evidence that tipping points are absent.

Rather, they reflect the complexity of coupled nonlinear Earth systems.

The direction of change is well established.

The exact timing remains uncertain.


8. Conclusions

Observations through 2026 indicate that Earth is entering a period in which nonlinear climate feedbacks are becoming increasingly important.

Several climate systems—including warm-water coral reefs, mountain glaciers, portions of the Greenland Ice Sheet, Arctic permafrost, and sectors of the West Antarctic Ice Sheet—are exhibiting sustained changes consistent with increasing instability.

Other systems, including the AMOC and Amazon rainforest, remain highly vulnerable as global temperatures continue to rise.

The principal scientific challenge is no longer identifying individual tipping points. It is understanding how they interact.

The emerging evidence suggests that the Earth’s major climate systems function less like isolated components than as an interconnected network linked by feedback loops, energy flows, and atmospheric and oceanic circulation.

Whether future climate change remains relatively manageable or evolves into a series of cascading transitions will depend largely on the magnitude and duration of future warming.

While some long-term changes may already be committed because of internal feedbacks, rapid reductions in greenhouse gas emissions can still substantially reduce the likelihood, speed, and severity of additional tipping cascades.

The coming decades will determine not only how much the planet warms, but whether multiple Earth-system tipping elements remain largely independent or become synchronized into a self-reinforcing global transition.