- Economic Forecast = Inflation (2018)
- Inflation Bites (2022)
- U.S. Mass Consumption Results in Global Economic Disparity, Inequity, and Poverty (2023)
- Investment Recommendation: Savings Bonds / I Bonds (2023)
- Your National Debt (2023)
- Economic Facts on Immigration, Budget Deficits and Inflation (2024)
- The Federal Reserve and the Chevron Decision (2024)
- Drill, Baby, Drill: The Existential Threat of Trump Economics (2024)
- The National Debt and the Printing of Money (2024)
Part I: Economic Forecast = Inflation
In 2006 and 2007, we forecast the impending “great recession”. Our investment advice was to sell all your real estate. If you could not sell it, leverage it to the hilt (so you had your cash out before failure.)
Turned out to be an accurate forecast.
In 2017 and 2018, we are forecasting inflation and rising interest rates. Buy real estate now and lock-in your 30-year interest rates ASAP. [WARNING: Do not buy real estate on or near floodplain. See disclaimer below.] [WARNING: This paper was first published in 2018. Since that time the forecast has reached fruition. It is too late to beat rising interest rates.]
WHY?
* Quantitative Easing and the Troubled Asset Relief Program (TARP) was started during the height of the 2008 financial crisis. In essence, it allowed the Treasury to print money.
* In 2017 Donald Trump started enacting policies that mirrored his personal finances — borrow too much money and don’t plan on paying it back. Mr. Trump has been involved in 6 bankruptcies.
* When the government borrows lots of money without a payback plan, they compete with the private sector to borrow money resulting in a rise in interest rates. This phenomena is known as crowding out (economics). (1)
* President Trump bragged about wage inflation during his State Of The Union (SOTU) address. When wages go up without an increase in productivity, the prices of goods and services inflate.(2)
* “Make America Great Again” policies make the American dollar weak. Tariffs and trade protectionism undermine the value of the dollar and contribute to inflation. (3)
* President Trump replaced the Chairwoman of the Federal Reserve with a new chair who is not an economist. A first in U.S. history.
* Tax cuts without spending cuts result in a budget deficit. The nation’s debt is now bigger than its gross domestic product. Net interest payments on the debt are estimated to total $276.2 billion this fiscal year, or 6.8% of all federal outlays. The tax cuts are expected to make this payment explode.
* The Federal Reserves primary weapon for fighting inflation is to raise interest rates. (4)
You could say inflation and rising interest rates are a two-headed monster. When the government creates money, it is “inflationary.” The government fights inflation by raising interest rates. Rising interest rates exponentially increase the national debt. When the government borrows, it competes with consumer borrowing causing interest rates to rise.
The name given to the worst-case scenario is hyper-inflation. We don’t expect hyperinflation in the US in the near future; however, higher interest rates in the US will result in hyperinflation in other parts of the world. (See Part III below.)
WARNING: Do not buy real estate on or near floodplain.
Do not invest in real estate that is located near floodplain. Make sure your property has land ingress and egress from the closest 1,000-year-floodplain. Do not invest in any property located near a coast. Do not invest in a property that is below sea level. Do not invest in real estate located in Florida.
“Mostly stay away from the coasts because of both wind and rain issues from weather systems spinning inland. Even if you are not in a floodplain, a couple feet of rain in a day will cut off roads and overwhelm your sump pumps. Not to speak of wind taking power and telecom down.” — Sidd Mukerhjee (February 5, 2018)
For more information on Flood Insurance please see “Who Pays For Flood Insurance?“
NOTES
(1) “In economics, crowding out is argued by some economists to be a phenomenon that occurs when increased government involvement in a sector of the market economy substantially affects the remainder of the market, either on the supply or demand side of the market.
One type frequently discussed is when expansionary fiscal policy reduces investment spending by the private sector. The Government is “crowding out” investment because it is demanding more Loanable Funds and it is increasing interest rates from the borrowing, but that was broadened to multiple channels that might leave total output little changed or smaller.” — Olivier Jean Blanchard (2008) “crowding out,” The New Palgrave Dictionary of Economics, 2nd Edition. Abstract and Roger W. Spencer & William P. Yohe, 1970. “The ‘Crowding Out’ of Private Expenditures by Fiscal Policy Actions,” Federal Reserve Bank of St. Louis Review, October, pp. 12-24
(2) “After years of wage stagnation, we are finally seeing rising wages,” Donald Trump (State of the Union 2018)
“The Employment Cost Index, a measure of salary and benefit costs, registered a 2.6 percent gain for the full year, tied for the best since 2007.” — CNBC (January 31, 2018)
(3) “Recently, Trump levied steep tariffs on imported solar panel technology and washing machines, which immediately boosted prices for U.S. consumers.” — The Hill (February 6, 2018)
(4) “Federal Reserve officials followed through on an expected interest-rate increase and raised their forecast for economic growth in 2018, even as they stuck with a projection for three (rate) hikes in the coming year.
“This change highlights that the committee expects the labor market to remain strong, with sustained job creation, ample opportunities for workers and rising wages,” Chair Janet Yellen told reporters Wednesday in Washington following the decision. In her final scheduled press conference, Yellen noted that her nominated successor, Jerome Powell, has been part of the consensus shaping the Fed’s gradual rate-hike strategy.” — “Fed Raises Rates, Eyes Three 2018 Hikes as Yellen Era Nears End” (December 13, 2017)
Part II: Inflation Bites
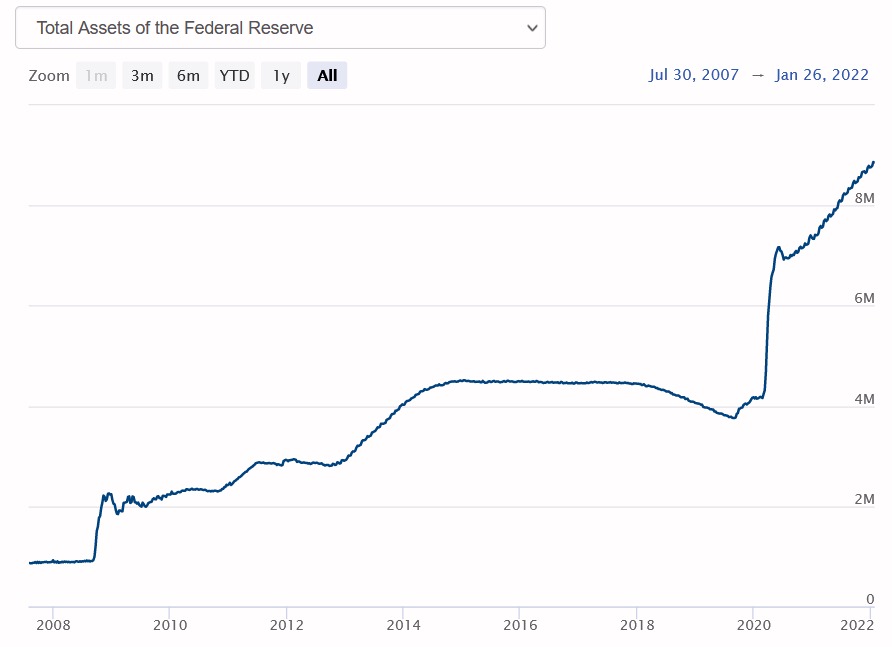
In March of 2020, the global pandemic put the Fed on hold. Then, the Fed reversed course, did not increase rates, and did substantially more (trillions) quantitative easing (see chart below.) In addition, the federal government borrowed trillions of dollars with no repayment plan. A large portion of this money was given to consumers as stimulus. The consumers shifted the demand curve causing a sharp rise in prices. “A demand curve shift refers to fundamental changes in the balance of supply and demand that alter the quantity demanded at the same price,” says The Balance Economic Theory. Consumers continued to spend beyond their means raising consumer debt. “Household debt in the third quarter of 2022, increasing by $351 billion (2.2%) to $16.51 trillion. Balances now stand $2.36 trillion higher than at the end of 2019, before the pandemic recession,” as reported by the Federal Reserve Bank of New York.
UPDATE: January 30, 2022
Inflation has hit 7% — the highest rate in 40 years.
The Fed has signaled that they are:
1) stopping quantitative easing in March
2) raising interest rates in March
Stopping quantitative easing means the Fed will no longer be supporting low Treasury yields by buying bonds. To date, they have bought over 8 trillion in Treasuries and other instruments that undercut interest rates. When the Fed stops buying Treasuries, the demand will go down and rates will go up.
The market has increased their forecast on the Fed raising rates to 4-5 times in 2022. When the Fed raises rates that banks charge each other, the banks charge you higher interest rates.
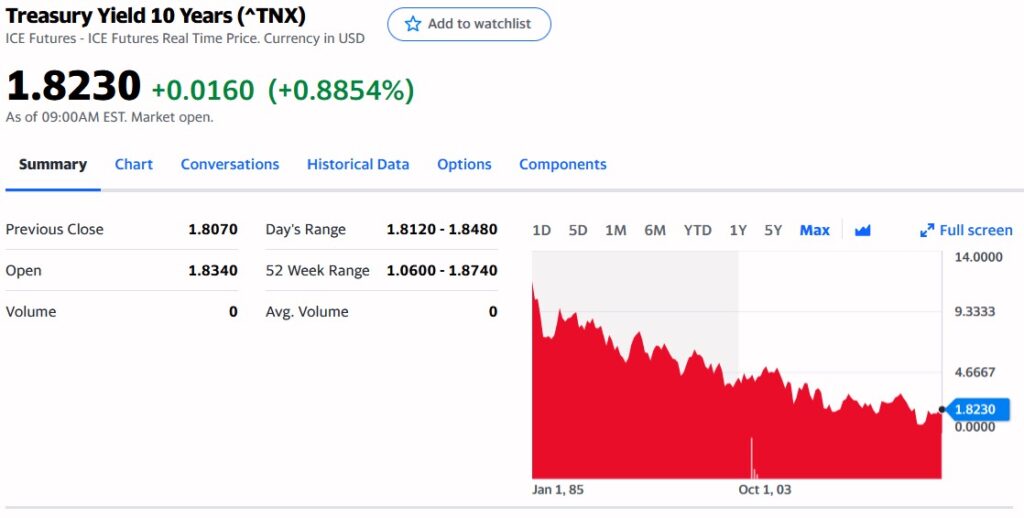
The 10 Year Treasury Note is the best indicator to watch for mortgage interest rates. It will reflect both the ending of quantitative easing and the increase in Fed funds rates. That is to say, if the Fed raises rates 1/4%, mortgage interest rates will likely rise 1/2%. That changes the forecast for mortgage rates in 2022 to rise 2 to 2.5%.
Borrow any long term money today before it is too late. [WARNING: This paper was first published in 2018. Since that time the forecast has reached fruition. It is too late to beat rising interest rates.] After rates rise for the next several years, there will be a recession. So, a long time before you may see conditions like we’ve had for the last 14 years.
Part III: U.S. Mass Consumption Results in Global Economic Disparity, Inequity, and Poverty
In Part I we mention the worst-case inflation scenario is hyper-inflation. We don’t expect hyperinflation in the US in the near future; however, higher interest rates in the US will result in hyperinflation in other parts of the world.
As long as the US Dollar is the world’s reserve currency, it is unlikely that the US will see hyperinflation. The US Congress defines the world’s reserve currency as, “a currency held by central banks in significant quantities. It is widely used to conduct international trade and financial transactions, eliminating the costs of settling transactions involving different currencies.”
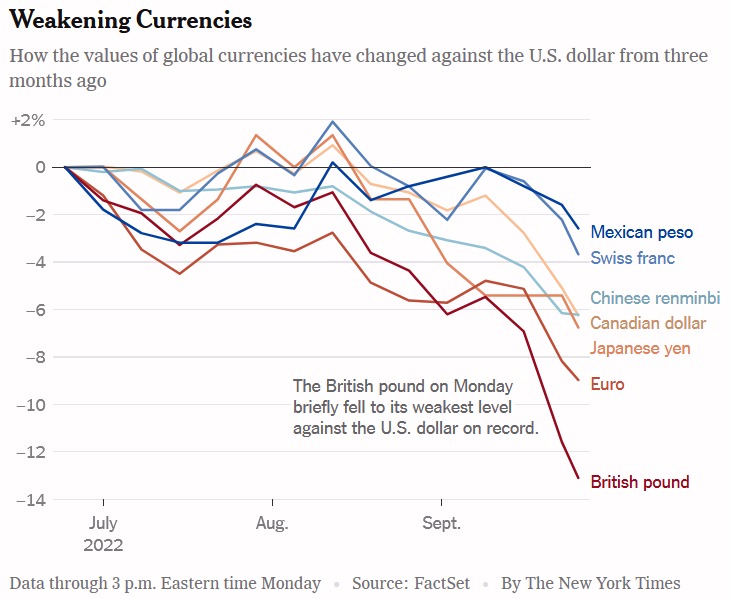
When there is inflation in the US, the US Federal Reserve Bank raises interest rates. The rise in US interest rates results in other countries’ investors putting their money in dollar denominated US interest bearing investments. That is to say, foreign investors buy dollars with their home currencies. The result is a widened disparity in the exchange rates between the currencies. The US dollar increases in value and the foreign currency depreciates in value. There is a benefit to the US consumer — imported goods and services are cheaper. The disadvantage to the foreign countries is the dollar disparity causes a much greater rise in their domestic inflation as all their imports experience both the local inflation rate as well the inflation in buying dollars. In an even worse case scenario, the foreign country has debt that has to be repaid in dollars. In essence, their debt is multiplied by a factor equal to the decline in the value of their currency.
In September of 2022, the New York Times reported, “The Federal Reserve’s determination to crush inflation at home by raising interest rates is inflicting profound pain in other countries — pushing up prices, ballooning the size of debt payments and increasing the risk of a deep recession”
“Those interest rate increases are pumping up the value of the dollar — the go-to currency for much of the world’s trade and transactions — and causing economic turmoil in both rich and poor nations. In Britain and across much of the European continent, the dollar’s acceleration is helping feed stinging inflation.”
Also in September of 2022, the Nikkei Asia reported, “Superstrong dollar threatens debt crisis across emerging economies. Mexico pressured to follow Fed hikes, while Sri Lanka’s repayment costs soar.”
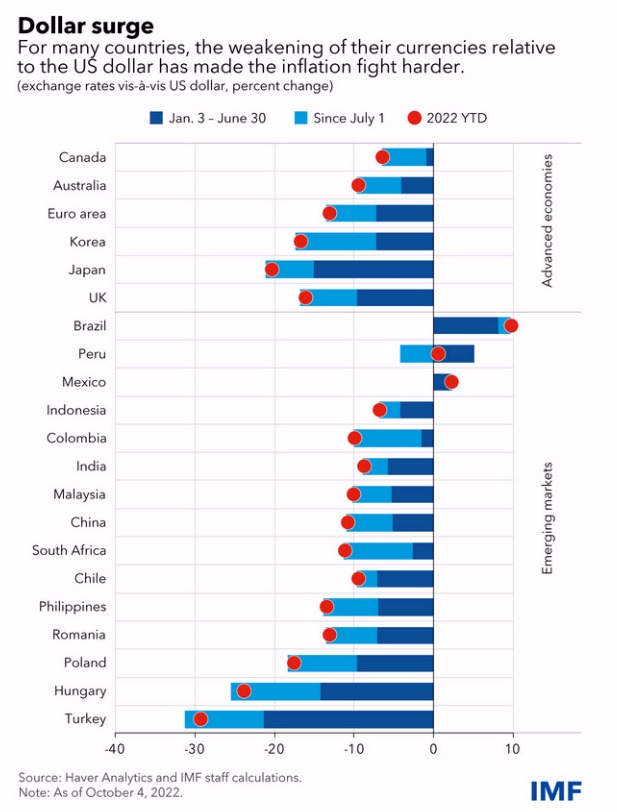
In October of 2022, the IMF reported, “The dollar is at its highest level since 2000, having appreciated 22 percent against the yen, 13 percent against the Euro and 6 percent against emerging market currencies since the start of this year. Such a sharp strengthening of the dollar in a matter of months has sizable macroeconomic implications for almost all countries, given the dominance of the dollar in international trade and finance.”
Conclusion
The United States has unsustainable mass consumption. US consumers are destroying the world’s environment and economies. The excessive demand of US consumers has resulted in the exploitation of natural resources, the largest emissions of pollution and greenhouse gases, inflation, currency disparity, and the largest redistribution of wealth in the world. Americans’ mass consumption is responsible for creating the greatest income disparity, wealth inequity, and poverty.
Part V: Your National Debt (2023)
ALSO SEE: Immigration and the Wage Inflation Spiral
Anthropologic Climate Change and Pollution