bookmark_borderNuclear Fusion

Nuclear fusion offers the most hope at rectifying human induced climate change. Nuclear fusion is how the sun works.

In a press release, Lockheed Martin states a breakthrough:

The Lockheed Martin [NYSE: LMT] Skunk Works® team is working on a new compact fusion reactor (CFR) that can be developed and deployed in as little as ten years. Currently, there are several patents pending that cover their approach.

While fusion itself is not new, the Skunk Works has built on more than 60 years of fusion research and investment to develop an approach that offers a significant reduction in size compared to mainstream efforts.

“Our compact fusion concept combines several alternative magnetic confinement approaches, taking the best parts of each, and offers a 90 percent size reduction over previous concepts,” said Tom McGuire, compact fusion lead for the Skunk Works’ Revolutionary Technology Programs. “The smaller size will allow us to design, build and test the CFR in less than a year.”

After completing several of these design-build-test cycles, the team anticipates being able to produce a prototype in five years. As they gain confidence and progress technically with each experiment, they will also be searching for partners to help further the technology.

Headquartered in Bethesda, Maryland, Lockheed Martin is a global security and aerospace company that employs approximately 113,000 people worldwide and is principally engaged in the research, design, development, manufacture, integration and sustainment of advanced technology systems, products and services. The Corporation’s net sales for 2013 were $45.4 billion.

“We can make a big difference on the energy front,” lead researcher McGuire said, noting Lockheed’s 60 years of research on nuclear fusion as a potential energy source that is safer and more efficient than current reactors based on nuclear fission.

Nuclear Fusion
Nuclear Fusion

bookmark_borderClimate-related Health Risks

The World Health Organization calls for stronger action on climate-related health risks:

“The evidence is overwhelming: climate change endangers human health,” says Dr Margaret Chan, WHO Director-General. “Solutions exist and we need to act decisively to change this trajectory.”

Previously unrecognized health benefits could be realized from fast action to reduce climate change and its consequences. For example, changes in energy and transport policies could save millions of lives annually from diseases caused by high levels of air pollution. The right energy and transport policies could also reduce the burden of disease associated with physical inactivity and traffic injury.

Measures to adapt to climate change could also save lives around the world by ensuring that communities are better prepared to deal with the impact of heat, extreme weather, infectious disease and food insecurity.

Cholera, malaria and dengue highly sensitive to weather and climate

WHO and its partners highlight the importance of acting now to help protect health in the present as well as the future. The health community is working hard to improve its capacity for surveillance and control of infectious diseases such as cholera, malaria and dengue, which are highly sensitive to weather and climate.

Climate change is already causing tens of thousands of deaths every year from shifting patterns of disease, from extreme weather events, such as heat-waves and floods, and from the degradation of water supplies, sanitation, and impacts on agriculture, according to the most recent WHO data.

“Vulnerable populations, the poor, the disadvantaged and children are among those suffering the greatest burden of climate-related impacts and consequent diseases, such as malaria, diarrhoea and malnutrition, which already kill millions every year”, notes Dr Flavia Bustreo, WHO Assistant Director-General, Family, Women’s and Children’s Health. “Without effective action to mitigate and adapt to the adverse effects of climate change on health, society will face one of its most serious health challenges,” she says.

“But the good news is that reducing climate change can yield substantial and immediate health benefits” says Dr Maria Neira, WHO Director, Department of Public Health, Environmental and Social Determinants of Health. “The most powerful example is air pollution, which in 2012 was responsible for 7 million deaths – one in eight of all deaths worldwide. There is now solid evidence that mitigating climate change can greatly reduce this toll,” she adds.

bookmark_borderStrange July Weather

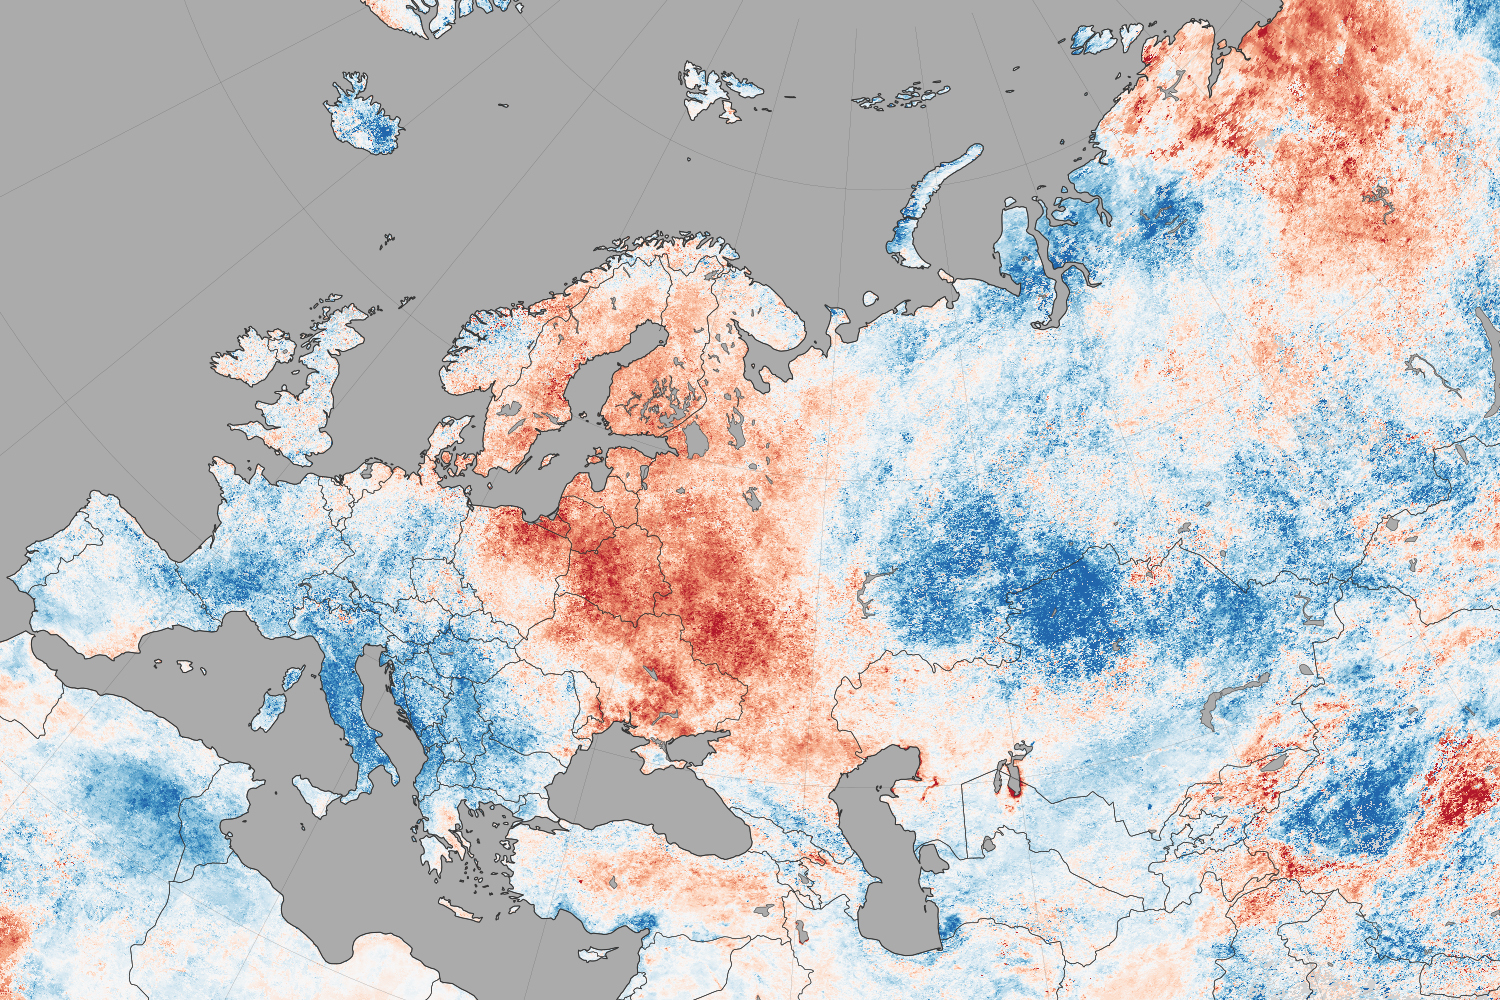
NASA reports that North America weather patterns for July 2014 were upside down:

If you live in the northern hemisphere, the past few weeks have been strange. In places where it should be seasonably hot—the eastern and southern United States and western Europe—it’s just been warm. In places where weather is usually mild in the summer—northern Europe, the Pacific coast of North America—it has been ridiculously hot.

Records for high temperatures (mid-30s°C, mid-90s°F) were approached or broken in Latvia, Poland, Belarus, Estonia, Lithuania, and Sweden in late July and early August. Searing temperatures also dried out forests and fueled wildfires in Siberia; in the U.S. states of Oregon, Washington, and California; in the Canadian provinces of British Columbia, Alberta, and Northwest Territories; and even in Sweden. At the same time, cool air moved from high northern latitudes into much of the U.S., setting record-low daytime and nighttime temperatures as far south as Florida and Georgia. Temperatures dropped to the winter-like levels in the mountains of Tennessee.

The maps on this page shows land surface temperature (LST) anomalies for July 27–August 3, 2014. They were built from data collected by the Moderate Resolution Imaging Spectroradiometer (MODIS) on NASA’s Aqua satellite, and the 2014 data is compared to the average for the same week as observed from 2005–2013. You can visit NASA Earth Observations for a view of temperature anomalies for the entire month of July.

Unusual July Temperatures

Color bar for Unusual July Temperatures

Observed by satellites uniformly across the entire globe, land surface temperatures are a measure of the amount of infrared energy (thermal radiance) emitted by Earth’s surface as it is heated by daylight and cooled in the dark of night. LSTs are sometimes referred to as land “skin” temperatures, and indeed they are a reflection of how hot a surface would feel to the touch. LST anomalies, as shown on this page, are not absolute temperatures; instead, they show how much temperatures were above or below the average. The darkest reds show areas that were as much as 10°C (20°F) above the norm; blues show areas that were below normal; light gray depicts areas with incomplete data (often due to cloud cover, such as in the area of the Indian monsoon); dark gray is ocean.

Meteorologists saw several possible and related causes for the heat waves and cooling patterns. High pressure systems over Scandinavia and northern Russia, as well as over the Pacific Northwest of North America, allowed stable air masses to build up heat domes and “block” incoming fronts that could bring changes in winds, precipitation, and temperatures. These blocking patterns worked together with unusual bends and meanders in the jet stream, which took on a see-sawing north-south pattern over the northern hemisphere. The jet moved air northward over the Pacific Ocean and warmed northwest Canada and the west coast of the U.S.; it dove south from cooler areas of Canada into the central and eastern U.S.; and it drove warm Atlantic air north into northern Europe. The jet took a similar north-south zig-zag in western and eastern Siberia. This pattern is more common in winter than in summer.

bookmark_borderConsequences Of Climate Change

NASA scientists warn:

Global climate change has already had observable effects on the environment. Glaciers have shrunk, ice on rivers and lakes is breaking up earlier, plant and animal ranges have shifted and trees are flowering sooner.

Effects that scientists had predicted in the past would result from global climate change are now occurring: loss of sea ice, accelerated sea level rise and longer, more intense heat waves.

Scientists have high confidence that global temperatures will continue to rise for decades to come, largely due to greenhouse gasses produced by human activities. The Intergovernmental Panel on Climate Change (IPCC), which includes more than 1,300 scientists from the United States and other countries, forecasts a temperature rise of 2.5 to 10 degrees Fahrenheit over the next century.

According to the IPCC, the extent of climate change effects on individual regions will vary over time and with the ability of different societal and environmental systems to mitigate or adapt to change.

The IPCC predicts that increases in global mean temperature of less than 1.8 to 5.4 degrees Fahrenheit (1 to 3 degrees Celsius) above 1990 levels will produce beneficial impacts in some regions and harmful ones in others. Net annual costs will increase over time as global temperatures increase.

“Taken as a whole,” the IPCC states, “the range of published evidence indicates that the net damage costs of climate change are likely to be significant and to increase over time.” 1

Below are some of the regional impacts of global change forecast by the IPCC:

  • North America: Decreasing snowpack in the western mountains; 5-20 percent increase in yields of rain-fed agriculture in some regions; increased frequency, intensity and duration of heat waves in cities that currently experience them.2
  • Latin America: Gradual replacement of tropical forest by savannah in eastern Amazonia; risk of significant biodiversity loss through species extinction in many tropical areas; significant changes in water availability for human consumption, agriculture and energy generation.3
  • Europe: Increased risk of inland flash floods; more frequent coastal flooding and increased erosion from storms and sea level rise; glacial retreat in mountainous areas; reduced snow cover and winter tourism; extensive species losses; reductions of crop productivity in southern Europe.4
  • Africa: By 2020, between 75 and 250 million people are projected to be exposed to increased water stress; yields from rain-fed agriculture could be reduced by up to 50 percent in some regions by 2020; agricultural production, including access to food, may be severely compromised.5
  • Asia: Freshwater availability projected to decrease in Central, South, East and Southeast Asia by the 2050s; coastal areas will be at risk due to increased flooding; death rate from disease associated with floods and droughts expected to rise in some regions.6

Global Climate Change: Recent Impacts7

Phenomena Likelihood that trend occurred in late 20th century
Cold days, cold nights and frost less frequent over land areas Very likely
More frequent hot days and nights Very likely
Heat waves more frequent over most land areas Likely
Increased incidence of extreme high sea level * Likely
Global area affected by drought has increased (since 1970s) Likely in some regions
Increase in intense tropical cyclone activity in North Atlantic (since 1970) Likely in some regions

* Excluding tsunamis, which are not due to climate change.

Global Climate Change: Future Trends8

Phenomena Likelihood of trend
Contraction of snow cover areas, increased thaw in permafrost regions, decrease in sea ice extent Virtually certain
Increased frequency of hot extremes, heat waves and heavy precipitation Very likely to occur
Increase in tropical cyclone intensity Likely to occur
Precipitation increases in high latitudes Very likely to occur
Precipitation decreases in subtropical land regions Very likely to occur
Decreased water resources in many semi-arid areas, including western U.S. and Mediterranean basin High confidence

bookmark_borderClimate Change and the Presidental Action Plan

The President’s Plan to Cut Carbon Pollution in America

Reducing Carbon Pollution from Power Plants

Power plants are the largest major source of emissions in the U.S., together accounting for roughly one-third of all domestic greenhouse gas pollution.

PROGRESS:

In September 2013, the Environmental Protection Agency (EPA) announced proposed carbon pollution standards for new power plants.

PROGRESS:

The EPA has met with more than 300 stakeholder groups from across the country to gather information on standards for existing power plants. In June 2014, the EPA issued proposed carbon pollution standards for existing power plants.


Continuing the momentum for the future:


Accelerating Clean Energy Leadership

During the President’s first term, the United States more than doubled generation of electricity from wind and solar energy.


PROGRESS:

Since President Obama took office, the U.S. increased solar generation by more than ten-fold and tripled electricity production from wind power.

PROGRESS:

The Department of the Interior (DOI) announced permitting the 50th utility-scale renewable energy project on public lands. The projects could support more than 20,000 jobs and generate enough electricity to power 4.8 million homes.

PROGRESS:

In May 2014, the DOE’s Solar Instructor Training Network announced it will support training programs at community colleges across the country that will assist 50,000 workers to enter the solar industry by 2020.

PROGRESS:

In May 2014, President Obama announced more than 300 commitments private and public sector commitments to create jobs and cut carbon pollution by advancing solar deployment and energy efficiency — representing enough energy to power nearly 130,000 homes.


Continuing the momentum for the future:

Building a 21st Century Clean Energy Infrastructure

Heavy-duty vehicles (commercial trucks, vans, and buses) are currently the second largest source of greenhouse gas pollution within the transportation sector.


PROGRESS:

In January 2014, President Obama signed a Presidential Memorandum establishing the federal government’s first Quadrennial Energy Review (QER) process, with an initial focus on our nation’s energy infrastructure.

PROGRESS:

In February 2014, President Obama directed EPA and DOT to develop and issue the next phase of heavy-duty vehicle fuel efficiency and greenhouse gas standards by March 2016.

PROGRESS:

In 2011, the Administration finalized fuel economy standards for Model Year 2014-2018 for heavy-duty trucks, buses, and vans. This will reduce greenhouse gas emissions by about 270 million metric tons and save 530 million barrels of oil.

PROGRESS:

The Administration has already established the toughest fuel economy standards for passenger vehicles in U.S. history. These standards require an average performance equivalent of 54.5 miles per gallon by 2025.


Continuing the momentum for the future:

Cutting energy waste in homes, businesses, and factories

Energy efficiency is one of the clearest and most cost-effective opportunities to save families money, make our businesses more competitive, and reduce greenhouse gas pollution.


PROGRESS:

Since June, 75 new partners have joined the President’s Better Buildings Challenge. More than 190 organizations, together representing over 3 billion square feet of building space, have now committed to energy savings.

PROGRESS:

In President Obama’s first term, DOE and HUD completed efficiency upgrades in nearly two million homes, saving many families more than $400 on their heating and cooling bills in the first year alone.

PROGRESS:

In December 2013, the Department of Agriculture announced it will provide up to $250 million to help businesses and residential customers in rural areas cut their energy bills through energy efficiency and renewable energy use.

PROGRESS:

Since June, DOE has issued nine proposed and seven final energy conservation standards for appliances and equipment. If finalized and combined with rules already issued, the energy savings will help cut consumers’ electricity bills by hundreds of billions of dollars.


Continuing the momentum for the future:

Reducing other greenhouse gas emissions

Emissions of hydrofluorocarbons (HFCs) — which are potent greehouse gases — are expected to double by 2020 and nearly triple by 2030 in the U.S.

PROGRESS:

Since 1990, methane emissions have decreased by 11% in part through partnerships with industry.

PROGRESS:

In March 2014, the Administration released a Strategy to Reduce Methane Emissions from landfills, coal mining, agriculture, and oil and gas systems through voluntary actions and common-sense standards.


Continuing the momentum for the future:

Federal leadership

Since 2008, federal agencies have reduced greenhouse gas pollution by more than 17 percent — the equivalent of permanently taking 1.8 million cars off the road.

PROGRESS:

Expanded energy performance contracts from $2 billion to $4 billion to provide energy efficiency upgrades for Federal buildings, at no net cost to the taxpayer.

PROGRESS:

On December 5, President Obama signed a Presidential Memorandum directing the federal government to buy at least 20% of its electricity from renewable sources by 2020.

bookmark_borderCollapse Of West Antarctica

The collapse of the ice sheet in West Antarctica have raised concern about the rising sea level.

“This is really happening,” Thomas P. Wagner, who runs NASA’s programs on polar ice, said. “There’s nothing to stop it now. But you are still limited by the physics of how fast the ice can flow.”

“Today we present observational evidence that a large sector of the West Antarctic ice sheet has gone into irreversible retreat,” Dr. Rignot said in the NASA news conference. “It has passed the point of no return.”

“Even if the warm water now eating away at the ice were to dissipate, it would be too little, too late to stabilize the ice sheet,” Dr. Joughin said. “There’s no stabilization mechanism.”

“If we have indeed lit the fuse on West Antarctica, it’s very hard to imagine putting the fuse out,” Dr. Alley said. “But there’s a bunch more fuses, and there’s a bunch more matches, and we have a decision now: Do we light those?”

The NASA study says:
A new study by researchers at NASA and the University of California, Irvine, finds a rapidly melting section of the West Antarctic Ice Sheet appears to be in an irreversible state of decline, with nothing to stop the glaciers in this area from melting into the sea.

The study presents multiple lines of evidence, incorporating 40 years of observations that indicate the glaciers in the Amundsen Sea sector of West Antarctica “have passed the point of no return,” according to glaciologist and lead author Eric Rignot, of UC Irvine and NASA’s Jet Propulsion Laboratory (JPL) in Pasadena, California. The new study has been accepted for publication in the journal Geophysical Research Letters.

These glaciers already contribute significantly to sea level rise, releasing almost as much ice into the ocean annually as the entire Greenland Ice Sheet. They contain enough ice to raise global sea level by 4 feet (1.2 meters) and are melting faster than most scientists had expected. Rignot said these findings will require an upward revision to current predictions of sea level rise.

“This sector will be a major contributor to sea level rise in the decades and centuries to come,” Rignot said. “A conservative estimate is it could take several centuries for all of the ice to flow into the sea.”

Three major lines of evidence point to the glaciers’ eventual demise: the changes in their flow speeds, how much of each glacier floats on seawater, and the slope of the terrain they are flowing over and its depth below sea level. In a paper in April, Rignot’s research group discussed the steadily increasing flow speeds of these glaciers over the past 40 years. This new study examines the other two lines of evidence.

The glaciers flow out from land to the ocean, with their leading edges afloat on the seawater. The point on a glacier where it first loses contact with land is called the grounding line. Nearly all glacier melt occurs on the underside of the glacier beyond the grounding line, on the section floating on seawater.

Just as a grounded boat can float again on shallow water if it is made lighter, a glacier can float over an area where it used to be grounded if it becomes lighter, which it does by melting or by the thinning effects of the glacier stretching out. The Antarctic glaciers studied by Rignot’s group have thinned so much they are now floating above places where they used to sit solidly on land, which means their grounding lines are retreating inland.

“The grounding line is buried under a thousand or more meters of ice, so it is incredibly challenging for a human observer on the ice sheet surface to figure out exactly where the transition is,” Rignot said. “This analysis is best done using satellite techniques.”

The team used radar observations captured between 1992 and 2011 by the European Earth Remote Sensing (ERS-1 and -2) satellites to map the grounding lines’ retreat inland. The satellites use a technique called radar interferometry, which enables scientists to measure very precisely — within less than a quarter of an inch — how much Earth’s surface is moving. Glaciers move horizontally as they flow downstream, but their floating portions also rise and fall vertically with changes in the tides. Rignot and his team mapped how far inland these vertical motions extend to locate the grounding lines.

The accelerating flow speeds and retreating grounding lines reinforce each other. As glaciers flow faster, they stretch out and thin, which reduces their weight and lifts them farther off the bedrock. As the grounding line retreats and more of the glacier becomes waterborne, there’s less resistance underneath, so the flow accelerates.

Slowing or stopping these changes requires pinning points — bumps or hills rising from the glacier bed that snag the ice from underneath. To locate these points, researchers produced a more accurate map of bed elevation that combines ice velocity data from ERS-1 and -2 and ice thickness data from NASA’s Operation IceBridge mission and other airborne campaigns. The results confirm no pinning points are present upstream of the present grounding lines in five of the six glaciers. Only Haynes Glacier has major bedrock obstructions upstream, but it drains a small sector and is retreating as rapidly as the other glaciers.

The bedrock topography is another key to the fate of the ice in this basin. All the glacier beds slope deeper below sea level as they extend farther inland. As the glaciers retreat, they cannot escape the reach of the ocean, and the warm water will keep melting them even more rapidly.

The accelerating flow rates, lack of pinning points and sloping bedrock all point to one conclusion, Rignot said.

“The collapse of this sector of West Antarctica appears to be unstoppable,” he said. “The fact that the retreat is happening simultaneously over a large sector suggests it was triggered by a common cause, such as an increase in the amount of ocean heat beneath the floating sections of the glaciers. At this point, the end of this sector appears to be inevitable.”

Because of the importance of this part of West Antarctica, NASA’s Operation IceBridge will continue to monitor its evolution closely during this year’s Antarctica deployment, which begins in October. IceBridge uses a specialized fleet of research aircraft and the most sophisticated suite of science instruments ever assembled to characterize changes in thickness of glaciers, ice sheets and sea ice.

bookmark_borderGlobal Warming Exponential Damage

The U.N. Intergovernmental Panel on Climate Change reported that global warming is spiraling out of control. “The world, in many cases, is ill-prepared for risks from a changing climate,” the IPCC said.

FAQ 1: Are risks of climate change mostly due to changes in extremes, changes in average climate, or both?

People and ecosystems across the world experience climate in many different ways, but weather and climate extremes strongly influence losses and disruptions. Average climate conditions are important. They provide a starting point for understanding what grows where and for informing decisions about tourist destinations, other business opportunities, and crops to plant. But the impacts of a change in average conditions often occur as a result of changes in the frequency, intensity, or duration of extreme weather and climate events. It is the extremes that place excessive and often unexpected demands on systems poorly equipped to deal with those extremes. For example, wet conditions lead to flooding when storm drains and other infrastructure for handling excess water are overwhelmed. Buildings fail when wind speeds exceed design standards. For many kinds of disruption, from crop failure caused by drought to sickness and death from heat waves, the main risks are in the extremes, with changes in average conditions representing a climate with altered timing, intensity, and types of extremes.

FAQ 2: How much can we say about what society will be like in the future, in order to plan for climate change impacts?

Overall characteristics of societies and economies, such as population size, economic activity, and land use, are highly dynamic. On the scale of just one or two decades, and sometimes in less time than that, technological revolutions, political movements, or singular events can shape the course of history in unpredictable ways. To understand potential impacts of climate change for societies and ecosystems, scientists use scenarios to explore implications of a range of possible futures. Scenarios are not predictions of what will happen, but they can be useful tools for researching a wide range of “what if” questions about what the world might be like in the future. They can be used to study future emissions of greenhouse gases and climate change. They can also be used to explore the ways climate-change impacts depend on changes in society, such as economic or population growth or
progress in controlling diseases. Scenarios of possible decisions and policies can be used to explore the solution space for reducing greenhouse gas emissions and preparing for a changing climate. Scenario analysis creates a foundation for understanding risks of climate change for people, ecosystems, and economies across a range of possible futures. It provides important tools for smart decision-making when both uncertainties and consequences are large.

FAQ 3: Why is climate change a particularly difficult challenge for managing risk?

Risk management is easier for nations, companies, and even individuals when the likelihood and consequences of possible events are readily understood. Risk management becomes much more challenging when the stakes are higher or when uncertainty is greater. As the WGII AR5 demonstrates, we know a great deal about the impacts of climate change that have already occurred, and we understand a great deal about expected impacts in the future. But many uncertainties remain, and will persist. In particular, future greenhouse gas emissions depend on societal choices, policies, and technology advancements not yet made, and climate-change impacts depend on both the amount of climate change that occurs and the effectiveness of development in reducing exposure and vulnerability. The real challenge of dealing effectively with climate change is recognizing the value of wise and timely decisions in a setting where complete knowledge is impossible. This is the essence of risk management.

bookmark_borderNews from the Ice Wars

The Membrane Domain has been conducting Human Induced Climate Change Experiments since 1999. One of the first scientist to hypothesize that global warming was exponential (as opposed to the linear models) requested fellow scientists to conduct studies.

One Membrane Domain scientists began a study on the decline of the ice mass. The analysis is on-going; however, recent data leads to the conclusion that the process is exponential:

The two largest ice sheets on earth, Greenland and Antarctica, are losing mass faster and faster. The figure below is from Velicogna and Wahr, “Time-variable gravity observations of ice sheet mass balance: Precision and limitations of the GRACE satellite data” GEOPHYSICAL RESEARCH LETTERS, VOL. 40, 3055-3063, doi:10.1002/grl.50527, 2013

Mass loss for Greenland and  Antarctica from 2003-2013

For reference, 360 GTonne of mass loss results in 1 mm sea level rise. Greenland lost more than that in 2012 alone.

Causes of Mass Loss

I. Marine terminated glaciers flow to the ocean and calve off icebergs. The figure below is from Rignot and Mouginot,”Ice flow in Greenland for the International Polar Year 2008-2009,” GEOPHYSICAL RESEARCH LETTERS, VOL. 39, L11501, doi:10.1029/2012GL051634, 2012

Read More on the Decline of the Ice Mass

bookmark_borderExtreme Weather Events and the Meandering Jet Stream

The extreme weather events effecting the USA, England and Australia by be a result of a change in the Jetstream. The BBC reports:

New research suggests that the main system that helps determine the weather over Northern Europe and North America may be changing.

The study shows that the so-called jet stream has increasingly taken a longer, meandering path.

This has resulted in weather remaining the same for more prolonged periods.

The work was presented at the annual meeting of the American Association for the Advancement of Science (AAAS) in Chicago.

The observation could be as a result of the recent warming of the Arctic. Temperatures there have been rising two to three times faster than the rest of the globe.

According to Prof Jennifer Francis of Rutgers University in New Jersey: “This does seem to suggest that weather patterns are changing and people are noticing that the weather in their area is not what it used to be.”

The meandering jet stream has accounted for the recent stormy weather over the UK and the bitter winter weather in the US Mid-West remaining longer than it otherwise would have.

“We can expect more of the same and we can expect it to happen more frequently,” says Prof Francis

bookmark_borderWinter Storm Battering Mid-Atlantic and New England

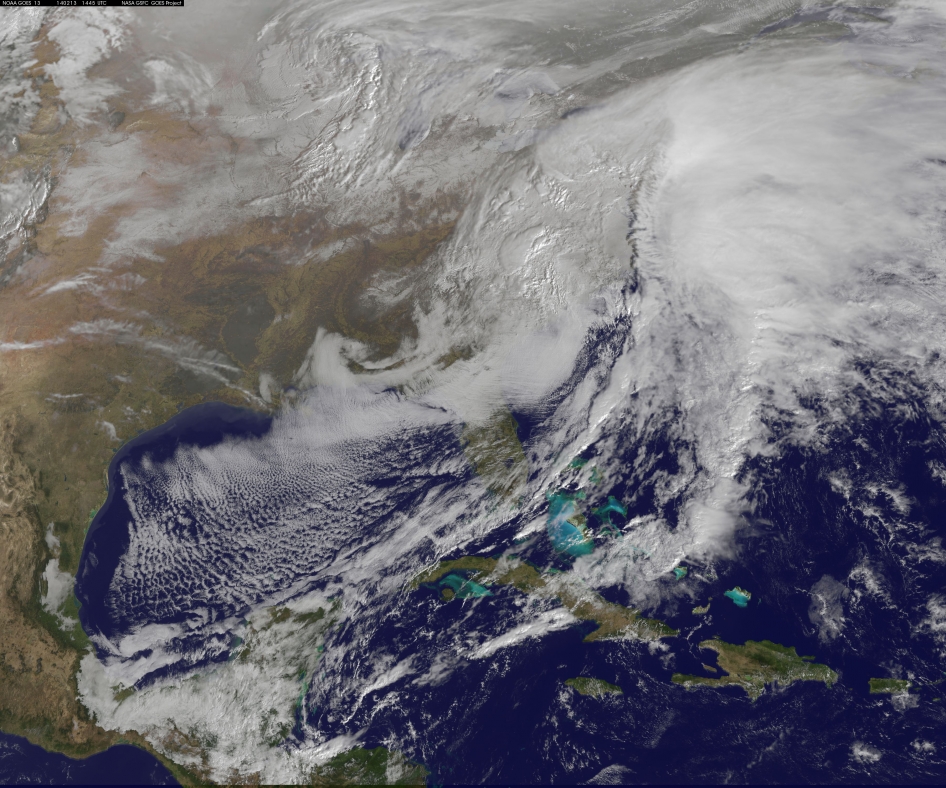
This visible image of the winter storm over the U.S. south and East Coast was taken by NOAA's GOES-13 satellite on Feb. 13 at 1455 UTC/9:45 a.m. EST. Snow covered ground can be seen over the Great Lakes region and Ohio Valley. Image Credit:  NASA/NOAA GOES Project
This visible image of the winter storm over the U.S. south and East Coast was taken by NOAA’s GOES-13 satellite on Feb. 13 at 1455 UTC/9:45 a.m. EST. Snow covered ground can be seen over the Great Lakes region and Ohio Valley. Image Credit: NASA/NOAA GOES Project

NASA — The monster winter storm that brought icing to the U.S. southeast moved northward along the Eastern Seaboard and brought snow, sleet and rain from the Mid-Atlantic to New England on February 13. A new image from NOAA’s GOES satellite showed clouds associated with the massive winter storm stretch from the U.S. southeast to the northeast.

Data from NOAA’s GOES-East satellite taken on Feb. 13 at 1455 UTC/9:45 a.m. EST were made into an image by NASA/NOAA’s GOES Project at NASA’s Goddard Space Flight Center in Greenbelt, Md. The clouds and fallen snow data from NOAA’s GOES-East satellite were overlaid on a true-color image of land and ocean created by data from the Moderate Resolution Imaging Spectroradiometer or MODIS instrument that flies aboard NASA’s Aqua and Terra satellites.The image showed that the clouds associated with the storm were blanketing much of the U.S. East Coast.

At 3:11 a.m. EST, a surface map issued by the National Weather Service or NWS showed the storm’s low pressure area was centered over eastern North Carolina. Since then, the low has continued to track north along the eastern seaboard. By 11 a.m. EST, precipitation from the storm was falling from South Carolina to Maine, according to National Weather Service radar.

By 11 a.m. EST, the Washington, D.C. region snow and sleet totals ranged from 3″ in far eastern Maryland to over 18″ in the northern and western suburbs in Maryland and Virginia. NWS reported that snow, sleet and rain were still falling and more snow is expected as the back side of the low moves into the region.

The New York City region remained under an NWS Winter Storm Warning until 6 a.m. on Friday, February 14 and the National Weather Service expects minor coastal impacts Thursday into Friday afternoon.

New England was also being battered by the storm. At 10:56 a.m. EST, Barnstable, Mass. on Cape Cod was experiencing rain and winds gusting to 28 mph. An NWS wind advisory is in effect for Cape Cod until 7 p.m. EST.

Further north, Portland, Maine was experiencing heavy snow with winds from the northeast at 6 mph. The National Weather Service in Gray, Maine noted “Significant snowfall is likely for much of western Maine and New Hampshire as this storm passes by. There will be a mix or changeover to sleet and freezing rain over southern and coastal sections tonight…before all areas end as a period of snow Friday (Feb. 14) morning.”

On February 13 at 10 a.m. EST, NOAA’s National Weather Service noted “An abundance of Atlantic moisture getting wrapped into the storm will continue to fuel widespread precipitation…which should lift through the Mid-Atlantic States and Northeast Thursday into Friday. A wide swath of heavy snow accumulations are expected with this storm…but air [moving] off the warmer ocean water should change snow over to rain along the coastal areas. Also…a narrow axis of sleet and freezing rain will be possible within the transition zone…which is expected to set up near the I-95 corridor.” For updates on local forecasts, watches and warnings, visit NOAA’s www.weather.gov webpage.

GOES satellites provide the kind of continuous monitoring necessary for intensive data analysis. Geostationary describes an orbit in which a satellite is always in the same position with respect to the rotating Earth. This allows GOES to hover continuously over one position on Earth’s surface, appearing stationary. As a result, GOES provide a constant vigil for the atmospheric “triggers” for severe weather conditions such as tornadoes, flash floods, hail storms and hurricanes.

For updated information about the storm system, visit NOAA’s WPC website: http://www.hpc.ncep.noaa.gov/