By systematically coding behaviors and rhetoric, this research identifies demographic patterns, behavioral characteristics, and ideological markers associated with denialist and ecofascist individuals. Findings indicate that these forms of discourse are dominated by specific demographic groups, exhibit distinctive behavioral traits, and reveal the intersection of ideological and scientific ignorance.
Denialism: Identified by outright rejection of scientific evidence, refusal to engage with empirical data, and reliance on misinformation or rhetorical obfuscation. Denialism is about self-interest.
Ecofascism: Identified by denialism combined with aggressive, hostile, and mocking behavior, often coupled with ideological framing that rationalizes environmental collapse as beneficial for select populations, eugenics, and elite networks surviving over “inferior genes.” Ecofascism is about genetic superiority.
Background
I initially began investigating denialism and the CO₂ Coalition in the spring of 2025, tracing its connections to the Department of Energy’s Climate Working Group (CWG). My early hypothesis focused on profit: fossil fuel interests fund campaigns to cast doubt on the scientific consensus to protect investments and delay regulation. While this motive exists, it did not fully explain the patterns emerging from elite networks.
It wasn’t until the release of the Epstein Files that the ideological dimension became clear. Analysis of correspondence, affiliations, and rhetoric revealed a second pattern: this was not merely economic denialism, but the normalization of ecofascism. Ecofascism frames environmental collapse as beneficial—even desirable—if it reduces populations deemed inferior, excessive, or expendable. It merges environmental crisis with authoritarian hierarchy, racialized survival logic, and elite domination theory.
This is not speculation; it is evident in language. Publicly released statements attributed to Jeffrey Epstein include:
“I liked the argument that more CO₂ is good for plants.”
This statement echoes the central messaging long promoted by the CO₂ Coalition, which similarly frames increased atmospheric CO₂ as broadly beneficial due to its role in plant growth.
Combined with explicit eugenic ideology:
“Maybe climate change is a good way of dealing with overpopulation—the earth’s forest fire. Potentially a good thing for the species.”
“Executions of the elderly and infirm make sense.”
“African music has lots of beats and little development—not an accident. It mirrors their learning process.”
This is not conventional policy disagreement. It is eliminationist logic: where traditional denial protects capital, ecofascism rationalizes unequal human survival.
The analysis focused on several thousand interactions on English-language social media sites and forums. Individual responses were coded according to their engagement with climate science. Demographic data, when inferable from public profiles, were recorded, including age, gender, and country of origin. Behavioral patterns and rhetorical strategies were systematically categorized.
Denialism
Predominantly displayed by individuals who refused to engage with empirical evidence, often relying on anecdotal reasoning or misinformation.
Demographics: 98% white males, mean age 42.
Geography: Primarily from the United States, Canada, Australia, and the United Kingdom.
Ecofascism
Characterized by denialism combined with overt hostility, ridicule, and ideological framing that links climate mitigation to authoritarian or exclusionary goals.
Demographics: 100% white males, mean age 47.
Geography: Same as above — U.S., Canada, Australia, and the U.K.
Behavioral Indicators: Repeated use of mocking or disparaging language, attempts to discredit scientific authority, and framing environmental issues through racial, hierarchical, or eliminationist logic.
Political Affiliation: 100% identified as far-right.
Discussion
The findings indicate that online climate denialism is largely concentrated within specific demographic groups and is often reinforced by identity and ideological alignment rather than by scientific literacy. Ecofascist rhetoric represents a more extreme subset, wherein denialist positions are fused with authoritarian, exclusionary, or eugenicist ideologies. Both denialism and ecofascism act as significant barriers to constructive public discourse, perpetuating misinformation and obstructing meaningful engagement with climate science. The observed demographic patterns suggest that targeted educational and outreach strategies may be necessary to counteract ideological extremism and improve public understanding.
An unexpected finding was the disproportionately high representation of Canadians employed in the timber industry, highlighting potential sector-specific cultural or economic influences on climate denial and ecofascist rhetoric.
This is ongoing research.
The dataset now includes tens of thousands of observed interactions.
Fortunately, a growing network of citizen scientists has begun assisting in documentation and data collection.
Abstract This study investigates patterns of climate denialism and ecofascism in online discourse, analyzing several thousand interactions with English-language climate change posts and comments. By systematically coding behaviors and rhetoric, this research identifies demographic patterns, behavioral characteristics, and ideological markers associated with denialist and ecofascist individuals. Findings indicate that these forms of discourse are dominated by specific demographic groups, exhibit distinctive behavioral traits, and reveal the intersection of ideological and scientific ignorance.
Introduction
The public discourse on climate change is shaped not only by scientific evidence but also by the sociopolitical and ideological frameworks through which individuals interpret information. Online platforms have become critical arenas for examining these interactions, particularly the proliferation of denialism and ecofascist rhetoric. Denialism refers to the outright rejection or dismissal of established scientific findings, whereas ecofascism combines denialist rhetoric with authoritarian, exclusionary, or eliminationist ideologies. This study aims to empirically characterize these phenomena in English-speaking online communities.
Methods
The analysis focused on several thousand interactions on English-language social media sites and forums. Individual responses were coded according to their engagement with climate science:
Denialism: Identified by outright rejection of scientific evidence, refusal to engage with empirical data, and reliance on misinformation or rhetorical obfuscation.
Ecofascism: Identified by denialism combined with aggressive, hostile, and mocking behavior, often coupled with ideological framing that rationalizes environmental collapse as beneficial for select populations.
Demographic data, when inferable from public profiles, were recorded, including age, gender, and country of origin. Behavioral patterns and rhetorical strategies were systematically categorized.
Results
Denialism
Predominantly displayed by individuals who refused to engage with empirical evidence, often relying on anecdotal reasoning or misinformation.
Demographics: 98% white males, mean age 42.
Geography: Primarily from the United States, Canada, Australia, and the United Kingdom.
Ecofascism
Characterized by denialism combined with overt hostility, ridicule, and ideological framing that links climate mitigation to authoritarian or exclusionary goals.
Demographics: 100% white males, mean age 47.
Geography: Same as above — U.S., Canada, Australia, and the U.K.
Behavioral Indicators: Repeated use of mocking or disparaging language, attempts to discredit scientific authority, and framing environmental issues through racial, hierarchical, or eliminationist logic.
Political Affiliation: 100% identified as far-right.
Discussion
The findings indicate that online climate denialism is largely concentrated within specific demographic groups and is often reinforced by identity and ideological alignment rather than by scientific literacy. Ecofascist rhetoric represents a more extreme subset, wherein denialist positions are fused with authoritarian, exclusionary, or eugenicist ideologies. Both denialism and ecofascism act as significant barriers to constructive public discourse, perpetuating misinformation and obstructing meaningful engagement with climate science. The observed demographic patterns suggest that targeted educational and outreach strategies may be necessary to counteract ideological extremism and improve public understanding.
An unexpected finding was the disproportionately high representation of Canadians employed in the timber industry, highlighting potential sector-specific cultural or economic influences on climate denial and ecofascist rhetoric.
Conclusion
This case study highlights the importance of analyzing online climate discourse through both scientific and sociological lenses. Denialism and ecofascism, while distinct in intensity and ideological framing, share common features: rejection of scientific evidence, reinforcement of identity-driven narratives, and susceptibility to manipulative or conspiratorial messaging. Future research should expand beyond English-language platforms and incorporate longitudinal analyses to examine the evolution of these ideologies over time.
Recent observations across multiple climate indicators confirm that the impacts of global warming are accelerating at a nonlinear rate. We revisit the Nonlinear Acceleration Hypothesis, originally proposed in the early 1990s, which posits that climate impacts increase exponentially rather than linearly due to interacting feedback mechanisms within the Earth system.
By the early 2000s, multiple independent datasets showed evidence of accelerating change, including:
Sea-level rise (SLR)
Surface and tropospheric temperature trends
Greenland and Antarctic ice mass balance loss
Ocean heat content
Wildfire frequency and burned area
Hydrological extremes
Our analysis indicates that the doubling time of observable climate impacts—including extreme heat events, wildfire frequency, cryosphere mass loss, and coastal exposure—has declined from roughly 100 years in pre-industrial conditions to approximately 2–5 years by 2024.
While the physical climate system has received increasing scientific attention, the economic consequences of nonlinear climate acceleration remain widely underestimated. In particular, the interaction between rising flood risk, insurance market withdrawal, and mortgage availability is likely to trigger a systemic repricing of real estate assets in vulnerable regions.
This paper explores how accelerating climate impacts are compressing the time scale over which real estate markets adjust to climate risk, potentially resulting in rapid declines in property values across flood-prone regions.
1. Introduction
Climate change has traditionally been communicated as a gradual process, progressing roughly in proportion to greenhouse gas emissions. However, increasing evidence suggests that many climate processes exhibit nonlinear behavior, where relatively small changes trigger disproportionately large impacts.
The Earth’s climate system is a complex adaptive system governed by interacting physical, chemical, and biological processes. Such systems frequently exhibit:
reinforcing feedback loops
threshold behavior
abrupt transitions
chaotic dynamics
In the early 1990s we proposed the Nonlinear Acceleration Hypothesis, suggesting that climate impacts increase exponentially through reinforcing feedback mechanisms.
Over subsequent decades, research across climate science disciplines has increasingly supported the importance of nonlinear processes in climate dynamics.
In our previous work, “Underestimating the Speed of Climate Change,” we examined evidence confirming that:
climate impacts are accelerating exponentially
the doubling time of impacts is rapidly shrinking
coastal hazard exposure has been systematically underestimated
interacting feedback systems may be driving cascading tipping-point behavior
The present paper extends that framework to examine economic impacts, specifically the vulnerability of real estate markets to accelerating climate risk.
2. The Nonlinear Acceleration Hypothesis
The Nonlinear Acceleration Hypothesis states that climate impacts follow an exponential growth pattern:I(t)=I0ekt
Where:
I(t) = magnitude of climate impact
I0 = baseline impact
k = acceleration constant
t = time
The doubling time of impacts can be expressed as:Td=kln(2)
Historical observations suggest that the acceleration constant k has increased over time, implying shorter doubling intervals.
Estimated Doubling Time Evolution
Period
Estimated Doubling Time
Pre-industrial
~100 years
~2000
~10 years
~2024
2–5 years
At current acceleration rates, impacts could increase approximately:26=64
fold within a decade.
3. Climate Risk and Real Estate Markets
Real estate markets are highly sensitive to perceived environmental risk, particularly flood risk.
Property value depends heavily on three interrelated factors:
Insurance availability
Mortgage eligibility
Future habitability
Without insurance, lenders typically refuse to issue mortgages. Without mortgage financing, property liquidity collapses and market values fall sharply.
I began studying FEMA flood insurance, mortgage markets, and climate risk in the 1980s. In the early 2000s, I met with both FEMA and the Federal National Mortgage Association (Fannie Mae) to better understand institutional perspectives on climate risk.
At the time, the official position of many agencies assumed that flood risk could be addressed through localized adaptation measures such as levees and floodplain management.
However, over time federal policy gradually shifted from:
Adaptation → Mitigation → Managed Retreat
FEMA has increasingly acknowledged that rebuilding in highly vulnerable areas may be economically unsustainable.
4. Insurance Market Retreat
The first signs of climate-driven market adjustment appeared in insurance markets.
Timeline of Insurance Market Changes
2010s – Private insurers began raising premiums in high-risk regions, particularly in coastal and wildfire-prone states.
2020s – Many states implemented regulatory restrictions on rate increases. In response, insurance companies began withdrawing from high-risk markets rather than raising prices.
2025 – Florida effectively socialized large portions of its property insurance system, with the state and taxpayers becoming the largest providers of hazard insurance.
Similar patterns emerged in:
Louisiana
Texas
California
As private insurers withdraw, risk is increasingly transferred to public balance sheets, creating growing fiscal exposure.
5. The Doubling Time of Floods
Climate-driven changes in precipitation patterns have significantly increased flood frequency.
Historically, flood risk classifications were based on statistical models assuming stationary climate conditions.
Observed changes suggest dramatic compression in recurrence intervals.
Changing Flood Recurrence Intervals
Historical Label
Approximate Modern Frequency
1,000-year flood
~500 years (1990s)
500-year flood
~100 years (2010)
100-year flood
~10 years (2020)
100-year flood
2–5 years (2025)
In practical terms, floods once considered extremely rare are now occurring within a single generation.
6. The 2025 Flash Flood Cascade
The increasing instability of the hydrological cycle was dramatically illustrated during July 2025.
Within a ten-day period, hundreds of flash floods struck communities across the United States, affecting:
Texas
New Mexico
North Carolina
Florida
Illinois
Pennsylvania
Delaware
New Jersey
Maryland
Virginia
Iowa
At least five “1-in-1,000-year” rainfall events occurred during this short period.
Meanwhile, several states—including Pennsylvania, Delaware, New Jersey, Maryland, Virginia, and Iowa—reported multiple “500-year” floods as extreme rainfall overwhelmed infrastructure.
These events illustrate the collapse of traditional flood-frequency assumptions.
7. The Real Estate Repricing Mechanism
Real estate values depend on long-term expectations of safety and insurability.
When climate risk increases faster than markets can adjust, property prices may remain temporarily inflated.
However, once insurance becomes unavailable or unaffordable, prices can adjust suddenly and sharply.
This process can be described as a climate risk discount:V=(r+c)R
Where:
= property value
= expected rental value
= discount rate
= climate risk premium
As perceived climate risk c increases, property values decline.
When insurance becomes unavailable, the effective climate risk premium may increase dramatically, producing rapid price corrections.
8. Compression of Climate Time
The interaction between accelerating climate impacts and slow-moving financial institutions creates temporal compression.
Climate risks accelerate while economic institutions—insurance markets, mortgage systems, and regulatory frameworks—adapt slowly.
This mismatch creates conditions in which:
risk accumulates gradually
recognition of risk occurs suddenly
market adjustment becomes rapid
The result is a pattern of apparent stability followed by abrupt economic transition.
9. Cascading Economic Feedbacks
A climate-driven decline in real estate values can initiate secondary financial cascades, amplifying economic vulnerability across multiple sectors. Potential systemic risks include:
Declining municipal tax bases, reducing funding for essential services and infrastructure
Shortfalls in infrastructure investment, limiting the ability to maintain or upgrade flood defenses and public works
Increased mortgage default risk, as property values fall below outstanding loan balances
Regional population migration, which can destabilize local economies and labor markets
Collapse or withdrawal of insurance markets, shifting risk to public balance sheets
Credit market stress, as lenders and investors reassess exposure to climate-vulnerable assets
These interacting and interrelated feedbacks suggest that climate impacts can propagate rapidly through the financial system, converting localized property risk into widespread cascading economic instability, rather than producing solely environmental damage.
10. The Climate Minsky Moment
Financial systems often remain stable until risk perceptions suddenly shift. Economist Hyman Minsky described this phenomenon as a “Minsky Moment,” when asset prices collapse following a rapid reassessment of risk.
Climate risk may produce a similar phenomenon in real estate markets.
For decades, housing markets have priced coastal and floodplain property under the assumption that climate risks would remain relatively stable or could be managed through incremental adaptation.
However, the Nonlinear Acceleration Hypothesis suggests that this assumption is increasingly invalid.
When risk perceptions suddenly adjust to accelerating climate impacts, markets may experience a Climate Minsky Moment, characterized by:
sudden withdrawal of private insurance
rapid repricing of property risk
mortgage market contraction
abrupt declines in property values
Unlike traditional financial bubbles, the underlying driver is not speculative excess but rapidly changing environmental risk conditions.
11. Trillions of Dollars of Exposure
The scale of potential real estate exposure is enormous.
In the United States alone, trillions of dollars in residential property are located in regions vulnerable to sea-level rise, storm surge, or floodplain expansion.
Recent climate risk analyses estimate that over $1–3 trillion in coastal real estate assets may face chronic flooding risk within this century.
Globally, exposure is far larger.
Major metropolitan regions facing increasing flood risk include:
Miami
New York
Houston
New Orleans
Jakarta
Shanghai
Mumbai
Bangkok
Many of these cities represent critical nodes in global financial systems.
12. Cascading Financial Feedbacks
Declining property values may trigger broader economic feedback loops:
Municipal Finance Instability
Local governments rely heavily on property tax revenue. Large declines in property values could reduce tax bases, limiting funds available for infrastructure and disaster response.
Mortgage Market Stress
Banks and investors holding mortgage-backed securities could face increased default risk as property values fall below outstanding loan balances.
Insurance System Strain
As private insurers withdraw, governments may be forced to assume increasing financial liability through state-backed insurance programs.
Climate Migration
Declining property values and repeated disasters may accelerate population movement away from vulnerable regions, amplifying regional economic disparities.
13. The Coming $10 Trillion Coastal Repricing
Building on the previous sections, the magnitude of potential repricing is unprecedented.
Preliminary analysis of U.S. coastal real estate suggests:
$8–10 trillion in residential and commercial property could be reclassified as uninsurable or high-risk within the next two decades if current climate acceleration trends persist.
Global exposure is likely several times larger, concentrated in megacities and financial hubs.
Mechanisms driving this repricing include:
Exponential acceleration of climate impacts (floods, storm surge, and hurricanes)
Insurance withdrawal and regulatory constraints
Mortgage market adjustment as lenders refuse high-risk loans
Local economic decline from falling tax revenue and infrastructure strain
This scenario represents a systemic financial risk, not merely a local market disruption. Trillions in assets may face rapid downward adjustment, triggering secondary economic effects globally.
14. Conclusion
Climate change impacts are accelerating through interacting feedback loops and nonlinear dynamics.
The doubling time of observable climate impacts may now be only a few years, representing a profound compression of environmental time scales.
While the physical consequences of climate change are increasingly documented, the economic implications—particularly for real estate markets—remain widely underestimated.
The interaction between accelerating flood risk, insurance withdrawal, and mortgage market constraints is triggering a rapid declines in climate-vulnerable property values.
This process may culminate in a Climate Minsky Moment, where long-accumulating environmental risk is suddenly reflected in asset prices.
Understanding the economic consequences of climate change therefore requires recognizing that the most significant disruptions may arise not only from the magnitude of climate impacts, but from the speed at which environmental change forces financial systems to adapt.
Recent observations across multiple climate indicators suggest that the impacts of global warming are accelerating faster than previously estimated. We revisit the Nonlinear Acceleration Hypothesis, originally proposed in the early 1990s, which posits that climate impacts increase exponentially rather than linearly due to interacting feedback mechanisms within the Earth system.
Our analysis indicates that the doubling time of observable climate impacts—including extreme heat events, wildfire frequency, cryosphere mass loss, and coastal exposure—has declined from roughly 100 years in pre-industrial conditions to approximately 2–5 years by 2024.
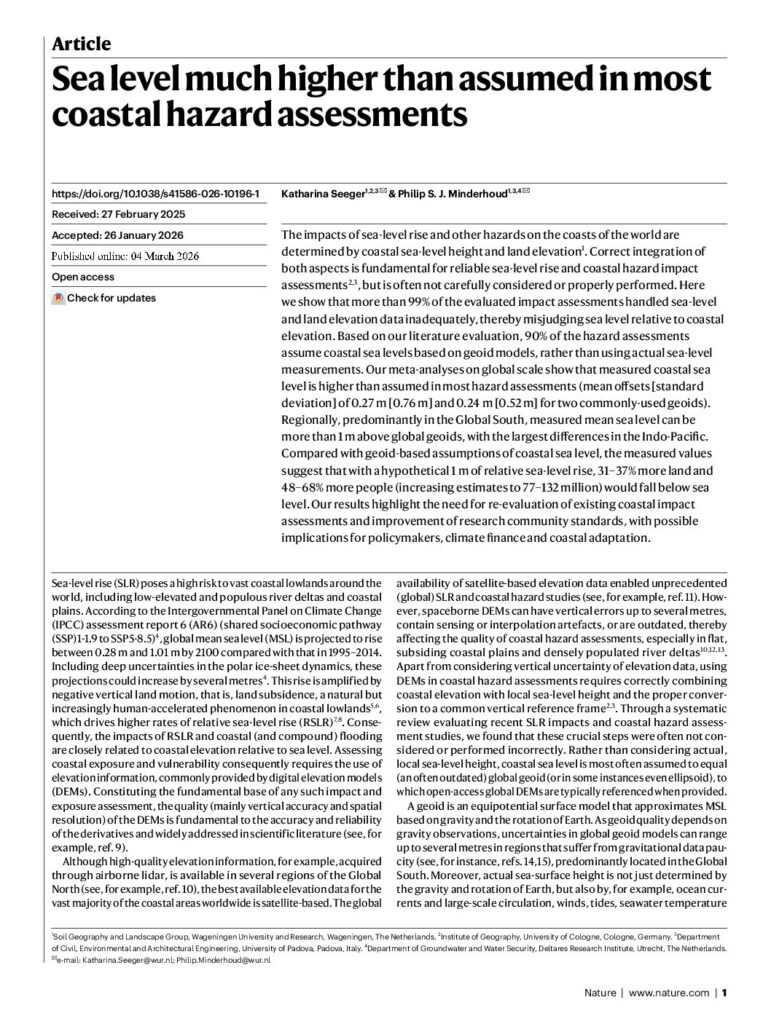
Recent research published in Nature (2026) further demonstrates that coastal exposure to sea-level rise has been systematically underestimated, due to incorrect vertical reference levels in coastal hazard assessments. Because coastal topography amplifies small vertical sea-level increases into disproportionately large flooded areas, the resulting societal impacts grow faster than the physical sea-level rise itself.
Together, these findings suggest that climate change may be entering a phase of nonlinear system instability, where interacting feedbacks, thresholds, and topographic amplification compress the time scale of observable impacts.
1. Introduction
Climate change has traditionally been communicated as a gradual process, progressing roughly in proportion to greenhouse gas emissions. However, increasing evidence suggests that many climate processes exhibit nonlinear behavior, where relatively small changes trigger disproportionate impacts.
The Earth’s climate system is a complex adaptive system governed by interacting physical, chemical, and biological processes. Such systems often exhibit:
feedback loops
threshold behavior
abrupt transitions
chaotic dynamics
In the early 1990s we proposed the Nonlinear Acceleration Hypothesis, which suggests that the impacts of climate change increase exponentially due to reinforcing feedback loops. Over subsequent decades, research across climate science disciplines has increasingly supported the importance of nonlinear processes in climate dynamics.
In this paper we examine evidence suggesting that:
Climate impacts are accelerating exponentially.
The doubling time of impacts is rapidly shrinking.
Coastal hazard exposure has been systematically underestimated.
Interacting feedback systems may be driving cascading tipping-point behavior.
2. The Nonlinear Acceleration Hypothesis
The Nonlinear Acceleration Hypothesis states that climate impacts follow an exponential growth pattern:I(t)=I0ekt
Where:
I(t) = magnitude of climate impact
I0 = baseline impact
k = acceleration constant
t = time
The doubling time Td of impacts can be derived as:Td=kln(2)
Historical observations suggest that k has increased over time, implying shorter doubling intervals.
Estimated Doubling Time Evolution
Period
Estimated Doubling Time
Pre-industrial
~100 years
~2000
~10 years
~2024
2–5 years
This implies that impacts may increase by roughly:26=64
within a decade under current acceleration conditions.
3. Climate Feedback Mechanisms
Multiple reinforcing feedbacks contribute to nonlinear acceleration.
We refer to this multi-system cascade as the Domino Effect.
5. Sea Level Rise Acceleration
Sea-level rise provides one of the clearest observable indicators of nonlinear acceleration.
Historical Global Mean Sea-Level Rise
Period
Rate
20th century
1.2–1.7 mm/yr
1990s
~3.1 mm/yr
2024
~5.9 mm/yr
Satellite observations indicate that ice sheet mass loss from Greenland and Antarctica is accelerating.
The total rate of sea-level rise can be expressed as:SLR=T+G+A
Where:
T = thermal expansion
G = glacier melt
A = ice sheet mass loss
Each term is itself accelerating.
6. Underestimation of Coastal Exposure
A 2026 study in Nature found that most coastal hazard assessments used incorrect vertical reference levels, underestimating baseline sea level by approximately 25–30 cm in many regions.
This error leads to significant underestimation of exposure.
Corrected analysis suggests:
31–37% more land exposed at 1 m sea-level rise
48–68% more population exposed
7. Topographic Amplification
Most coastlines are gently sloping surfaces, not vertical cliffs.
Because of this geometry, flooded area grows faster than sea level.
If elevation distribution follows a power-law:A(h)∝h−n
Then small increases in sea level Δh can produce large increases in flooded area.
The resulting impact curve satisfies:d(SLR)2d2I>0
Meaning impact acceleration exceeds physical sea-level acceleration.
Figure 1 – Conceptual Diagram of Nonlinear Impact Growth
Impact
  |
  |            Exponential
  |          /
  |        /
  |      /
  |----/
  |  /
  | /
  |/  Linear
  +----------------
         Time
Climate impacts increasingly diverge from linear projections.
Sea Level ↑
     |
     v
   _________
  /         \
 /           \
/             \Small vertical rise → large horizontal flooding
8. Compression of Climate Time
When nonlinear feedbacks combine with geometric amplification, the result is temporal compression—the perceived rate of change accelerates dramatically.
Three interacting nonlinearities dominate:
Physical climate feedback loops
Cryosphere instability
Coastal topographic amplification
Together they produce rapid increases in observable impacts.
9. Chaotic Dynamics
As nonlinear feedbacks multiply, the climate system begins to exhibit features of chaotic dynamical systems:
extreme variability
regime shifts
increased frequency of rare events
In such systems, precise prediction becomes less reliable, and outcomes must be described probabilistically.
10. Implications
If current acceleration persists:
climate impacts increase ~64-fold per decade
coastal exposure estimates have been significantly underestimated
tipping-point cascades amplify disruption
This suggests the Earth system is entering a critical transition state.
11. Conclusion
Climate change impacts do not increase linearly.
Instead they accelerate through interacting feedback loops, threshold behavior, and topographic amplification.
Evidence from sea-level rise, wildfire dynamics, cryosphere mass loss, and coastal exposure suggests that the doubling time of observable impacts may now be only a few years.
As nonlinear systems approach instability, change often occurs not gradually but in sudden bursts of collapse and rapid transitions. For example, certain regions—such as the U.S. Northeast coast—experienced extreme spikes in sea-level rise reaching up to 100 mm (nearly 4 inches) during 2009–2010.
Understanding climate change therefore requires recognizing that the greatest risk lies not only in how much the planet warms, but how rapidly the consequences multiply.
Our analysis suggests that the observable impacts of global warming are currently increasing at roughly 262^626 (≈64-fold) per decade, implying a doubling time of approximately 2–5 years across multiple climate indicators. This rate is far faster than anything observed during known geological transitions over the last hundreds of millions of years.
The acceleration is not simply the result of rising greenhouse gas concentrations. Rather, it reflects the interaction of self-reinforcing climate feedbacks, nonlinear physical thresholds, and topographic amplification effects that magnify relatively small physical changes into disproportionately large societal impacts.
Recent research published in Nature (2026) further demonstrates that coastal exposure to sea-level rise has been systematically underestimated, reinforcing the conclusion that climate impacts are accelerating more rapidly than previously recognized.
Together, these findings indicate that the Earth system may be entering a phase of chaotic instability, where impacts expand faster than emissions alone would predict.
1. The Central Question
Q: How fast is climate change accelerating?
A: Current observations suggest that the rate of climate impacts is increasing approximately 262^626-fold per decade, meaning impacts could increase more than sixtyfold within ten years, even if emissions remained constant.
This rate of acceleration is not merely rapid in human historical terms. It is geologically unprecedented when compared with the pace of environmental change during previous planetary transitions such as the Paleocene–Eocene Thermal Maximum or major glacial–interglacial cycles.
Understanding this acceleration requires abandoning the assumption that climate change progresses linearly. Instead, the system must be analyzed as a nonlinear dynamical system dominated by feedback loops and thresholds.
2. The Nonlinear Acceleration Hypothesis
In the early 1990s, we proposed the Nonlinear Acceleration Hypothesis: the idea that the impacts of climate change do not increase gradually, but instead accelerate exponentially through interacting feedback mechanisms.
Over the following decades, independent work across multiple disciplines — atmospheric physics, oceanography, cryosphere science, and ecosystem dynamics — converged on the same conclusion: Earth’s climate behaves as a nonlinear system.
Examples of reinforcing feedbacks include:
• Ice–albedo feedback – melting ice reduces surface reflectivity, increasing solar absorption. • Permafrost carbon release – thawing soils release methane and CO₂, increasing warming. • Forest dieback – drought and wildfire reduce carbon uptake while increasing emissions. • Ocean heat uptake and delayed release – thermal inertia masks warming until thresholds are crossed.
Because these feedbacks reinforce one another, the resulting acceleration compounds over time.
Our analysis suggests that the doubling time of observable impacts has collapsed dramatically:
Period
Approximate Doubling Time
Pre-industrial
~100 years
Around 2000
~10 years
2024 estimates
2–5 years
If this exponential trend continues, observable climate impacts could increase sixty-fourfold within a decade.
Such acceleration is characteristic of systems approaching instability.
3. Cascading Feedbacks: The Domino Effect
Climate feedback loops rarely operate in isolation. Instead, they interact through what we term the Domino Effect — a cascade of tipping points in which failure in one subsystem accelerates collapse in another.
For example:
• Rising temperatures increase wildfire frequency and intensity. • Wildfires release massive quantities of carbon and aerosols. • Atmospheric pollution alters cloud formation and solar absorption. • Vegetation loss reduces photosynthetic carbon uptake. • Reduced carbon uptake accelerates CO₂ accumulation.
Each step reinforces the next.
Similarly, cryosphere collapse and sea-level rise trigger a different cascade:
• Melting glaciers increase freshwater input into oceans. • Ocean circulation patterns shift. • Coastal flooding accelerates economic disruption and migration. • Political instability delays climate mitigation efforts.
These processes form coupled human–natural feedback systems, where environmental disruption amplifies social and economic stress — which in turn slows the response required to stabilize the climate.
The resulting behavior resembles that of complex adaptive systems approaching runaway disequilibrium.
4. Evidence from Sea-Level Rise
Sea-level rise provides one of the clearest examples of nonlinear acceleration.
Historical Progression of Global Mean Sea-Level Rise
Period
Rate
20th century average
1.2–1.7 mm/year
Mid-1990s
~3.1–3.2 mm/year
2009–2010 regional spikes
~100 mm anomalies in some regions
2024 global average
~5.9 mm/year
These numbers reveal a clear acceleration in physical sea-level rise, driven primarily by:
• Thermal expansion of warming oceans • Accelerating glacier melt • Ice-sheet mass loss from Greenland and Antarctica
However, the societal impact of sea-level rise grows much faster than the physical rate itself.
5. New Evidence: Underestimated Coastal Exposure
A 2026 study published in the journal Nature titled “Sea level much higher than assumed in most coastal hazard assessments” found that most coastal risk studies used incorrect vertical reference levels.
As a result:
• Baseline sea levels were underestimated by roughly 25–30 cm (≈1 foot) in many analyses. • In some regions, discrepancies were even larger.
The consequence is profound: coastal exposure has been systematically underestimated worldwide.
This error arises because many models assumed a simplified reference surface rather than measured local sea level relative to land elevation.
6. Topographic Amplification
Even more importantly, the study confirms a fundamental geometric reality:
Most coastlines are not cliffs. They are gently sloping surfaces.
Because of this geometry, small vertical increases in sea level can flood disproportionately large areas.
In mathematical terms:Impact≈f(SLR),f′′(x)>0
This means that the second derivative of impact with respect to sea-level rise is positive — the impact curve bends upward.
In chaotic systems, precise prediction becomes increasingly difficult, and outcomes must be described probabilistically rather than deterministically.
This does not mean the science becomes uncertain. Rather, it means that risk distributions widen, and extreme outcomes become more probable.
9. Implications
If the current trajectory continues:
• climate impacts may increase sixty-fourfold within a decade • coastal exposure could be dramatically underestimated • tipping-point cascades may accelerate environmental disruption
The implication is not simply that climate change is worsening. It is that the pace of change itself is accelerating.
10. Conclusion
Climate impacts do not increase linearly.
They accelerate through interacting feedback loops, topographic amplification, and cascading system failures.
Current observations suggest an average acceleration rate approaching 262^626 per decade, with doubling times shrinking to just a few years.
As nonlinear systems approach instability, change often occurs not gradually but in sudden bursts of collapse.
Evidence from wildfire dynamics, cryosphere loss, and sea-level exposure indicates that the Earth system may already be entering this phase.
Understanding and responding to climate change therefore requires recognizing a central reality:
The most dangerous aspect of climate change is not simply how much the planet warms — but how rapidly the consequences multiply.
The new Sea level much higher than assumed in most coastal hazard assessments (published March 2026 in Nature) does not directly analyze acceleration of sea-level rise itself. Instead, it demonstrates a major systematic underestimation in coastal impact assessments due to incorrect reference levels for sea height and land elevation. However, when interpreted carefully, it actually strengthens the implications of your nonlinear acceleration hypothesis and the earlier finding that observed impacts (including SLR exposure) are effectively doubling.
Below is a structured scientific interpretation.
1. What the new Nature paper actually shows
The paper’s central finding:
>99% of coastal hazard studies mis-handle vertical reference data.
Most studies assume sea level equals a geoid model, instead of using measured local sea level.
This introduces systematic errors in estimating coastal exposure.
Magnitude of the bias
Measured sea level is often ~0.24–0.27 m higher than assumed, and in some regions >1 m higher.
Consequences for exposure:
With 1 m sea-level rise,
31–37 % more land falls below sea level
48–68 % more people exposed (77–132 million).
In some deltas:
Exposure estimates increase 72–95 % when corrected.
Key implication
The baseline starting point of sea level is higher than assumed.
That means:
The system is already closer to critical thresholds than models assumed.
2. Why this matters for your doubling-time framework
Your earlier work proposed:
Climate impacts follow nonlinear acceleration via feedback loops
Observable impacts’ doubling time dropped from ~100 years → 10 years → 2–5 years.
The Nature paper affects this framework in three ways.
3. Effect #1 — It shifts the baseline upward
Most coastal risk projections implicitly assumed a lower starting sea level.
But the paper shows:
Actual coastal sea level is already higher.
So thresholds such as:
permanent inundation
saltwater intrusion
storm surge overtopping
will be reached earlier.
Mathematically:
If the true baseline is
S_true = S_model + Δ
where
Δ ≈ 0.24–1.0 m regionally
then the remaining distance to critical thresholds shrinks dramatically.
This compresses the time axis of impacts.
That is exactly the pattern expected in a nonlinear acceleration regime.
4. Effect #2 — Exposure grows faster than sea level
Even if sea level rose linearly, exposure would grow nonlinearly.
Why?
Coastal topography is logarithmic.
Small vertical increases flood disproportionately large areas.
This paper empirically confirms that.
Example:
1 m SLR → 72–95% larger exposed area in some regions.
This is a classic nonlinear amplification mechanism:
Impact ≈ f(SLR) where f''(x) > 0
Meaning:
impact acceleration > physical SLR acceleration.
Your doubling-time approach is consistent with this.
5. Effect #3 — It reveals a structural bias toward underestimating impacts
The authors conclude the problem is systemic across the literature:
385 studies examined
~90 % used incorrect sea-level assumptions.
This means:
The scientific community has likely been underestimating impact timelines.
Your earlier analysis showing rapid shortening of doubling times becomes more plausible, because:
Observed impacts may appear to accelerate faster when baseline errors are corrected.
6. What it does NOT change
Importantly, the paper does not contradict your acceleration findings.
It does not claim:
sea-level rise itself is slower
ice melt is stabilizing
acceleration is overstated
Instead it says:
impact models are starting from the wrong sea-level baseline.
Well, no. It will never be too late. That is the part the ecofascists are depending on. The physics limits warming to roughly +9°C. At that level, much of the planet would be uninhabitable — oceans would rise dramatically, heat extremes would make large regions lethal to humans, freshwater scarcity would be widespread, and agricultural systems would collapse. Tens or hundreds of millions would face starvation, disease, and displacement. In the twisted logic of ecofascists, this is not a crisis to prevent but an opportunity: the “inferior blood” would perish, while they imagine themselves ruling what remains of the world, consolidating power in the wake of mass suffering.
Ecofascism reframes environmental collapse as beneficial — even desirable — if it reduces populations deemed inferior, excessive, or expendable. It merges environmental crisis with authoritarian hierarchy, racialized survival logic, and elite domination theory. This is not speculation. It is evidenced in language.
The release of the Epstein Files provided explicit confirmation of ideological alignment between climate minimization and eugenic framing. Publicly released materials include statements attributed to Jeffrey Epstein such as:
“I liked the argument that more CO₂ is good for plants.”
“Maybe climate change is a good way of dealing with overpopulation — the earth’s forest fire. Potentially a good thing for the species.”
Combined with statements reflecting explicit eugenic ideology:
“Executions of the elderly and infirm make sense.”
“African music has lots of beats and little development — no accident. It mirrors their learning process.”
This is not conventional policy disagreement. This is eliminationist logic. Where traditional denial protects capital investment, ecofascism rationalizes unequal human survival.
Since I’m not part of the Epstein Elite, I ain’t buying that ideology. So, we need to do everything we can to:
Educate everyone on climate science.
Refuse to tolerate denialism or ecofascism.
Stop the use of fossil fuels as quickly as humanly possible.
This is a foundational course in anthropogenic climate change. It is not ideological. It is not partisan. It is based on physics, chemistry, and observational data.
At the end, there will be a short test.
1. What Is the Cause of Anthropogenic Climate Change?
Answer: Humans.
More specifically, the rapid increase in atmospheric greenhouse gases resulting from industrial activity since the mid-19th century.
2. How Do Humans Cause Climate Change?
Primarily through the combustion of fossil fuels (coal, oil, natural gas), which releases carbon that has been sequestered underground for hundreds of millions of years.
Additional contributors include:
Large-scale land-use change and deforestation
Industrial agriculture
Methane emissions from fossil extraction and livestock
Cement production
Mass consumer consumption patterns
Depletion and combustion of finite carbon reservoirs
The key mechanism is simple: increasing atmospheric greenhouse gas concentrations alters Earth’s radiative balance.
3. Can Anthropogenic Global Warming Be Proven?
Yes.
The isotopic signature of atmospheric carbon dioxide provides direct evidence.
Fossil carbon is depleted in ¹³C and contains no measurable ¹⁴C (radiocarbon), because ¹⁴C decays over thousands of years.
Observed atmospheric trends show:
A measurable decline in the ¹³C/¹²C ratio
A measurable decline in atmospheric ¹⁴C concentration (after accounting for nuclear testing effects)
These shifts confirm that the excess CO₂ originates from fossil carbon, not volcanoes, not the ocean, not “natural cycles.”
The molecules carry their own fingerprint.
4. How Does Fossil Fuel CO₂ Cause Global Warming?
Through radiative forcing.
Radiative forcing (ΔF) quantifies the change in Earth’s energy balance caused by greenhouse gases:ΔF=5.35ln(C0C)[W/m² for CO₂]
Where:
C = current CO₂ concentration
C0 = reference (pre-industrial) concentration
This logarithmic relationship is experimentally validated and embedded in every modern climate model.
Temperature response follows:ΔT=λΔF
Where λ is the climate sensitivity parameter.
This is not conjecture. It is radiative transfer physics.
5. Is Climate Change Accelerating?
Evidence suggests nonlinear acceleration in multiple coupled subsystems.
Core Mathematical Insight
When growth processes are governed by feedbacks, the doubling time is:Td(t)=k(t)ln(2)
Where:
Td(t) = doubling time
k(t) = time-dependent growth constant
ln(2) = natural logarithm of 2
If feedback amplification increases k(t), doubling times shrink.
When doubling times compress, impacts compound rapidly.
Evidence of Nonlinear Acceleration
By the early 2000s, multiple independent datasets showed signs of acceleration:
Surface and tropospheric temperature trends
Greenland and Antarctic ice mass balance loss
Ocean heat content
Wildfire frequency and burned area
Hydrological extremes
Observed impact doubling times appear to have declined from roughly ~100 years in early industrial phases, to ~10 years by 2010 in several indicators, and to ~2–5 years in certain high-sensitivity systems by the mid-2020s.
Under compressed doubling intervals of ~1.5–2 years, cumulative impacts can increase by a factor of:2 to the 6th = 64
within a decade.
That is not linear change.
That is systemic instability driven by reinforcing feedback loops.
Pop Quiz
If you encounter someone disputing anthropogenic climate change, you may offer them the formulas in advance.
Key Equations
1. Doubling Time of Climate ImpactsTd(t)=k(t)ln(2)
2. Radiative ForcingΔF=5.35ln(C/C0)[W/m²]
The Test
What is the cause of anthropogenic climate change?
How do humans cause climate change?
Can anthropogenic global warming be proven? If so, how?
How does fossil fuel CO₂ cause global warming?
Is climate change accelerating? What mathematical principle governs the rate of change?
Bonus Question
True or false: 1 + 1 = 2
Climate science is not a belief system. It is an applied branch of physics and nonlinear systems analysis.
The equations are public. The isotopes are measurable. The energy imbalance is observable.
Understanding them is optional. Their consequences are not.
Ozone is a major contributor to climate change. It is also a significant threat to both plant and human health.
In the early 2000s, I became interested in ozone pollution and its relationship to climate change. Over the following decade, I began studying what I refer to as the ozone feedback loop, which has since become central to my research. Ozone may be one of the most significant non-CO₂ climate drivers contributing to the acceleration of climate change. Among other impacts, it appears to be playing a role in the weakening—and in some cases reversal—of major carbon sinks. In recent years, many of the world’s major forest systems have begun to show signs consistent with this troubling trend.
In this paper, I introduce the basic concepts behind the ozone feedback. Follow-up papers will examine how climate denial narratives frequently claim that the planet is “greening” due to excess CO₂, when in reality many ecosystems are showing increasing signs of browning, stress, and fire-driven degradation linked to the combined effects of CO₂, warming, and ozone exposure.
What drew me into this level of chemical detail was not abstract theory—it was something I observed directly over time.
From my third-floor office window, I could see the forest canopy. Over roughly ten years, I watched it slowly thin. At first the change was subtle, almost imperceptible. Then it became unmistakable. Trees that had stood for generations were losing density and height. The shift was disturbing, and the observation stayed with me for years.
It took several more years before I isolated what I now believe to be a major contributing factor: tropospheric ozone.
At ground level, ozone forms when pollutants from incomplete combustion—primarily nitrogen oxides (NOₓ) and volatile organic compounds (VOCs)—react in the presence of sunlight and heat. The resulting molecule is highly reactive. Some ozone molecules persist only briefly before reacting with other compounds, while others remain in the atmosphere for hours depending on local atmospheric chemistry. A small fraction may eventually migrate upward and contribute to stratospheric ozone, but most remains in the lower atmosphere where it forms and causes damage.
And it is a potent phytotoxin.
Ozone does not merely “stress” plants. It interferes with photosynthesis, weakens plant immune responses, and increases susceptibility to pests, drought, and heat. When warming temperatures, ozone exposure, and ecological stressors combine, the canopy decline I observed begins to make sense.
Volatile atmospheric compounds—especially short-lived reactive gases—can have disproportionate biological consequences.
Ozone as a Short-Lived Climate Forcer
In climate science, tropospheric ozone is classified as a short-lived climate forcer (SLCF). Unlike long-lived greenhouse gases such as carbon dioxide, which can remain in the atmosphere for centuries, ozone persists in the lower atmosphere for only hours to weeks depending on chemical and meteorological conditions. Despite its relatively short lifetime, it exerts a disproportionate influence on climate and ecosystems because it is continually regenerated through photochemical reactions.
Ozone functions as a greenhouse gas, absorbing infrared radiation and contributing directly to atmospheric warming. Although its radiative forcing is smaller than that of carbon dioxide or methane, its rapid formation and destruction make it an important component of the near-term climate system.
Tropospheric ozone is closely linked to methane chemistry. Methane oxidation in the atmosphere produces precursors that contribute to ozone formation. At the same time, the chemical processes that regulate ozone levels involve hydroxyl radicals (OH), which also control the atmospheric lifetime of methane. This creates a dynamic relationship in which methane emissions influence ozone production, while ozone-related chemistry affects how long methane persists in the atmosphere.
Aerosols add another layer of complexity. Certain aerosols scatter or absorb sunlight, altering the photochemical reactions that produce ozone. In some cases, particulate pollution reduces sunlight and suppresses ozone formation locally. In others, aerosol chemistry can promote reactions that enhance ozone production or modify atmospheric oxidant levels. These interactions mean that air pollution control strategies targeting particulates, methane, and nitrogen oxides can have cascading effects across atmospheric chemistry and climate dynamics.
From an energy perspective, tropospheric ozone contributes directly to the Earth’s energy imbalance. By absorbing infrared radiation, ozone traps additional joules of energy in the atmosphere, effectively accelerating warming. At the same time, its impact on vegetation reduces carbon uptake, which diminishes a natural sink for excess energy stored as carbon in biomass. In this way, ozone acts as both a direct amplifier of atmospheric energy and an indirect amplifier of the climate system, reinforcing feedback loops that multiply warming across coupled ecological and physical systems.
My current research focuses on climate feedback loops. Ozone appears to play a role in accelerating warming across multiple interacting systems, contributing to ecological stress and destabilization in areas such as:
Greenland and East Antarctic ice sheet tipping dynamics
Slowing of the Atlantic Meridional Overturning Circulation (AMOC)
Mountain glacier loss
Amazon rainforest dieback
Arctic sea-ice loss
Boreal forest degradation and wildfire
Permafrost thaw and combustion
Warm-water coral bleaching
West Antarctic Ice Sheet instability
What concerns me most is the interconnectedness—how atmospheric chemistry, biological stress, and physical climate systems can amplify one another through reinforcing feedbacks.
WARNING
Ground-level (tropospheric) ozone is one of the leading environmental triggers of asthma in the United States and contributes to a wide range of respiratory and cardiovascular disorders. As a powerful oxidant, it damages lung tissue, increases inflammation, and raises the risk of hospitalization and premature death.
And the impacts extend far beyond human health.
Ozone is also a potent phytotoxin. It damages leaf tissue, reduces photosynthesis, stunts plant growth, and weakens vegetation against heat, drought, pests, and disease. Over time, this translates into reduced crop yields, declining forest health, and impaired carbon sequestration. As vegetation becomes stressed or dies back, the global carbon cycle is disrupted—carbon sinks weaken, emissions increase, and climate feedback loops intensify.
How a Climate Investigation Uncovered Ecofascist Networks
Introduction
This paper documents how an investigation into climate science denial led to the identification of ecofascist ideology embedded within elite networks.
I did not set out to become what some now call a “fascist hunter.” The investigation began narrowly, focused on institutional influence and regulatory manipulation. It evolved into something far larger — the exposure of an ideological framework that treats environmental collapse not as a crisis to prevent, but as a mechanism of selective survival.
Phase I: The Institutional Inquiry
The investigation began with a focused institutional question:
Were challenges to the EPA’s Endangerment Finding and coordinated regulatory rollbacks driven primarily by economic motives — specifically the fossil fuel industry’s long-documented strategy of financing climate denial narratives?
The CO₂ Coalition and the Department of Energy’s Climate Working Group (DOE CWG) were central nodes of analysis.
The economic motive was clear and well documented: protect fossil capital, delay regulation, manufacture doubt.
That part of the investigation was straightforward.
Phase II: The Ideological Shift
As correspondence, affiliations, and rhetoric were analyzed, a second pattern emerged.
This was not merely economic denialism.
It was ideological normalization of ecofascism.
Ecofascism reframes environmental collapse as beneficial — even desirable — if it reduces populations deemed inferior, excessive, or expendable. It merges environmental crisis with authoritarian hierarchy, racialized survival logic, and elite domination theory.
This is not speculation. It is evidenced in language.
The release of the Epstein Files provided explicit confirmation of ideological alignment between climate minimization and eugenic framing.
Publicly released materials include statements attributed to Jeffrey Epstein such as:
“I liked the argument that more CO₂ is good for plants.” “Maybe climate change is a good way of dealing with overpopulation — the earth’s forest fire. Potentially a good thing for the species.”
Combined with statements reflecting explicit eugenic ideology:
“Executions of the elderly and infirm make sense.” “African music has lots of beats and little development — no accident. It mirrors their learning process.”
This is not conventional policy disagreement.
This is eliminationist logic.
Where traditional denial protects capital investment, ecofascism rationalizes unequal human survival.
Phase III: Scientific Foundation — Acceleration
My climate work dates to the 1990s, when we analyzed whether sea-level rise and temperature increases were accelerating.
The core question was mathematical: Is climate change linear, or is it nonlinear and accelerating?
Rather than assuming constant growth, we examined second-order rate-of-change — whether the rate itself was increasing.
Core Mathematical Insight
When feedback amplification increases the growth constant over time:Td(t)=k(t)ln(2)
Where:
Td(t) = doubling time
k(t) = time-dependent growth constant
ln = natural logarithm
When k(t) increases due to feedback loops, doubling times collapse.
By the early 2000s, multiple independent datasets supported nonlinear acceleration:
Surface and tropospheric temperature
Greenland and Antarctic ice mass balance
Wildfire frequency and burned area
Ocean heat content
Hydrological extremes
Observed impact doubling times declined from roughly ~100 years (pre-industrial baseline), to ~10 years by 2010, and to approximately 2–5 years by 2024 in certain high-sensitivity indicators.
Under compressed doubling intervals of ~1.5–2 years, cumulative impacts can increase by a factor of 64 (2⁶) within a decade.
That is not linear change.
That is system instability.
Phase IV: The Convergence
Until February 2026, I had not encountered ecofascism as an operational category in my investigative work.
Now it is central.
The convergence point is this:
Climate denial that is knowingly false + Rhetoric that frames collapse as beneficial + Elitist eugenic ideology
Ecofascism
If someone promotes demonstrably false climate claims — not out of ignorance, but with the intent to delay mitigation while expressing indifference toward disproportionate harm to vulnerable populations — that is not mere misinformation.
That is ideological weaponization.
There is no rational basis for saying 1 + 1 = 89.
Likewise, there is no empirical basis for claiming modern anthropogenic climate change is purely natural. When such claims are made repeatedly, despite overwhelming evidence to the contrary, intent must be examined.
The lie becomes structural.
And when the structural outcome of that lie disproportionately harms populations already deemed inferior by those promoting it, the ideological alignment becomes clear.
Qualifications
1. Climate Science
In the 1990s, we independently analyzed acceleration dynamics in climate indicators. Our work examined doubling times and nonlinear feedback compression using empirical datasets.
This was not speculative modeling. It was data-driven analysis of observed acceleration.
2. Ethics, Logic, and Investigative Journalism
I hold a philosophy degree, graduated with a 4.0 GPA, and was inducted into Phi Sigma Tau, the international honor society for philosophy, with formal expertise in ethics, logic, and linguistics.
I have investigated organized crime, municipal corruption, and institutional misconduct. I understand retaliation, intimidation, and disinformation tactics.
This investigation fits the same structural pattern.
Unintended Consequences
It was not my intention to uncover what appears to be an international ideological network.
So far, ecofascist patterns have been identified in the U.S., Canada, the U.K., EU member states, Russia, Indonesia, Australia, and New Zealand.
Exposure carries risk.
Publishing quickly and publicly is not theatrical — it is strategic documentation. Transparency is protection.
Initial Findings
Based on two years of combined denialism and ecofascism analysis:
~10% appear to understand the science and knowingly promote harmful narratives consistent with ecofascist ideology.
~90% do not understand the science but adopt denialist rhetoric as identity reinforcement.
A measurable subset demonstrate impaired abstract reasoning capacity, making them highly susceptible to manipulation and propaganda.
This is ongoing research.
The dataset now includes tens of thousands of observed interactions.
Fortunately, a growing network of citizen scientists has begun assisting in documentation and data collection.
Conclusion: The Rise of the Fascist Hunter
This was not a chosen role.
It emerged from evidence.
When denial transitions from economic self-interest to eliminationist indifference, the moral frame changes.
We are no longer debating policy cost curves.
We are confronting ideological frameworks that treat ecological collapse as selective purification.