bookmark_borderProducer Prices Surge: Tariffs and Protectionism Poised to Push Inflation Higher

The latest Producer Price Index (PPI) figures have been released—and they came in sharply above expectations. This upside surprise suggests that inflationary pressures at the wholesale level are building more quickly than many economists and market participants anticipated.

While the most recent Consumer Price Index (CPI) data showed only a modest uptick—enough to be noticed but not enough to spook markets—the PPI data paints a different picture. Producer prices often serve as a leading indicator for consumer inflation, meaning the higher costs businesses face today are likely to be passed along to consumers in the coming months.

Why This Matters

The spike in PPI isn’t happening in isolation—it’s unfolding against a backdrop of rising tariffs and protectionist trade policies. Recent and proposed tariff measures, especially those targeting imports from China, are expected to directly increase the cost of goods. These increases are compounded by tariff stacking, where multiple tariffs apply to the same product, leading to taxes on top of taxes and magnifying the inflationary impact.

For example:

  • Tariffs on imported steel and aluminum raise manufacturing costs for vehicles, appliances, and infrastructure.

  • Component-specific tariffs increase the price of intermediate goods like semiconductors, batteries, and motors.

  • Reciprocal tariffs from trading partners can disrupt supply chains and force businesses to source from higher-cost markets.

This cost pressure is already visible at the wholesale level in the PPI. As these higher costs work their way through the supply chain, the CPI is likely to follow.

Market Response So Far

Markets initially took the modest CPI increase in stride, but the PPI shock is harder to ignore. Bond yields are likely to rise as investors factor in the possibility that the Federal Reserve could keep interest rates elevated for longer—or even raise them again—to counteract the inflationary effects of protectionism-driven cost increases.

Equities could face renewed pressure, especially in industries reliant on imported goods and materials, such as automotive manufacturing, electronics, and consumer appliances. Retailers and wholesalers may also see margin compression if they are unable to pass along all the added costs to consumers without hurting demand.

The Road Ahead

If tariffs continue to expand and stack across multiple sectors, the PPI could see sustained upward pressure well into next year. This would eventually force the CPI higher, potentially rekindling inflation fears that the Fed has worked hard to tame since the post-pandemic price surge.

The takeaway?
The latest PPI data isn’t just a statistical blip—it’s a warning sign. Inflation may not be finished with us yet, and protectionist policies could be the accelerant that keeps prices climbing.

Trumpenomics: The Decline of the US

bookmark_borderAlaska’s Mendenhall Glacier Outburst: A Glacial Flood Emergency

by Daniel Brouse
August 13, 2025

A massive upstream basin of rainwater and snowmelt, dammed by Alaska’s Mendenhall Glacier, began releasing on Tuesday, prompting officials to urge residents in parts of Juneau to evacuate ahead of a potentially dangerous surge of floodwater.

The National Weather Service (NWS) Juneau office issued a flood warning for areas along the Mendenhall River near Auke Bay. The released water from this glacial outburst is flowing downstream, putting riverside homes and properties at immediate risk.

As of Tuesday afternoon local time, river levels were measured at 9.85 feet, with major flooding classified at 14 feet. Officials expect the river to crest Wednesday afternoon at near-record levels of 16.3 to 16.8 feet, setting a new historic high. NWS meteorologist Nicole Ferrin stated, “This will be a new record, based on all of the information that we have.”

The City and Borough of Juneau issued a public advisory confirming that the glacial outburst originated from Suicide Basin. Flooding is expected to continue along Mendenhall Lake and River from late Tuesday through Wednesday. Residents in areas at risk are strongly encouraged to evacuate immediately. A Red Cross shelter is open at Floyd Dryden Gymnasium (3800 Mendenhall Loop Road). Important notices for pet owners: The Red Cross shelter cannot accommodate pets. Evacuated animals should be taken to Juneau Animal Rescue at (907) 789-6997. Safety warning: Do not approach the river. Floodwaters are extremely dangerous, and entering the area endangers both residents and first responders. Stay away from the river to allow safe evacuations and emergency response efforts.

Ignite a Domino Effect: Albedo, Brown Carbon, AMOC, Permafrost, Amazon Rainforest Dieback, Sea Level Rise Pulses, Hydroclimate Whiplash, and Arctic Sea Ice 

Tipping points and feedback loops drive the acceleration of climate change. When one tipping point is toppled and triggers others, the cascading collapse is known as the Domino Effect.

bookmark_borderTariffs Fail to Tame Soaring U.S. Budget Deficit as Spending Outpaces Revenue

by Daniel Brouse
August 13, 2025

The U.S. government’s budget deficit surged nearly 20% in July 2025, reaching $291 billion for the month, despite a sharp rise in customs duty collections from President Donald Trump’s aggressive tariff policies. According to Treasury Department data released Tuesday, the deficit increase underscores that tariffs — often touted as a revenue tool — are not offsetting the broader fiscal pressures caused by rising federal spending and mounting debt interest costs.

Compared with July 2024, the deficit swelled by $47 billion, marking a 19% year-over-year jump. Receipts for the month grew modestly, up 2% ($8 billion) to $338 billion, driven in part by a nearly threefold increase in customs duties — from $7 billion a year ago to almost $21 billion in July 2025. This spike reflects the impact of steep tariff hikes on a wide range of imported goods from countries such as China, India, Brazil, and Canada. Tariffs are nothing more than a hidden tax on consumers — and this marks the largest effective tax increase in U.S. history.

However, federal outlays surged even more sharply, climbing 10% ($56 billion) to a record $630 billion for July — the highest monthly spending for that month in U.S. history. A major contributor was the escalating burden of interest payments on the growing national debt, which now consumes an ever-larger share of the budget.

For the fiscal year to date, the budget deficit has already topped $1.6 trillion, putting the U.S. on track for one of its largest annual deficits outside of a recession or major war. Debt servicing costs continue to climb as higher interest rates compound the burden of an already massive national debt.

The July data highlight a core reality of protectionist economic policy: tariffs are a regressive tax on consumers and businesses, raising prices while failing to meaningfully close the deficit gap. Instead of curbing borrowing, the Trump administration’s trade war has added complexity to supply chains, dampened export markets through retaliatory tariffs, and stoked inflationary pressures — all while doing little to address the structural drivers of U.S. debt.

Economists warn that without serious reforms to both revenue generation and spending control, the U.S. risks a cycle of mounting deficits, rising interest costs, and eroding investor confidence — an economic trajectory that could weaken America’s fiscal resilience for decades to come.

Trumpenomics: The Decline of the US

bookmark_borderEvaporation: Death by Corn Sweat

by Daniel Brouse and Sidd Mukherjee
August 10, 2025

Introduction: Observing a Vanishing Pool

I’ve been researching evaporation for decades, but sometimes the most telling experiments happen in my own backyard. At the start of this pool season, rainfall far exceeded evaporation. Then, for the past two months, the balance flipped: with little rain and intense heat, the pool lost about 10 inches of water solely from evaporation. This small observation mirrors what’s happening globally — a shift toward higher net water loss as temperatures climb.

The 2003 Invention: Cooling Through Evaporation

In 2003, I invented Solar Powered Climate Control: Energy Transfer Through Evaporation. The idea was simple: collect rainwater and drip it over the roof on hot days. As the water evaporated, it absorbed heat from the structure, removing massive amounts of energy from the building.

When water evaporates, it transitions from liquid to vapor, a phase change that requires a huge energy input. In our experiments, Sidd calculated:

“For every cubic foot of water that evaporated, it took 61,000 BTU with it.”

The results were remarkable: my electric bill dropped by two-thirds. Back then, I saw evaporation as a potential climate solution. Now, I see how climate change itself is supercharging evaporation — and in ways that can harm as much as help.

The Physics of Evaporation

Evaporation is among the most powerful natural cooling mechanisms on Earth. The latent heat of evaporation, L, measures the energy required to transform water into vapor without changing its temperature:

  • L = 8,094 BTU per gallon

  • 1 BTU = 1,055 Joules

  • 1 calorie raises the temperature of 1 gram of water by 1°C

  • Levaporation = 536 calories/gram

This means that even small amounts of evaporating water move massive amounts of energy from the surface into the atmosphere — energy that doesn’t just disappear, but fuels storms and weather extremes.

Climate Change and Evaporation’s Double-Edged Sword

Evaporation cools surfaces locally, but globally it adds more water vapor to the atmosphere. According to the Clausius-Clapeyron equation, for every 1°C increase in temperature, air can hold about 7% more water vapor. In regions of the U.S. that are experiencing +10°C seasonal anomalies, the atmosphere can now hold about 70% more water vapor than in the past.

This fuels several dangerous trends:

  • Stronger storms — The extra moisture is energy for hurricanes, atmospheric rivers, and severe thunderstorms.

  • More intense rainfall — Raindrops are becoming larger and faster, increasing their momentum (p = mv). Higher drop count per second boosts total impact force.

  • Flash flood severity — With more raindrops falling at higher velocities, momentum and destructive power increase significantly.

  • Erosion & soil degradation — Heavy rains strip away topsoil, reducing agricultural capacity.

Flow Dynamics: Scaling Forces with Climate Change

The drag equation shows that force increases with the square of velocity and is proportional to fluid density. This means:

  • Doubling wind speed quadruples its force.

  • Water is ~800× denser than air, so water flow at the same speed exerts ~800× the force of wind.

As climate change drives higher wind and water speeds, the destructive potential grows exponentially. A modest increase in velocity can translate into catastrophic increases in force — toppling trees, collapsing infrastructure, and scouring soil.

Evaporation, Drought, and the Feedback Loop

Warming oceans — particularly in the tropics — are releasing increasing amounts of water vapor into the atmosphere. Atmospheric rivers transport this moisture and energy inland, fueling more intense rainfall events.

On land, rising temperatures are accelerating evaporation from both plants and soil. By 2025, “corn sweat” had even entered weather forecasts. This term refers to the large amounts of water vapor released by corn plants through transpiration—the process by which plants draw water from their roots, move it up through the stalk, and release it into the air from tiny pores in their leaves.

A mature cornfield can release several thousand gallons of water per acre per day into the atmosphere during peak growing season. The effect is so pronounced that meteorologists now factor corn sweat into heat index forecasts for states like Iowa, Illinois, and Nebraska.

While this moisture can increase local humidity to dangerous levels for people, it’s also a sign of stress for the plants themselves. High heat and increased transpiration can sap soil moisture, reduce yields, and inflict economic losses across agricultural regions already strained by climate change.

But here’s the climate “whiplash” problem:

  • More extreme rainfall events lead to floods, soil loss, and infrastructure collapse.

  • More extreme droughts follow because warmer air strips moisture from the ground faster, especially when relative humidity remains low despite higher absolute humidity.

As soil moisture evaporates away, ecosystems degrade. Once soil structure collapses, desertification can set in — a feedback loop that is much harder to reverse than to prevent.

From My Pool to the Planet

Measuring the water loss in my swimming pool is straightforward. Measuring the net evaporation of the Earth’s soils, forests, and croplands is far more complex — but the trend is clear. Net evaporation is rising. Precipitation is becoming more extreme but also less reliable. Soil degradation is accelerating.

What began as an experiment in using evaporation to mitigate heat now reveals a stark reality: climate change is pushing evaporation into a new role as a driver of instability.

Soil Degradation and Desertification
The Rapid Acceleration of Soil Degradation and Desertification Part II
The Converging Collapse: AMOC, Jet Streams, and Deadly Wet-Bulb Temperatures
Climate Change and Deadly Humid Heat
Burning to Stay Cool: How Our Fight Against Heat Is Fueling Climate Collapse
Solar Powered Climate Control: Energy Transfer Through Evaporation
Understanding Urban Heat Islands: Causes, Data, and Climate Context
Ignite a Domino Effect: Albedo, Brown Carbon, AMOC, Permafrost, Amazon Rainforest Dieback, Sea Level Rise Pulses, Hydroclimate Whiplash, and Arctic Sea Ice

The Human Induced Climate Change Experiment

bookmark_borderWhat Happens If the AMOC Stops?

by Daniel Brouse
August 10, 2025

The AMOC (Atlantic Meridional Overturning Circulation) is one of the planet’s most important climate engines, moving warm water from the tropics northward and sending cold, dense water back south at depth. It’s also deeply intertwined with a giant climate feedback loop — the kind that can trigger sudden, far-reaching changes once certain thresholds are crossed.

If the AMOC slows or stops, the effects won’t be uniform, and they certainly won’t be simple. Models suggest that in North America, especially the Northeastern United States, winters could turn brutally cold, even as summers become hotter than ever. While some wonder whether sea ice might return to the Arctic under these conditions, it’s unlikely. The intensity of summer heat in a warming world would still prevent the reformation of stable, long-lasting ice cover.

Europe’s Outlook
For Europe, the story changes with geography — and the result is a continent split between chill and scorch:

  • Northwestern Europe (UK, Scandinavia, northern France, Germany): Colder, stormier winters with shorter growing seasons and more frequent severe winter weather events.

  • Southern Europe (Spain, Italy, Balkans): Drier and hotter overall, with summer heatwaves growing even more extreme.

  • Eastern Europe: Alternating between harsh winter cold snaps and scorching summer heat, making seasonal predictability far more difficult.

Stormier Skies and Unstable Patterns
One of the most disruptive consequences of an AMOC collapse would be the atmospheric chaos it unleashes. Jet stream patterns could warp and meander, fueling stronger, more frequent winter storms barreling in from the Atlantic, while southern regions face prolonged drought.

Not an Ice Age — But a Roller Coaster
Despite colder winters in the north, this isn’t a return to the last glacial period. Rising greenhouse gas concentrations will still push global temperatures upward, offsetting some of the cooling. Instead, Europe could face a highly unstable climate — bitterly cold and stormy in the north, scorching and drought-prone in the south — a seasonal whiplash that challenges agriculture, infrastructure, and ecosystems alike.

Ignite a Domino Effect: Albedo, Brown Carbon, AMOC, Permafrost, Amazon Rainforest Dieback, Sea Level Rise Pulses, Hydroclimate Whiplash, and Arctic Sea Ice

The Human Induced Climate Change Experiment

bookmark_borderSudden Sea Level Pulses: How “Cork Release” Events Could Rapidly Reshape Coastlines

by Daniel Brouse
August 9, 2025

Greenland Subglacial Flood Sheds Light on a Dangerous Climate Feedback

The Earth’s climate system is a tightly woven network of interdependent processes. Disturb one, and you risk setting off a cascade of reinforcing feedback loops. Consider just one example: the potential collapse of the Atlantic Meridional Overturning Circulation (AMOC).

When the AMOC slows, tropical waters grow hotter while the Arctic warms even faster. This accelerates polar ice melt, raising global sea levels more quickly and injecting vast amounts of freshwater into the North Atlantic. The added freshwater disrupts ocean salinity and density, further weakening the AMOC in a dangerous feedback cycle.

Meanwhile, elsewhere in the system, Amazon droughts intensify under the altered climate, pushing the rainforest toward dieback and eventual desertification. This reduces the Amazon’s ability to recycle rainfall and sequester carbon, further amplifying global warming—and thus accelerating ice melt, sea level rise, and AMOC destabilization.

The Albedo Effect and Ice Melt

One of the most powerful feedbacks in the polar regions is the albedo effect. As bright, reflective ice melts, it reveals darker land or ocean surfaces that absorb far more solar energy. This speeds up further melting. While melting sea ice mainly changes heat balance without directly raising sea levels, the melting of land-based ice—especially from Greenland and Antarctica—not only raises global seas but also changes ocean salinity and temperature, further destabilizing circulation systems like the AMOC.

These ice sheets hold vast “corks” of land ice restraining enormous reservoirs of meltwater. When these corks break, sudden sea level rise pulses—sometimes 1–3 feet per year for multiple consecutive years—could occur. The impacts on coastlines, global weather, and ocean currents would be both severe and unpredictable.

The Greenland Ice Sheet Outburst Flood

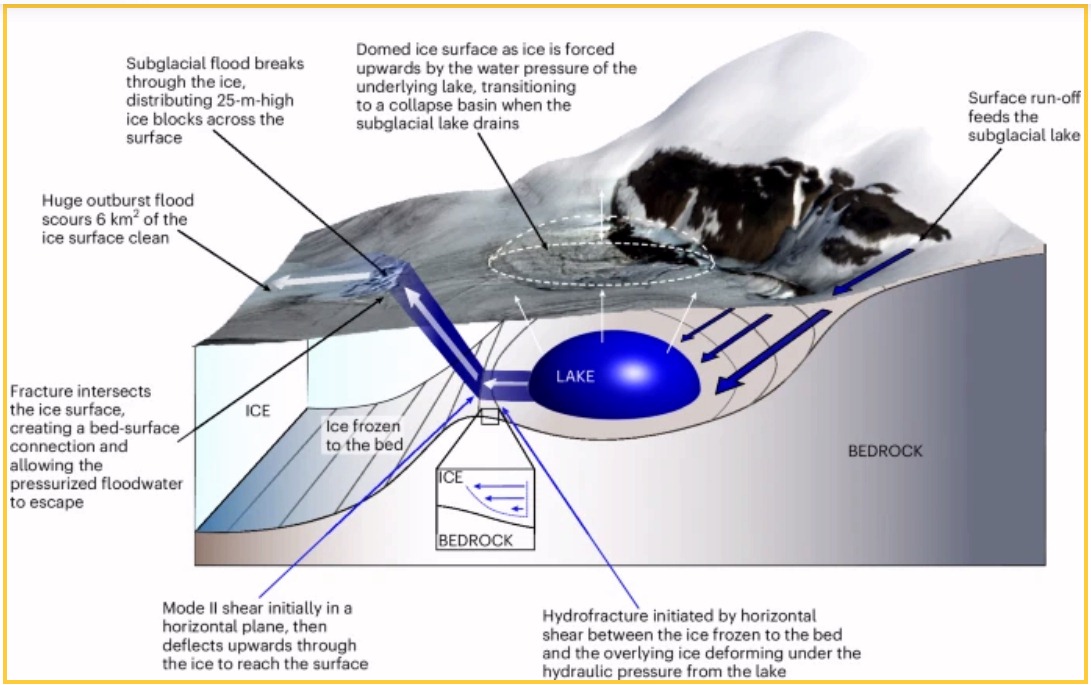
Recent research has identified a startling example of this process. In the paper Outburst of a subglacial flood from the surface of the Greenland Ice Sheet (2025), scientists documented a 90-million-cubic-meter flood that forced its way upward through the ice sheet, bursting out at the surface. This was caused by the rapid drainage of a subglacial lake in a region where the bed was thought to be frozen solid—an event that current ice sheet models do not account for.

The flood’s upward path fractured the ice sheet, disrupting the downstream marine-terminating glacier and altering its flow. This bi-directional coupling between surface and basal hydrology highlights just how complex—and poorly understood—ice sheet dynamics truly are.

Over the last three decades, Greenland has lost roughly 169 billion tons of ice per year on average, contributing about 14 mm to global sea level rise. Roughly half of this loss comes from surface melting and runoff, which are projected to increase sharply as Arctic warming intensifies.

Why This Matters

If hydrofracture events like this outburst become more frequent, the world could face abrupt, multi-foot-per-year sea level jumps—not the gradual rise most models currently project. This would leave little time for adaptation in coastal cities and could unleash profound economic, humanitarian, and ecological consequences.

Current ice sheet models typically treat meltwater movement as predictable and gradual. The Greenland event shows that under certain conditions, trapped subglacial water can build enough pressure to fracture ice and erupt at the surface—what could be called a “cork release” event. These sudden failures are not fully understood, but they could represent one of the most dangerous tipping points in the cryosphere.

Understanding and integrating these processes into predictive models is urgent. The more we learn, the more it becomes clear that the climate system is capable of abrupt, nonlinear shifts—far faster than human infrastructure, economies, or governance can adapt.

Ignite a Domino Effect: Albedo, Brown Carbon, AMOC, Permafrost, Amazon Rainforest Dieback, Sea Level Rise Pulses, Hydroclimate Whiplash, and Arctic Sea Ice Brouse and Mukherjee (2025)

The Human Induced Climate Change Experiment

bookmark_borderThe Hidden Tax: How Rising Tariffs Harm the U.S. Economy and Burden Everyday Americans

As of August 7, 2025, the effective average U.S. tariff rate on imported goods and services has surged to approximately 22.38%. Historically, that number has hovered around 2.5%, reflecting decades of relatively free trade and open global markets. This abrupt increase represents not only a dramatic reversal of U.S. trade policy, but also the single largest tax hike in American history—and the most regressive, hitting working- and middle-class families the hardest.

While the rhetoric behind tariffs often focuses on “protecting American jobs” and “punishing unfair trading partners,” the reality is that protectionism inflicts long-term economic damage that far outweighs any short-term political gains.

How Protectionism Hurts the Economy

1. Higher Consumer Prices
Tariffs function as taxes on imported goods. When a 25–50% tariff is imposed on imports from countries like China, India, Brazil, or even long-time allies like Canada and the EU, U.S. companies either pass the added costs directly to consumers or reduce quality and choice. From automobiles and appliances to clothing, electronics, and groceries, everyday goods become more expensive. This disproportionately affects low-income households, which spend a higher percentage of their income on essentials.

2. Supply Chain Disruptions
Modern supply chains are global. Components for a single product may come from a dozen countries. By erecting tariff barriers, the U.S. disrupts these intricate supply chains, forcing businesses to reshuffle suppliers, reengineer products, or absorb losses—all of which increase costs and reduce efficiency.

3. Retaliatory Tariffs, Boycotts, and the Rise of Anti-American Sentiment

Other countries don’t stand idle in the face of U.S. protectionism. History shows that aggressive tariff policies almost always provoke retaliatory tariffs on American exports, which directly harms key sectors of the U.S. economy—particularly agriculture, manufacturing, and services. During previous trade wars, American farmers lost critical access to international markets, resulting in surplus crops, falling commodity prices, and the need for multi-billion-dollar taxpayer-funded bailouts to offset the damage.

But today, the consequences extend well beyond formal trade retaliation.

A growing number of consumers and businesses abroad are engaging in informal economic retaliation through boycotts. As the United States becomes increasingly viewed as economically combative and diplomatically unreliable, anti-American sentiment is rising. In many countries, people are intentionally avoiding U.S.-made products, U.S.-based services, and even U.S. tech platforms, choosing alternatives from Europe, Asia, or domestic providers.

This backlash is especially damaging given that the U.S. is no longer a manufacturing-based economy, but a service-based economy, heavily reliant on exports of financial services, technology, entertainment, education, and tourism. In sectors like film, software, consulting, and higher education, global reputation is currency—and that currency is being rapidly devalued by confrontational trade policies and erratic diplomacy.

Tourism is also being affected. Once a top global destination, the U.S. has seen significant declines in international travel, in part due to tightened visa policies, but increasingly because of growing distaste for the U.S.’s international behavior. Millions of potential visitors—who would have spent money in American hotels, restaurants, stores, and attractions—are now choosing to travel elsewhere.


4. Reduced Investment and Innovation
When trade barriers rise, investor confidence falls. Businesses hold off on expansion, hiring, or investing in new technologies if they’re uncertain about future access to foreign markets. Protectionism stifles the very dynamism that drives long-term growth and productivity.

The Regressive Nature of Tariffs

Unlike income taxes, which scale with earnings, tariffs are blind to income. A billionaire and a minimum-wage worker both pay more for a smartphone, a car, or a gallon of milk due to import duties. This makes tariffs a regressive tax, one that widens inequality by placing a heavier burden on those least able to afford it.

A Historic Mistake Repeated

We’ve seen this before. The Smoot-Hawley Tariff Act of 1930, passed in the early days of the Great Depression, raised tariffs on thousands of imports. Other nations retaliated, world trade collapsed, and the Depression deepened. Economists overwhelmingly agree that protectionist trade policy worsened global economic conditions during that period.

Now, nearly a century later, the U.S. is making the same mistake—again under the banner of economic nationalism. The long-term consequences could be severe: slower growth, weakened competitiveness, strained international relations, and a lower standard of living for American families.

In Summary:
A 22.38% average tariff rate is not a shield for American jobs—it’s a self-inflicted tax that increases costs, fuels inflation, restricts growth, and disproportionately hurts the average person. History, logic, and data all tell us the same thing: protectionism doesn’t protect—it punishes.

In short, the economic cost of protectionism isn’t just higher prices or lost trade—it’s a damaged global reputation, leading to long-term losses in consumer trust, market access, and global influence.

Reciprocal Tariffs

Brazil

50%

India

50%

Syria

41%

Laos

40%

Myanmar (Burma)

40%

Switzerland

39%

Canada

35%

Iraq

35%

Serbia

35%

Algeria

30%
   

Bosnia and Herzegovina

30%

China

30%

Libya

30%

South Africa

30%

Brunei

25%

Kazakhstan

25%

Mexico

25%

Moldova

25%

Tunisia

25%

Bangladesh

20%
   

Sri Lanka

20%

Taiwan

20%

Vietnam

20%

Cambodia

19%

Indonesia

19%

Malaysia

19%

Pakistan

19%

Philippines

19%

Thailand

19%

Nicaragua

18%
   

Afghanistan

15%

Angola

15%

Bolivia

15%

Botswana

15%

Cameroon

15%

Chad

15%

Costa Rica

15%

Côte d`Ivoire

15%

Democratic Republic of the Congo

15%

Ecuador

15%
   

Equatorial Guinea

15%

European Union

15%

Fiji

15%

Ghana

15%

Guyana

15%

Iceland

15%

Israel

15%

Japan

15%

Jordan

15%

Lesotho

15%
   

Liechtenstein

15%

Madagascar

15%

Malawi

15%

Mauritius

15%

Mozambique

15%

Namibia

15%

Nauru

15%

New Zealand

15%

Nigeria

15%

North Macedonia

15%
   

Norway

15%

Papua New Guinea

15%

South Korea

15%

Trinidad and Tobago

15%

Turkey

15%

Uganda

15%

Vanuatu

15%

Venezuela

15%

Zambia

15%

Zimbabwe

15%
   

Falkland Islands

10%

United Kingdom

10%

Other Tariffs
An average of an additional 50% on most goods from China

Aluminum 50%
Steel 50%
Copper 50%
Autos 25%

Trumpenomics: The Decline of the US

bookmark_borderUnderstanding Urban Heat Islands: Causes, Data, and Climate Context

by Daniel Brouse
August 7, 2025

Urban heat islands (UHIs) are a well-documented phenomenon in which cities and densely developed areas experience significantly higher temperatures than surrounding rural environments. This temperature disparity is not the result of long-term climate change, but rather of localized factors that alter how heat is absorbed, stored, and released.

The Albedo Effect and Surface Materials

At the core of the UHI effect is the albedo effect—the ability of a surface to reflect or absorb solar energy. Natural landscapes, such as forests and grassy fields, typically reflect more sunlight and also benefit from evaporative cooling due to moisture in the soil and vegetation. In contrast, urban environments are dominated by low-albedo surfaces such as asphalt, concrete, and dark rooftops, which absorb large amounts of solar radiation during the day and slowly release that heat at night.

This shift in surface composition dramatically alters local energy balances. Measuring direct solar irradiance and surface reflectivity (albedo) is essential for assessing how much thermal energy is being retained in a given environment.

Traffic and Heat Pollution from Vehicles

Another often-overlooked contributor to urban heating is thermal pollution from internal combustion engine (ICE) vehicles. Cars, trucks, and buses release significant heat as a byproduct of fuel combustion—only about 25–30% of the fuel’s energy is converted into mechanical power, while the rest is dissipated as waste heat. In areas with dense traffic and limited airflow, this heat can accumulate, compounding the effects of surface absorption.

As cities continue to struggle with traffic congestion, this vehicular heat output becomes a growing contributor to localized temperature increases, especially in poorly ventilated areas like urban canyons or below-grade roadways.

The Role of Wind in Heat Distribution

Wind patterns are equally important in shaping the urban thermal landscape. Wind speed and direction influence how heat and pollutants are dispersed or trapped. In calm or low-wind conditions, heat can become confined, especially in dense cityscapes where tall buildings disrupt natural air circulation. This can lead to pockets of intense warmth, poor air quality, and discomfort for residents.

On the other hand, steady wind flow can help moderate temperatures by promoting convective cooling and enhancing the evaporation of surface moisture. Therefore, including real-time wind data is vital for any comprehensive study of urban temperature dynamics.

Humidity and Evaporation

Humidity and evaporation play a crucial role in regulating local temperatures, especially in the context of urban heat islands (UHIs). Here’s a detailed explanation of why these processes matter—and just how powerful evaporative cooling is compared to surfaces that don’t evaporate moisture:

Why Evaporation and Humidity Matter

Evaporation is a phase-change process that absorbs large amounts of energy from the environment. When water evaporates from soil, vegetation, or water bodies, it draws heat from the surrounding air and surfaces, thereby cooling them down. This is known as latent heat flux—the energy absorbed during evaporation is stored in the water vapor as “latent heat” and removed from the surface without raising its temperature.

Humidity, or the amount of water vapor in the air, affects the potential for further evaporation. In dry environments, evaporation happens rapidly, enhancing cooling. In contrast, when humidity is high, the air is closer to saturation and evaporation slows, reducing this cooling effect.

How Much Energy Does Evaporation Use? (Compared to Non-Evaporative Surfaces)

To understand the power of evaporation, consider this key fact:

 It takes about 2,260 kJ (or 540 kcal) to evaporate 1 kilogram (1 liter) of water at 100°C.

This is five times more energy than what’s needed to heat that same amount of water from 0°C to 100°C (which takes only 418 kJ or 100 kcal).

Let’s compare:

Process Energy Dissipated
Heating 1 kg of water by 1°C 4.18 kJ
Heating 1 kg from 0°C to 100°C 418 kJ
Evaporating 1 kg of water 2,260 kJ (5.4× more)

Now compare this to non-evaporative surfaces like asphalt or metal roofs, which do not use energy to evaporate water. Instead, nearly all the incoming solar radiation is converted to sensible heat, which raises the surface and ambient air temperature.

This means that in green or moist landscapes (lawns, trees, wetlands), much of the solar energy goes into evaporation rather than heating, while in dry, impervious urban areas, it goes directly into warming the environment.

The Urban Green Advantage

  • Vegetated areas (lawns, trees, wetlands) act like natural air conditioners.

  • On a hot summer day, a single large tree can evaporate over 100 liters of water, dissipating over 225,000 kJ of heat—enough to offset the heat output of several cars.

  • Green roofs and permeable surfaces further enhance evaporation, providing localized cooling benefits.

Bottom Line

Evaporation is an energy-intensive process that removes heat from surfaces and air, dramatically reducing urban temperatures. In contrast, dry, impermeable surfaces only reflect or absorb heat, contributing to the intensity of the urban heat island effect.

Incorporating more water-retaining surfaces, vegetation, and green infrastructure into urban planning is one of the most effective ways to dissipate solar energy through evaporation rather than allowing it to accumulate as heat.

Integrating Data for Smarter Models

To fully understand and predict UHI behavior, researchers must integrate a variety of environmental data sources, including:

  • Solar radiation and surface reflectivity

  • Traffic patterns and vehicle density

  • Wind speed and direction

  • Surface temperature and humidity levels

  • Vegetative cover and soil moisture

Such an integrated approach allows for more accurate modeling of localized weather effects and offers insights into how city design, land use, and transportation infrastructure influence microclimates.

Urban Heat Islands vs. Climate Change

It’s critical to differentiate between urban heat islands and global climate change. While UHIs are driven by local factors and fluctuate with development patterns, climate change is a planetary-scale phenomenon linked to rising greenhouse gas concentrations, oceanic and atmospheric changes, and long-term warming trends.

UHIs do not cause global warming—but they do amplify its effects locally, making cities more vulnerable to heatwaves, public health crises, and increased energy demand for cooling.

Toward Resilient Urban Design

Understanding UHIs is not just a scientific exercise—it has practical implications for city planners, architects, and policymakers. Mitigation strategies include:

  • Using high-albedo roofing and paving materials

  • Expanding urban tree canopies and green spaces

  • Installing green roofs and reflective surfaces

  • Reducing ICE vehicle traffic through public transit and electrification

  • Designing cities that facilitate natural airflow

By incorporating environmental data into planning and design, we can build cities that are not only cooler and more comfortable but also more resilient to the larger threats posed by climate change.

Solar Powered Climate Control: Energy Transfer Through Evaporation
The Human Induced Climate Change Experiment

bookmark_borderBreathing in Danger: The Health Crisis of Air Pollution and How to Protect Yourself

by Daniel Brouse
August 6, 2025

Over the past several years, extreme air pollution events have become alarmingly common across the United States and beyond. If you’ve been noticing hazy skies, itchy eyes, or difficulty breathing, you’re not alone—and you’re not imagining things. With increasingly frequent wildfires, industrial emissions, and fossil fuel combustion, the air we breathe is becoming more dangerous by the day.

In these conditions, checking your home’s air purification systems is not just advisable—it’s essential. The list of diseases and health disorders linked to poor air quality is long and alarming. According to the World Health Organization, the following have all been directly associated with exposure to airborne pollutants:

  • Respiratory and cardiovascular diseases: asthma, bronchitis, COPD, emphysema, pneumonia, strokes, and heart attacks

  • Neurological and developmental impacts: Alzheimer’s disease, dementia, impaired brain development in children, cognitive decline

  • Cancers and systemic illnesses: lung cancer, liver disease, kidney disease, gastrointestinal disorders, and reproductive harm

  • Skin and eye damage: cataracts, dry eyes, corneal inflammation, permanent vision damage, and various skin diseases

  • Immune system dysfunction: increased susceptibility to infections and autoimmune disorders

  • Premature death: due to heart, lung, and systemic organ failure

Eye Irritation and Vision Loss

One of the most immediate effects of poor air quality is eye irritation. Short-term symptoms include burning, itching, dryness, blurred vision, watery eyes, and sensitivity to light. Long-term exposure to airborne particulates—especially PM2.5 and ozone—has been linked to chronic inflammation of the eyes, conjunctivitis, corneal abrasion, and even degenerative conditions such as cataracts and macular degeneration, which can lead to irreversible vision loss.

Particulate matter and chemical pollutants can accumulate in the tear film and on the surface of the eye, leading to persistent inflammation and oxidative stress. These conditions are especially dangerous for those with preexisting eye issues or contact lens wearers.

Eye Protection During Pollution Events

To reduce your risk:

  • Avoid going outside during high AQI events, especially when AQI is above 100.

  • Wear wraparound protective eyewear or sealed goggles if you’re outdoors for extended periods.

  • Use lubricating eye drops (artificial tears) to flush out irritants and relieve dryness.

  • Avoid rubbing your eyes, which can worsen inflammation and increase the risk of infection.

  • Indoors, maintain good air filtration to reduce indoor pollutants that can irritate your eyes.

Air Quality Maintenance and Indoor Protection

To protect your lungs and heart, clean or change your HVAC and air conditioner filters every two weeks, especially during high-pollution events. Better yet, use air purification units with HEPA filters or build your own Corsi-Rosenthal Box for a low-cost, high-efficiency solution.

What Is Particulate Matter?

The U.S. Environmental Protection Agency (EPA) defines particulate matter (PM) as a mixture of solid particles and liquid droplets suspended in the air. These particles range in size from visible dust and soot to microscopic toxins that can only be seen with an electron microscope. PM2.5—the finest and most dangerous type—can penetrate deep into your lungs, bloodstream, and even your eyes.

Breathing particle-laden air is comparable to smoking cigarettes. On days with an Air Quality Index (AQI) in the “Unhealthy” range, simply breathing can be as harmful as smoking a half-pack of cigarettes per day. Engaging in physical activity outdoors can magnify this damage, potentially reaching the equivalent of two packs a day.

The Cumulative Effect

The more particulate matter you inhale—or absorb through the eyes or skin—the greater your risk. Vulnerable populations—such as children, the elderly, and those with preexisting conditions—face an even higher danger. Long-term exposure increases the odds of strokes, heart disease, cancer, dementia, and chronic lung damage.

However, there’s hope. Just like quitting smoking reduces health risks over time, limiting your exposure to pollution can significantly lower your chance of developing serious complications.

Prevention: The Best Medicine

Here are key steps to take:

  • Avoid outdoor exercise on days with an AQI over 50.

  • On moderate to poor air quality days, wear an N95 mask and protective eyewear when outside.

  • Indoors, use HEPA purifiers or build a Corsi-Rosenthal Box—a DIY air purifier made from a box fan and high-efficiency filters. It is more affordable and, in many cases, more effective than commercial air purifiers.

How to Build a Corsi-Rosenthal Box

The Corsi-Rosenthal Box is an innovative, community-designed air filter that uses MERV-13 filters arranged in a cube with a box fan mounted on top. It’s a highly effective and inexpensive way to reduce indoor particle pollution. You can build one at home for under $100 with simple materials available at most hardware stores.

Build and run a Corsi-Rosenthal Box filter.

Final Thoughts

Air pollution is not just a distant environmental concern—it is an active and worsening public health emergency. From vision loss to heart failure, its reach is systemic and deadly. In the absence of meaningful political leadership on air quality, it is crucial for individuals and families to take personal protective action.

If you’re breathing—or seeing—today, you have a reason to act.

Health Impacts of Air Pollution
Build a Corsi-Rosenthal Box filter
Indoor Air Pollution: How to Purify the Air, Aromatic Plants, and Phytoncides

The Human Induced Climate Change Experiment

bookmark_borderTariffs, Hypocrisy, and Geopolitical Backfire: Trump Slaps 50% Tariffs on Indian Goods Over Russian Oil

In a move that is already sparking backlash among global trade experts and U.S. allies, former President Donald Trump has issued a directive to impose an additional 25% tariff on a wide array of Indian goods—raising the total tariff rate to 50%. This decision, according to Trump, is a response to India’s ongoing purchases of oil from Russia, despite the global push to isolate the Kremlin economically due to its actions in Ukraine.

But the rationale behind this punitive measure appears deeply flawed and hypocritical. The United States itself continues to import Russian commodities, most notably palladium, a rare and strategically important metal used in catalytic converters for gasoline-powered cars. Fertilizer components and other essential minerals from Russia are also still entering U.S. markets through direct or indirect channels.

India, on the other hand, has consistently argued that its purchases of Russian oil are both legal under international law and necessary to ensure energy security for its 1.4 billion citizens. Indian officials have questioned the sensibility and fairness of U.S. trade policy, pointing out the double standard at play. Why should India be punished for buying oil, while the U.S. continues trading in Russian metals essential for its fossil fuel economy?

More broadly, this action raises serious questions about U.S. strategic coherence, economic independence, and long-term competitiveness. If the U.S. truly wants to reduce reliance on Russian imports, the logical path forward is to accelerate the transition away from internal combustion engine (ICE) vehicles—which would reduce the need for palladium entirely. In that sense, India’s critique is not just diplomatic posturing; it highlights a genuine lack of economic sensibility in America’s reactive, ad hoc tariff policy.

The new 50% tariff could significantly disrupt U.S.–India trade relations, which had been steadily improving, and potentially alienate an important ally in the Indo-Pacific region. It also introduces unnecessary inflationary pressure at a time when the U.S. economy is already grappling with rising prices, job market cooling, and growing fears of stagflation.

At its core, this tariff escalation appears more about political optics than economic logic. Unfortunately, global markets and working families may once again bear the brunt of short-sighted, inconsistent trade policy.


The Human Induced Climate Change Experiment

Trumpenomics: The Decline of the US