Michigan State University’s technology sounds amazing because it can turn almost any window into a power generator. However, there’s an inherent trade-off: allowing light to pass through the window means not absorbing the visible energy needed to generate electricity, which limits energy efficiency.
What may be even more promising are “balcony” solar panels. These systems can plug into existing outlets and feed electricity directly into a home, making solar generation possible without installing a traditional rooftop system. They’re becoming increasingly popular around the world.
Unfortunately, in the U.S., some utilities and regulatory policies are restricting or limiting their use.
Solar shingles have also been developed as an alternative to conventional rooftop solar panels. However, they have struggled to gain widespread market acceptance because integrating the solar technology into the roof can make it difficult to provide the same 20–30-year roofing warranty and long-term durability that traditional roofing systems can offer. The lack of a long-term guarantee can also make it more difficult to obtain the necessary homeowners insurance and mortgage approval, potentially creating complications when it comes time to sell the home.
This also applies to traditional rooftop solar panels. Solar panels do not replace the underlying roofing system, and replacing a roof after solar panels have been installed can be prohibitively expensive because the panels typically have to be removed and reinstalled.
In addition, some rooftop solar companies advertise “free installation,” but the homeowner may not actually own the system. Instead, the company retains ownership and places the homeowner under a long-term lease or power-purchase agreement. These agreements can complicate the sale of the property because the solar contract may need to be transferred to the buyer or paid off before the transaction can close.
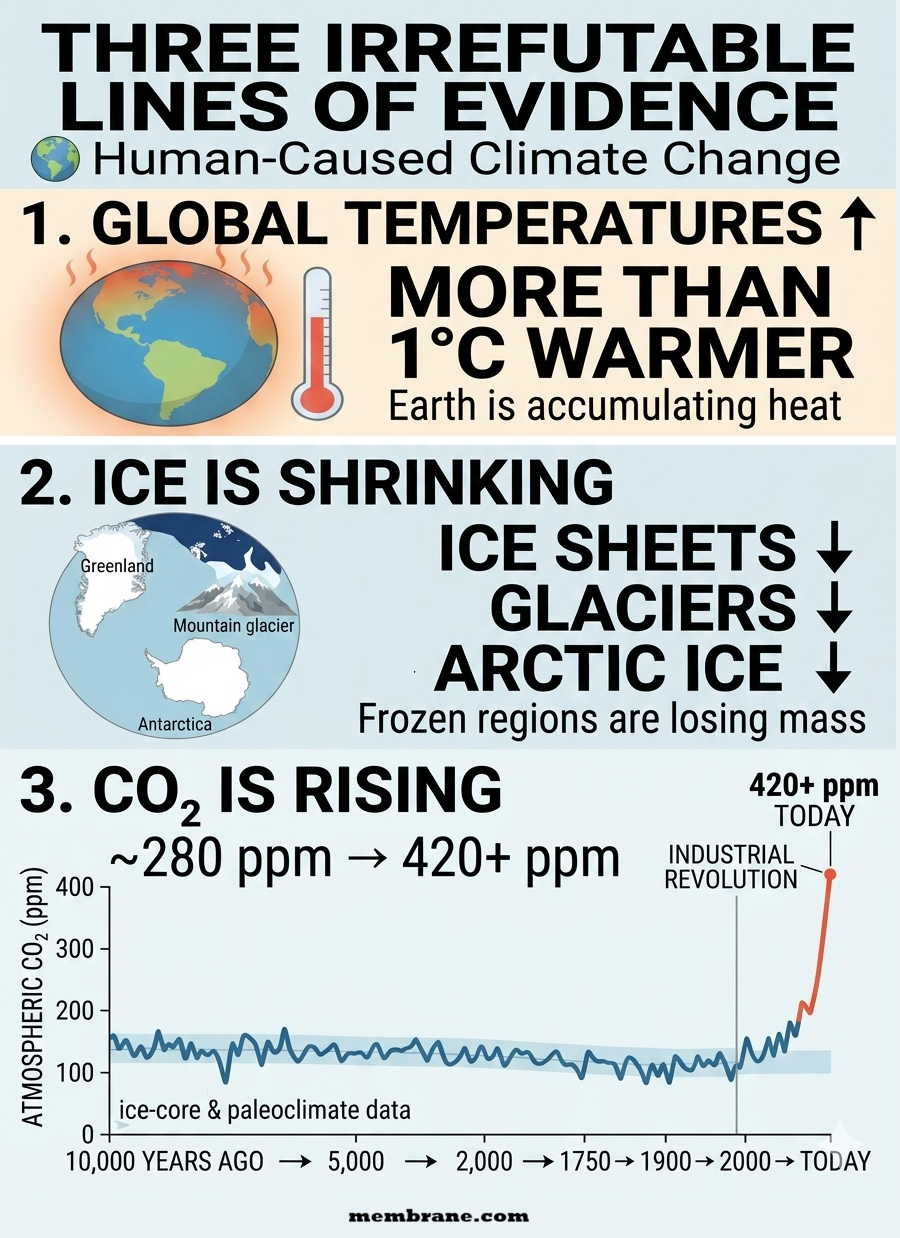
The evidence for human-caused climate change does not rest on a single temperature record, computer model, or scientific study. It comes from multiple independent lines of evidence that converge on the same conclusion.
Three of the clearest are rising global temperatures, shrinking ice sheets and glaciers, and rapidly increasing atmospheric carbon dioxide (CO₂) with a chemical fingerprint linked to fossil fuels.
Each observation is significant on its own. Together, they provide an exceptionally strong scientific case that human activities—especially the burning of coal, oil, and natural gas—are driving the modern warming of Earth’s climate.
1. Rising Global Temperatures
Earth’s average surface temperature has increased by more than 1°C since the late 19th century, with the great majority of that warming occurring since the mid-20th century.
The warming is occurring across the planet and is not limited to the atmosphere. The oceans are absorbing most of the excess heat accumulating in Earth’s climate system, resulting in rising ocean heat content and increasing sea-surface temperatures.
This broad pattern is exactly what scientists expect from an atmosphere increasingly enriched with heat-trapping greenhouse gases.
The evidence also extends beyond simple surface-temperature measurements. Changes in ocean heat, atmospheric temperatures, nighttime temperatures, seasonal patterns, and other components of the climate system independently demonstrate that Earth is undergoing sustained warming.
The planet is not merely experiencing a few unusually hot years. The entire climate system is accumulating heat.
2. Shrinking Ice Sheets, Glaciers, and Arctic Sea Ice
Earth’s frozen regions provide another powerful and highly visible record of climate change.
Greenland and Antarctica are losing ice mass. Glaciers are retreating in nearly every major mountain region, including the Alps, Himalayas, Rockies, Andes, and Alaska. Meanwhile, Arctic sea ice has declined substantially in both extent and thickness.
These changes matter because ice responds directly to changes in the climate system.
When temperatures rise persistently, glaciers retreat and ice sheets lose mass. As snow and ice disappear, darker land and ocean surfaces are exposed, allowing them to absorb more solar energy rather than reflecting it back into space. This creates an important ice-albedo feedback that can amplify warming.
The geographical reach of the changes is particularly important. Ice loss is not occurring at one isolated location. Multiple independent ice systems around the world are responding to a warming planet.
The retreat of glaciers, loss of polar ice, declining Arctic sea ice, and shrinking seasonal snow cover all point in the same direction.
3. Rising Atmospheric CO₂ and the Fossil-Fuel Fingerprint
Perhaps the most direct evidence of human influence comes from the atmosphere itself.
Before industrialization, atmospheric carbon dioxide concentrations were approximately 280 parts per million (ppm). Today, concentrations have risen to more than 420 ppm—an enormous increase occurring over a period far shorter than the natural changes that produced comparable atmospheric concentrations in the distant past.
But the evidence goes beyond simply measuring more CO₂.
Scientists can identify where the additional carbon is coming from.
The carbon added to the atmosphere has an isotopic signature consistent with carbon released from ancient organic material, including coal, oil, and natural gas. Atmospheric oxygen measurements and other observations provide additional evidence that fossil-fuel combustion is responsible for a substantial portion of the increase.
Human activities are therefore not merely occurring at the same time as rising CO₂. We can trace the additional carbon to its source.
And CO₂ has a well-established physical mechanism for affecting climate: it absorbs outgoing infrared radiation, reducing the amount of heat that escapes to space. Increasing its concentration strengthens the atmosphere’s greenhouse effect and produces warming.
Three Independent Signals—One Consistent Explanation
The strength of the evidence comes from the fact that these observations are connected but independently measurable:
Temperatures are rising. Ice is shrinking. CO₂ is increasing—and its chemical fingerprint identifies a major human source.
The observations also extend beyond these three indicators. Rising ocean heat, changing atmospheric circulation, shifting precipitation patterns, increasing ocean acidity, and numerous other changes are consistent with a planet responding to increased greenhouse-gas concentrations.
The critical point is that no single observation has to carry the entire argument.
If global temperatures were rising without increasing greenhouse gases, the explanation would be incomplete.
If atmospheric CO₂ were increasing without a corresponding physical mechanism for warming, the explanation would be incomplete.
If temperatures were rising while glaciers, ice sheets, and Arctic sea ice showed no response, the explanation would be incomplete.
Instead, the evidence converges.
The Climate Fingerprint
The modern climate system displays a coherent pattern:
Human activity increases greenhouse gases → greenhouse gases trap additional heat → Earth’s climate system accumulates energy → global temperatures rise → ice melts and glaciers retreat → oceans warm and expand → additional climate feedbacks amplify the changes.
This is not evidence based on one measurement or one institution. It is a conclusion supported by physics, atmospheric chemistry, temperature records, ocean measurements, satellite observations, glacier surveys, ice-sheet measurements, and paleoclimate evidence.
The overwhelming convergence of these independent observations makes the central conclusion extraordinarily robust:
Earth is warming, the warming is occurring across the climate system, atmospheric greenhouse gases are rising because of human activity, and the resulting enhanced greenhouse effect is driving the modern warming.
The evidence is not merely suggestive.
It is convergent, measurable, physically explainable, and unmistakably human-driven.
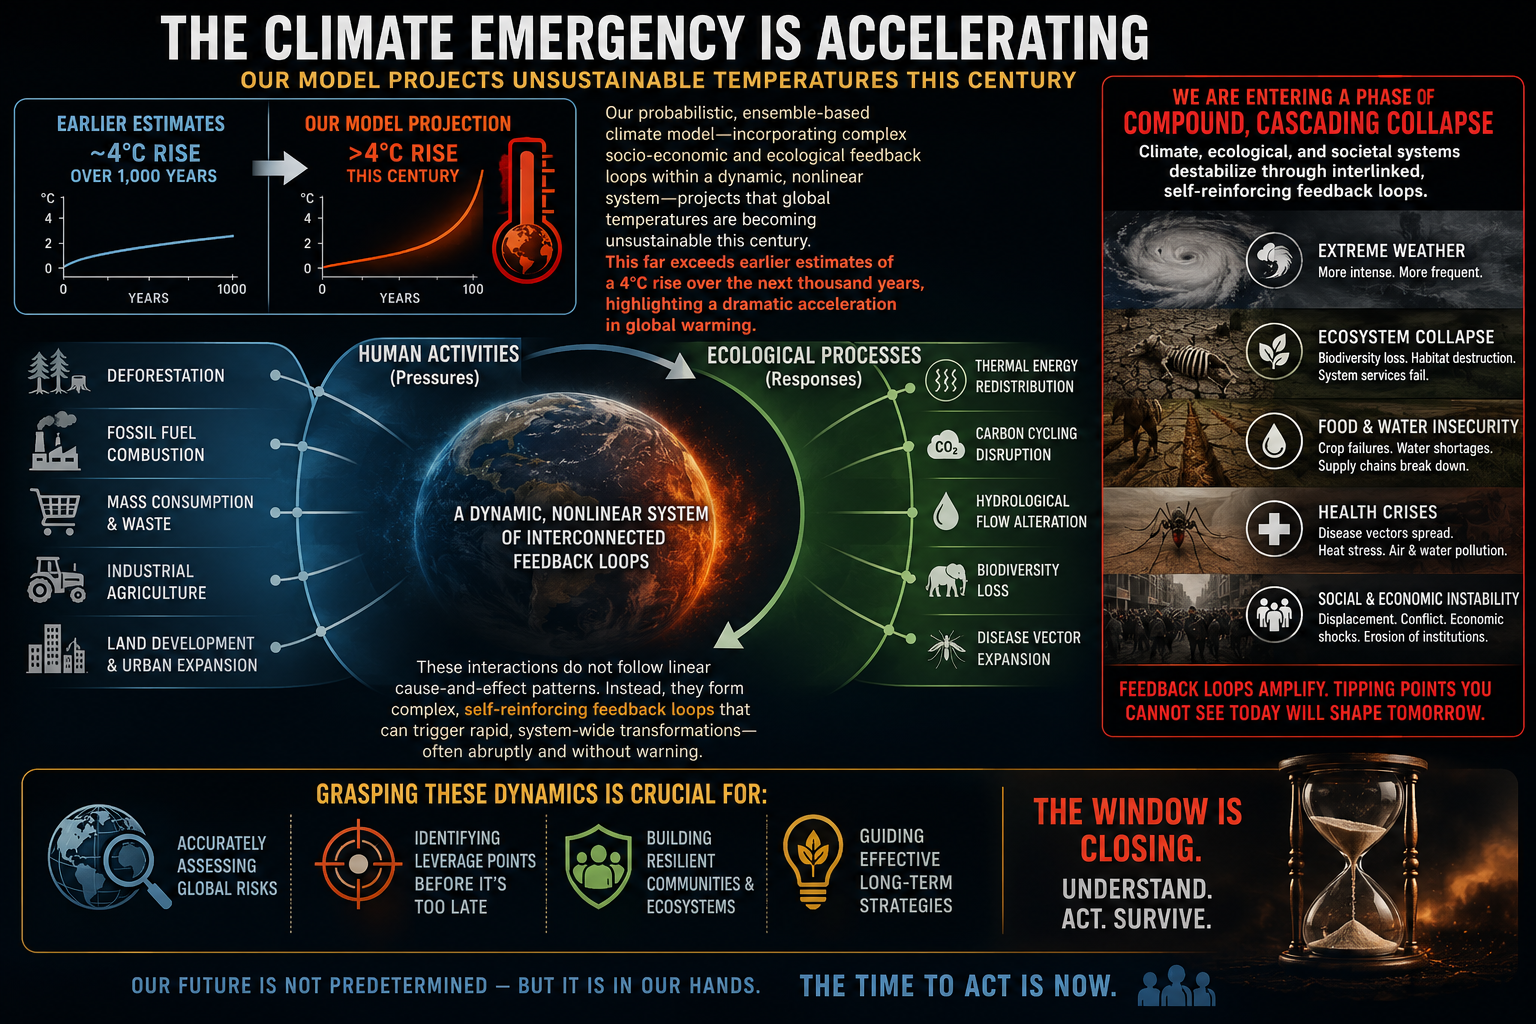
We examine how human activities — such as deforestation, fossil fuel combustion, mass consumption, industrial agriculture, and land development — interact with ecological processes like thermal energy redistribution, carbon cycling, hydrological flow, biodiversity loss, and the spread of disease vectors. These interactions do not follow linear cause-and-effect patterns. Instead, they form complex, self-reinforcing feedback loops that can trigger rapid, system-wide transformations — often abruptly and without warning. Grasping these dynamics is crucial for accurately assessing global risks and developing effective strategies for long-term survival.
Feedback loops amplify climate change and can push interconnected Earth systems past critical tipping points. As tipping points are crossed, they can trigger additional feedback loops and destabilize other climate systems. This cascading “Domino Effect” compresses timescales, accelerates change, and increases the risk of rapid, nonlinear climate transformations.
Bottom line:The question is no longer how warm the planet becomes, but how life on Earth can endure when change outpaces our ability to adapt. We cannot control the laws of physics, but we can control our pollution. The most effective action is to stop burning fossil fuels.
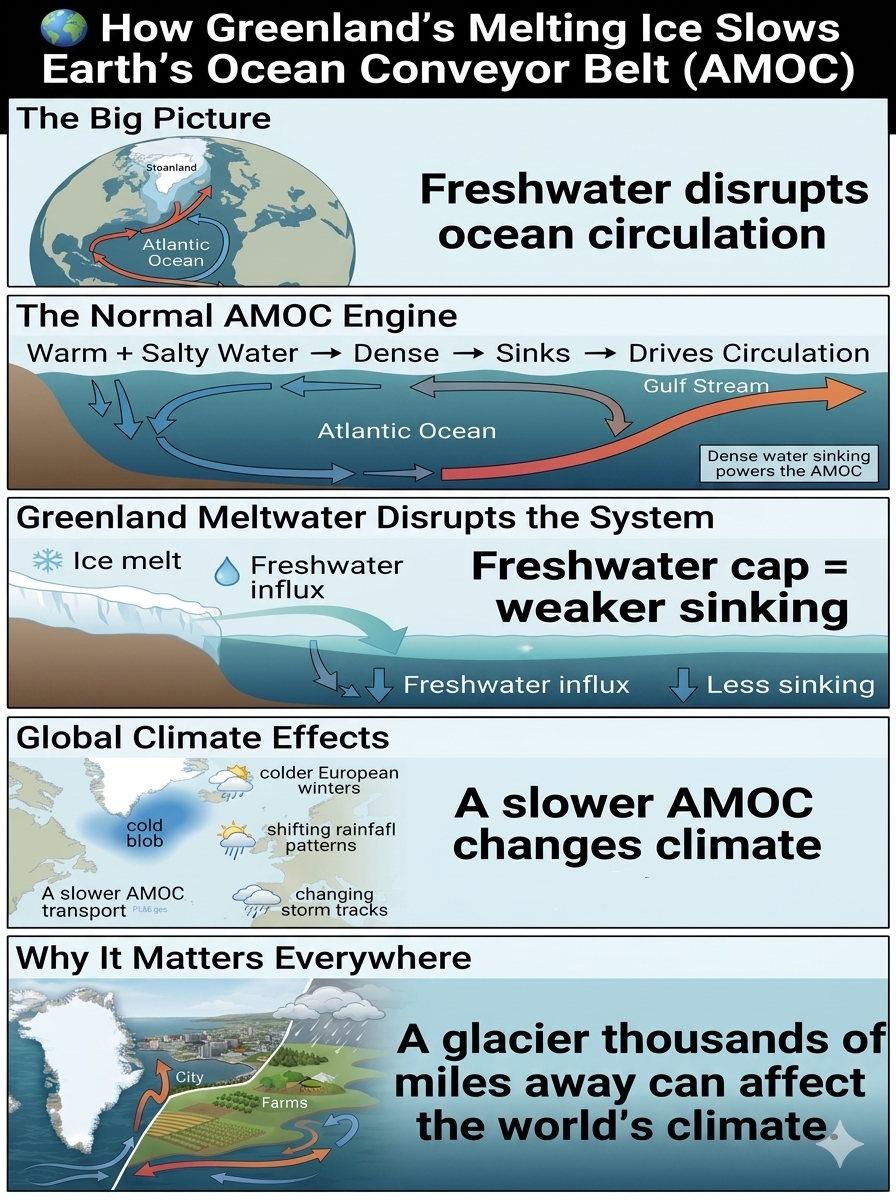
Glacial retreat is weakening the Atlantic Meridional Overturning Circulation (AMOC) by injecting enormous amounts of freshwater into the North Atlantic. This disrupts the natural “ocean conveyor belt” that redistributes heat around the planet and plays a critical role in regulating global climate patterns.
The Mechanics of the Slowdown
The AMOC depends on a delicate balance between temperature and salinity to maintain its circulation. Greenland’s accelerating ice loss is disturbing this balance through a chain reaction:
The Normal Engine: Sinking Water
Under normal conditions, warm, salty tropical water flows northward through the Gulf Stream into the North Atlantic. As this water reaches the subpolar regions near Greenland, it cools. Because cold, salty water is extremely dense, it sinks rapidly into the deep ocean.
This sinking motion acts like the engine of the AMOC, pulling more warm surface water northward while sending colder deep water back toward the tropics. This continuous cycle helps transport heat around the globe.
The Freshwater Cap
The accelerating retreat of the Greenland Ice Sheet is adding vast quantities of freshwater directly into these critical deep-water formation zones.
Unlike salty ocean water, freshwater is less dense. As meltwater accumulates at the surface, it creates a buoyant freshwater layer — sometimes described as a “cap” — that makes it more difficult for surface waters to sink.
Loss of Density: A Slower Conveyor
When surface waters cannot sink efficiently, the downward circulation weakens. The reduced sinking disrupts the entire AMOC system, slowing the transport of heat and altering ocean circulation patterns across the Atlantic basin.
Compounding Regional Feedbacks
The Atlantic “Cold Blob”
One of the most visible signs of AMOC weakening is a persistent region of unusually cold water south of Greenland and near the North Atlantic subpolar gyre, often called the Atlantic Cold Blob.
As the AMOC slows, less tropical heat is transported northward, creating a localized cooling pattern within an otherwise warming planet. This cold region acts as a fingerprint of changing ocean circulation.
Glacial Changes Beyond Greenland
The AMOC is not isolated from the rest of the planet. Research suggests that melting glaciers and ice sheets in other regions can influence global ocean salinity patterns.
Freshwater entering the Pacific Ocean from retreating glaciers and melting icebergs can alter large-scale ocean circulation pathways, potentially affecting the Atlantic system thousands of miles away.
Current Impact and Future Outlook
Observations indicate that the AMOC has weakened compared with conditions in the mid-20th century, although the exact magnitude of the slowdown remains an active area of scientific research because direct measurements of the full system only began recently.
Earlier climate discussions often focused on the possibility of a sudden, abrupt AMOC collapse. More recent high-resolution climate simulations generally suggest that Greenland meltwater is more likely to contribute to a progressive weakening rather than an immediate shutdown.
However, a substantial long-term slowdown would still have major consequences:
🌊 Changes in Atlantic heat transport
❄️ More extreme winter patterns in parts of Europe
🌧️ Shifts in tropical rainfall and monsoon systems
🌪️ Altered storm tracks and regional weather extremes
🌍 Greater disruption of Earth’s climate balance
The AMOC is a reminder that Earth’s climate system is not a collection of isolated parts. A glacier melting thousands of miles away can influence ocean currents, weather patterns, and societies around the world.
The fate of Greenland’s ice is not just an Arctic issue — it is a global climate signal.
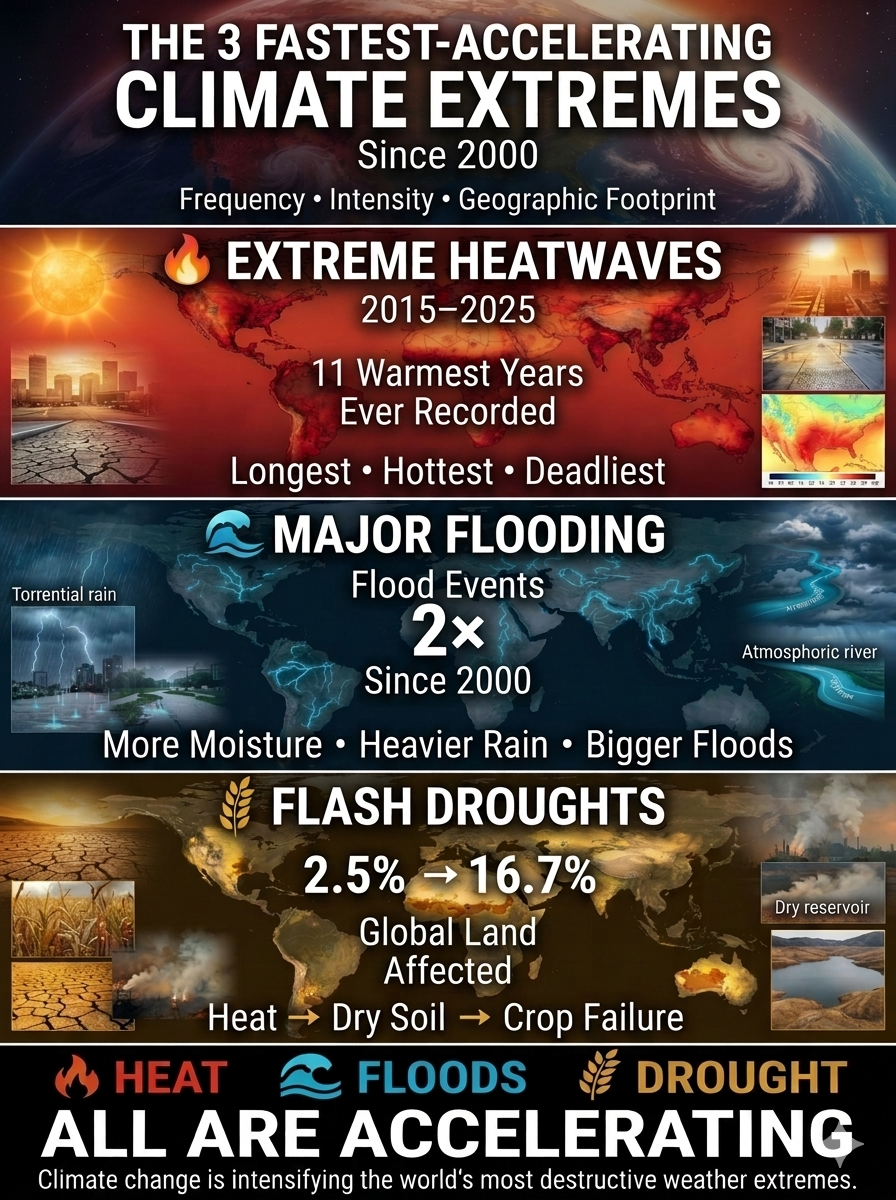
Since 2000, three climate extremes have accelerated faster than all others in their frequency, intensity, and geographic reach: extreme heatwaves, major flooding, and heat-triggered flash droughts.
1. Extreme Heatwaves The Trend: The years 2015–2025 were the 11 warmest years ever recorded globally. The Impact: Heatwaves have become dramatically longer, hotter, and more widespread, producing record-breaking temperatures on every continent. They now account for the largest share of climate-related deaths worldwide and increasingly strain power grids, agriculture, water supplies, and public health systems.
2. Major Flooding & Extreme Rainfall The Trend: According to United Nations disaster records, major flood events have more than doubled since 2000, increasing from approximately 1,389 events to more than 3,254. The Impact: As the atmosphere warms, it holds significantly more water vapor, intensifying the global water cycle. The result is a sharp rise in short-duration, high-intensity rainfall that overwhelms drainage systems, dams, rivers, and urban infrastructure.
3. Heat-Triggered Flash Droughts The Trend: The share of global land affected by heat-driven drought has expanded from 2.5% in the 1980s to 16.7% in recent years, with the rate of increase accelerating roughly eightfold since 2000. The Impact: Unlike traditional droughts that develop over months, flash droughts can emerge within weeks. Extreme heat rapidly strips moisture from soils and vegetation, triggering sudden crop failures, water shortages, wildfire risk, and severe agricultural losses before communities have time to respond.
Bottom Line: These three extremes—extreme heat, extreme flooding, and flash droughts—are no longer isolated events. They are accelerating simultaneously, amplifying one another, and reshaping climate risk across the globe. Together, they represent the clearest evidence that climate change is driving a new era of increasingly frequent, intense, and widespread extreme weather.
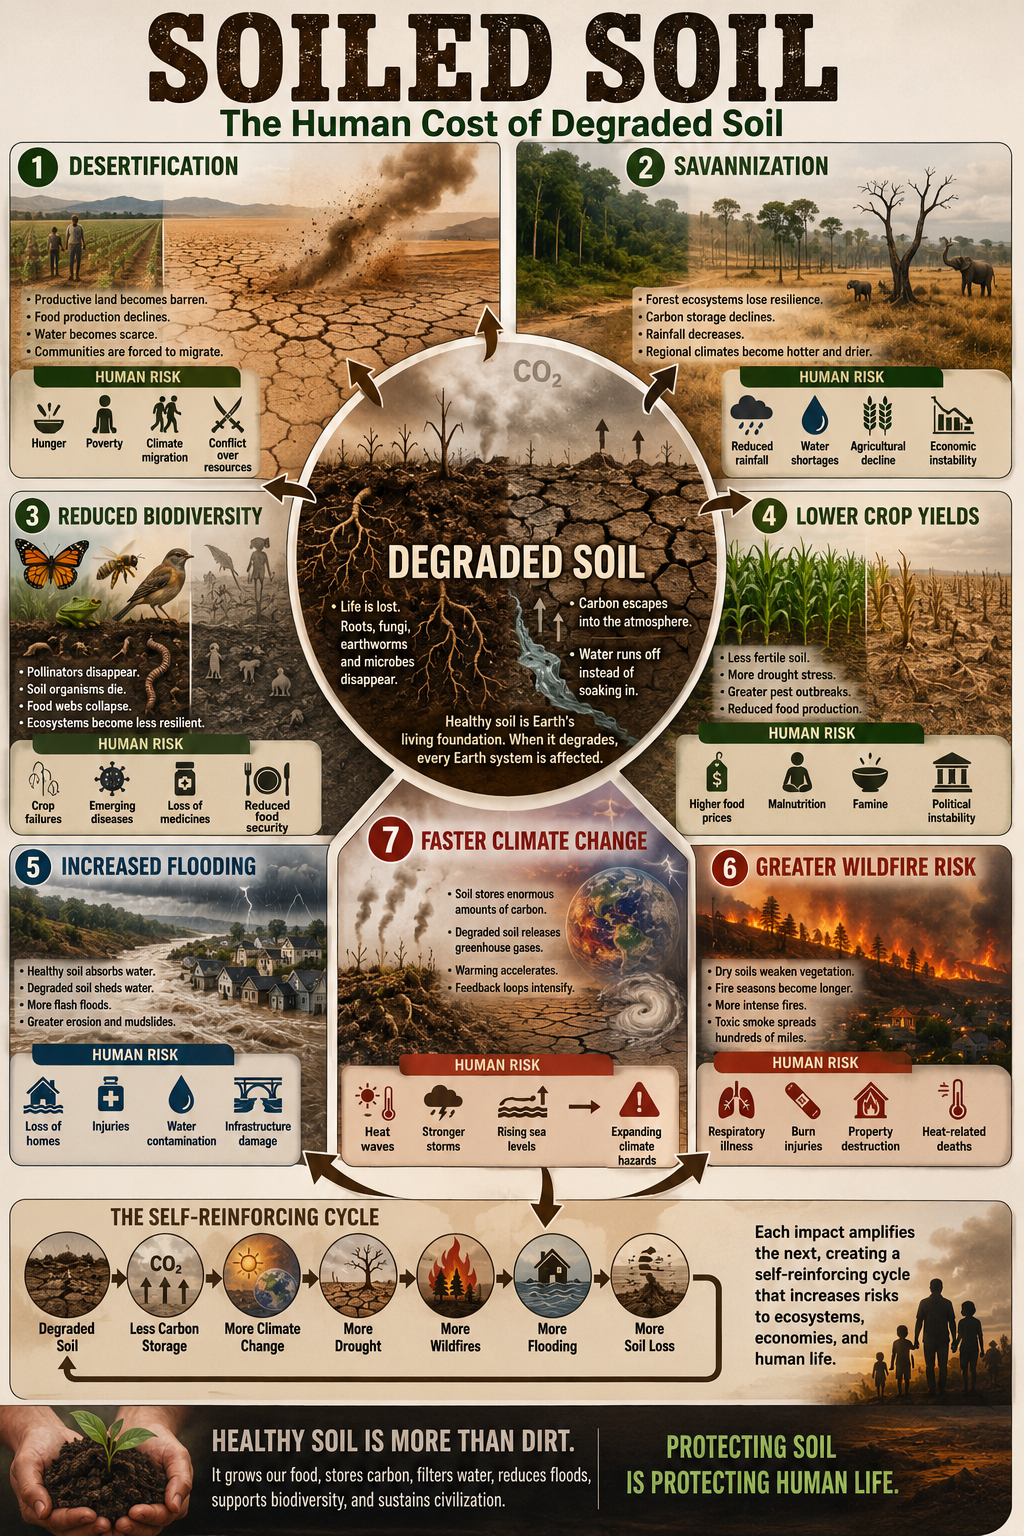
Most people think of soil as nothing more than dirt. In reality, healthy soil may be one of the most important—and overlooked—parts of Earth’s climate system. Unlike the atmosphere, oceans, or glaciers, soil is alive.
A single handful of healthy soil contains billions of living organisms: bacteria, fungi, insects, earthworms, and countless other forms of life. Together, they recycle nutrients, store carbon, filter water, and support nearly every plant on Earth. Without healthy soil, there is no healthy ecosystem.
The Planet’s Crossroads
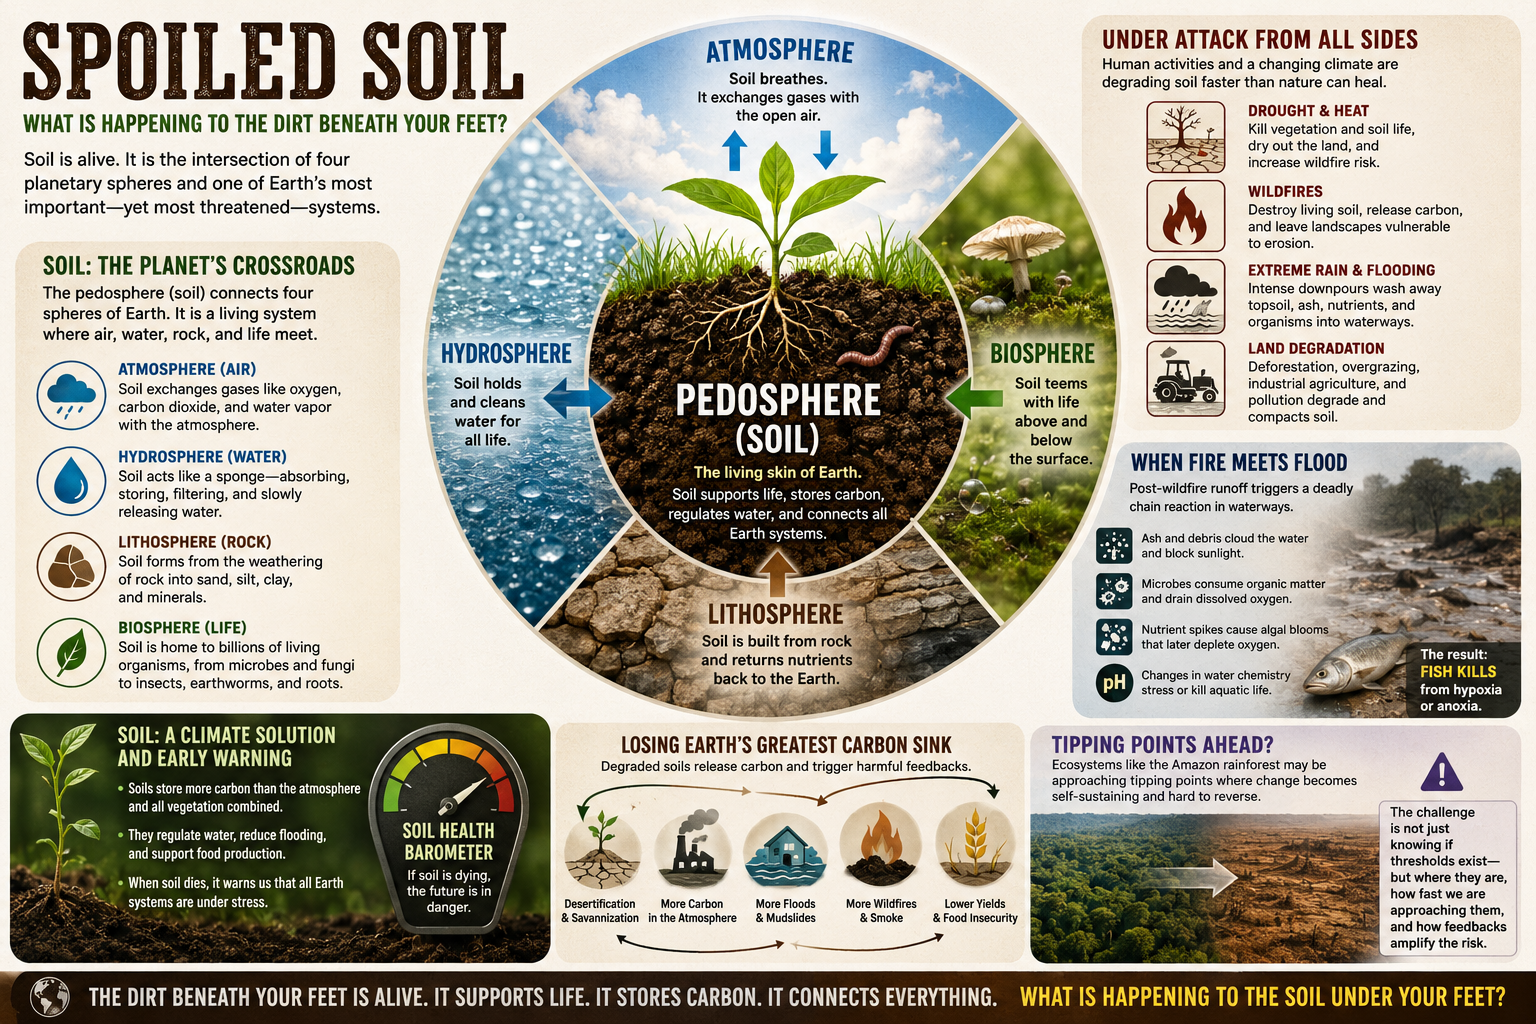
Soil is unique because it lies at the intersection of Earth’s major systems. Scientists classify it as its own domain, the pedosphere (from the Greek pedon, meaning soil or earth).
The pedosphere connects four planetary spheres:
Atmosphere (Air): Soil constantly exchanges oxygen, carbon dioxide, methane, and water vapor with the atmosphere.
Hydrosphere (Water): Soil absorbs, stores, filters, and slowly releases water, acting like a giant natural sponge.
Lithosphere (Rock): Soil forms from the weathering of rock into sand, silt, clay, and minerals.
Biosphere (Life): Soil is home to an astonishing diversity of plants, fungi, microbes, insects, and animals.
Because every one of these systems depends on healthy soil, changes in soil often reveal changes occurring throughout the entire Earth system.
Soil: A Living Climate Indicator
Healthy soil stores enormous amounts of carbon—more than the atmosphere and all vegetation combined. It also regulates water, reduces flooding, supports agriculture, and provides habitat for countless organisms.
When soil begins to deteriorate, it serves as an early warning that multiple environmental systems are under stress.
Unfortunately, human activities are placing unprecedented pressure on soils worldwide. Climate change, deforestation, intensive agriculture, pollution, and urban development are accelerating soil degradation faster than many ecosystems can recover.
Hydroclimatic Whiplash
One of the clearest examples is hydroclimatic whiplash—rapid swings between severe drought and intense rainfall.
Extended drought weakens vegetation, dries out soils, kills soil organisms, and greatly increases wildfire risk.
Then the weather often swings in the opposite direction.
Atmospheric rivers, microbursts, and other extreme rain events produce intense runoff that washes away the already damaged landscape. Instead of soaking into healthy soil, the water carries ash, sediment, nutrients, and debris into streams, rivers, and lakes.
This creates a cascade of environmental damage.
When Fire Meets Flood
Scientists refer to these events as post-wildfire runoff or rain-on-wildfire events.
The chain reaction can be devastating:
Ash and debris cloud the water and block sunlight.
Microorganisms rapidly consume the incoming organic material, using up dissolved oxygen.
Nutrients such as nitrogen and phosphorus trigger algal blooms that later consume even more oxygen as they decay.
Changes in water chemistry stress or kill aquatic organisms.
The result is often a fish kill, caused by hypoxia (dangerously low oxygen) or anoxia (complete oxygen depletion).
What began as a wildfire on land becomes an ecological disaster throughout an entire watershed.
Losing One of Earth’s Greatest Carbon Sinks
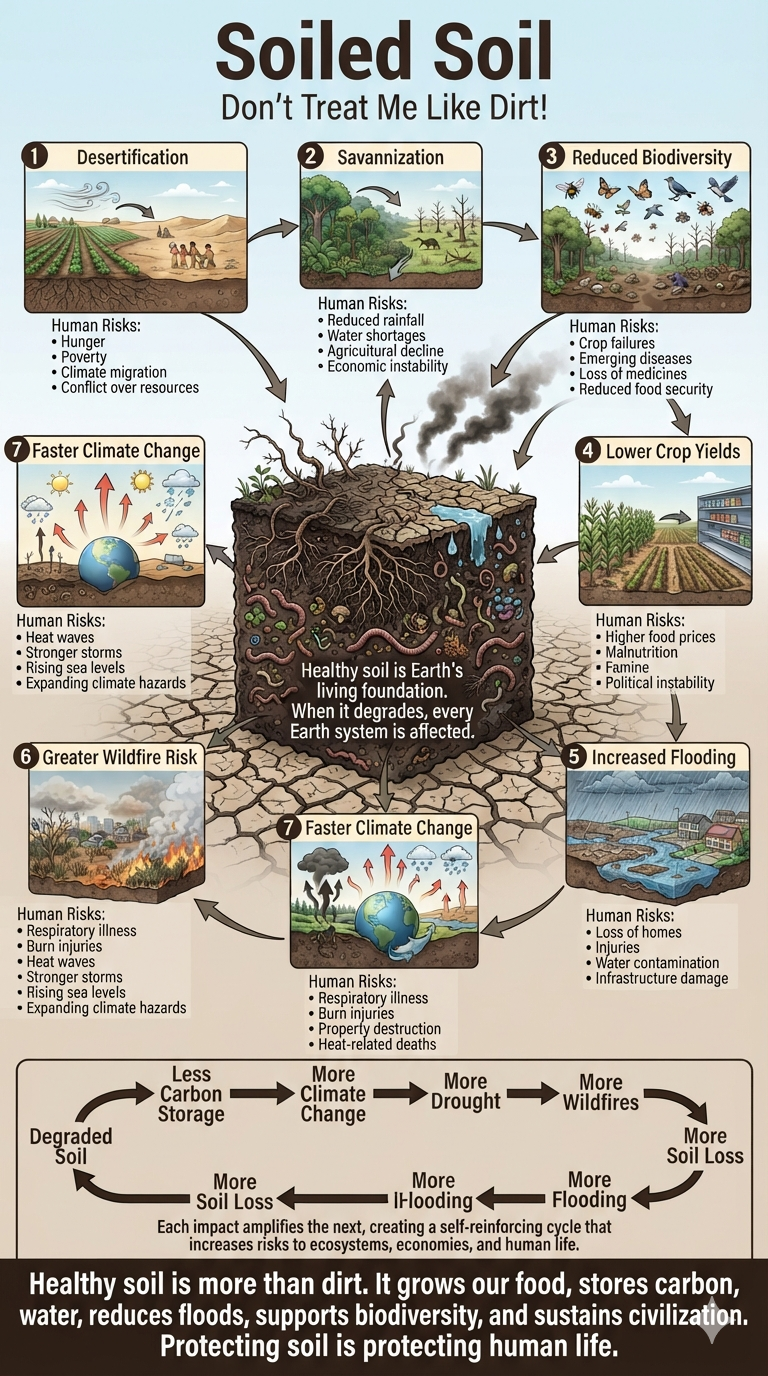
Healthy soils are among Earth’s largest natural carbon sinks. As soils degrade, they lose their ability to store carbon and instead may release additional greenhouse gases into the atmosphere.
The consequences extend far beyond agriculture.
Degraded soils contribute to:
Desertification
Savannization
Reduced biodiversity
Lower crop yields
Increased flooding
Greater wildfire risk
Faster climate change
Each of these impacts can reinforce the others, creating self-amplifying feedback loops that become increasingly difficult to reverse.
Why Scientists Are Concerned
Many scientists are studying whether some of Earth’s major ecosystems are approaching critical tipping points.
One of the most closely watched examples is the Amazon rainforest. Continued warming, drought, deforestation, and fire could reduce parts of the forest’s ability to sustain itself, transforming sections into a drier, more open landscape. While considerable uncertainty remains about exactly where these thresholds lie, growing evidence suggests that several Earth systems are becoming less resilient.
The challenge is no longer simply determining whether tipping points exist.
It is identifying where they are, how quickly we are approaching them, and how multiple feedback loops may interact to accelerate change.
We often look to melting glaciers, rising seas, stronger storms, or record-breaking temperatures as signs of climate change.
But one of the clearest indicators may be much closer.
The dirt beneath your feet is not just dirt.
It is a living ecosystem, a massive carbon reservoir, a water filter, the foundation of agriculture, and the meeting place of Earth’s atmosphere, water, rock, and life.
If the soil is becoming less healthy, it is a warning that the entire planetary system is under increasing stress.
The next time you stand on the ground, consider this question:
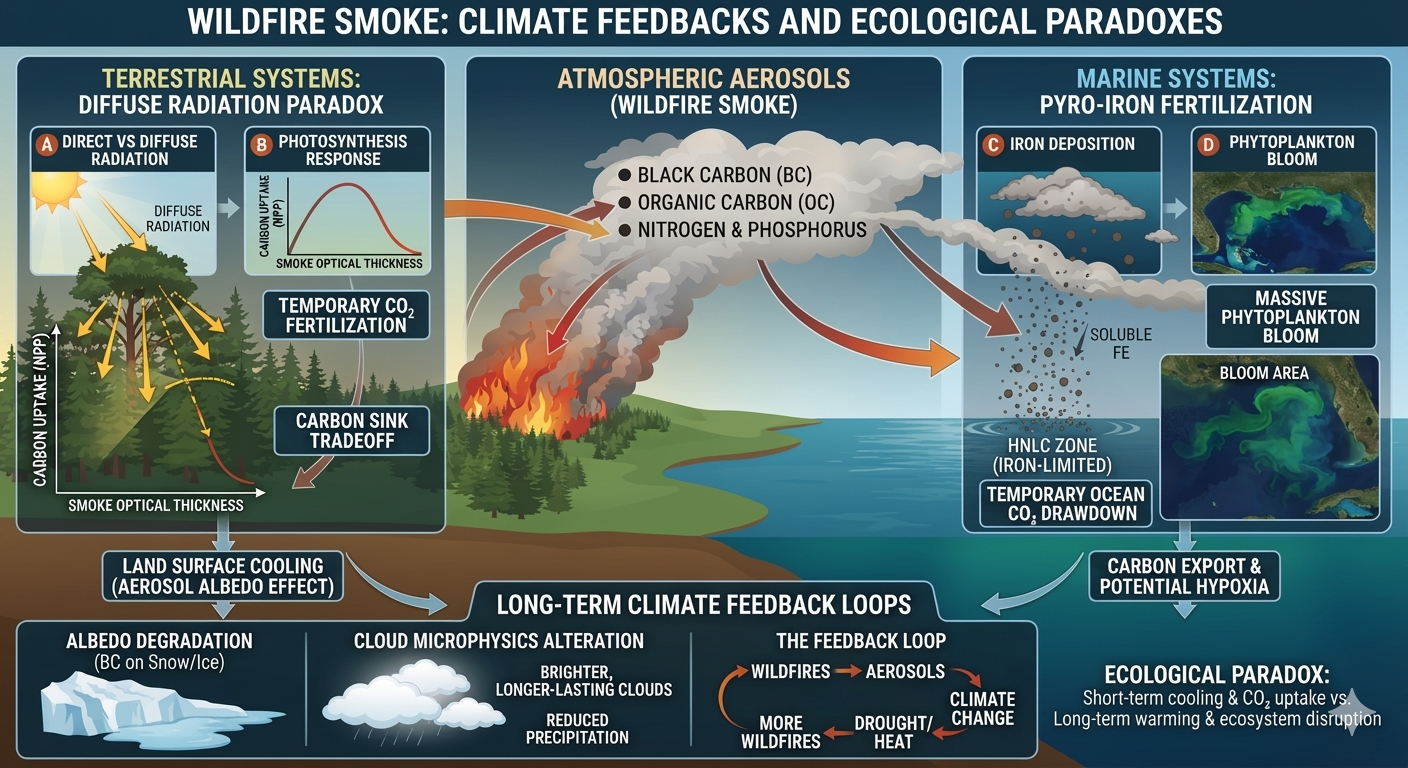
Wildfire Smoke, Climate Feedbacks, and Ecological Paradoxes: The Dual Impacts of Atmospheric Aerosols on Terrestrial and Marine Systems
Abstract
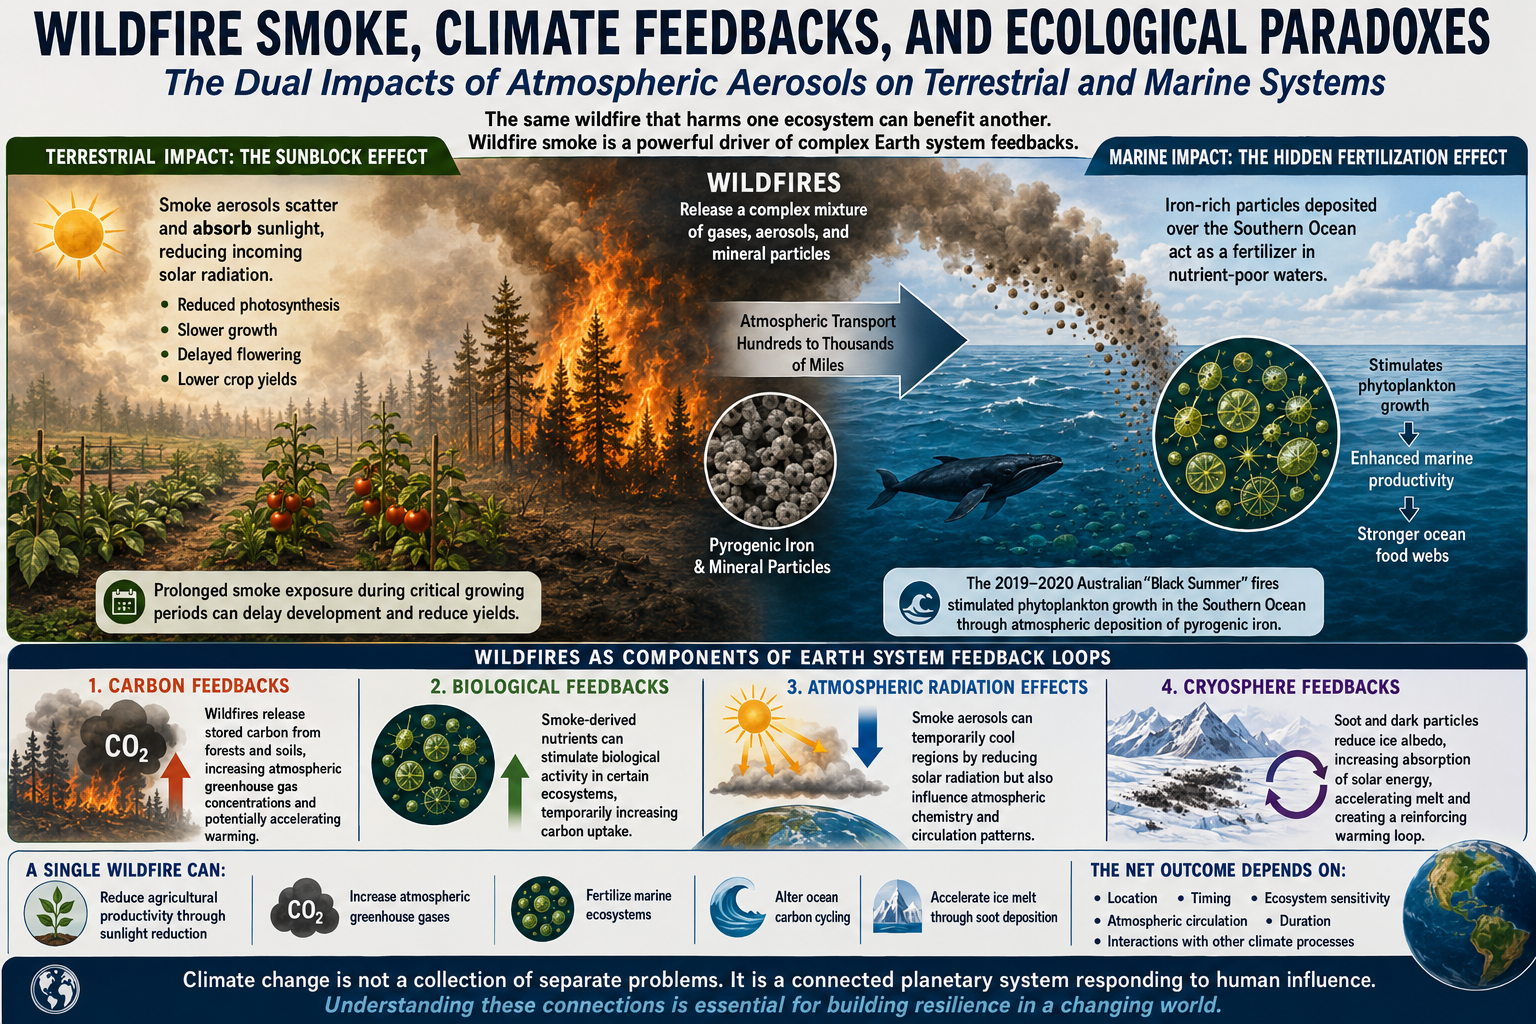
Wildfire smoke is an increasingly important variable in understanding climate impacts, ecosystem responses, and agricultural productivity. Prolonged smoke exposure can significantly reduce incoming solar radiation, creating a “sunblock” effect that suppresses photosynthesis, delays plant development, and reduces agricultural yields. However, wildfire emissions also generate complex ecological interactions that can produce unexpected secondary effects.
The same wildfire event that damages terrestrial ecosystems through heat, smoke, and carbon emissions can stimulate biological productivity in distant marine environments through nutrient deposition. The 2019–2020 Australian “Black Summer” wildfire season provides a striking example: enormous quantities of pyrogenic iron contained within smoke and ash aerosols were transported over the Southern Ocean, triggering significant phytoplankton growth. These contrasting effects demonstrate that wildfire impacts cannot be understood through a single-variable framework.
Wildfire aerosols represent a component of a broader Earth system feedback network involving atmospheric chemistry, biological productivity, carbon cycling, and cryospheric changes. Understanding these interactions is essential for accurately assessing future climate trajectories.
1. Introduction
Climate change is altering the frequency, intensity, and geographic distribution of wildfire activity. Rising temperatures, prolonged droughts, and changing atmospheric circulation patterns are contributing to longer fire seasons and more extreme fire behavior.
Wildfires are often evaluated primarily through their immediate destructive impacts:
carbon dioxide emissions,
habitat loss,
human health effects,
infrastructure damage,
agricultural disruption.
However, wildfire smoke is not merely a pollutant. It is a complex atmospheric mixture containing gases, organic compounds, black carbon, minerals, and nutrients that can interact with ecosystems thousands of miles away.
These interactions reveal an important principle of Earth system science:
A climate disturbance can simultaneously create damaging effects in one system while stimulating biological activity in another.
2. The Agricultural Impact of Wildfire Smoke
One of the most direct effects of wildfire smoke on agriculture is the reduction of incoming solar radiation.
Smoke particles suspended in the atmosphere scatter and absorb sunlight, reducing the amount of photosynthetically active radiation reaching plants. During critical growing periods, this reduction can have measurable consequences:
slower plant growth,
delayed flowering,
reduced fruit development,
lower crop yields.
Backyard gardens and small-scale agricultural systems can be particularly sensitive because they often rely on seasonal sunlight thresholds. Extended periods of smoke exposure during June through August, for example, can interrupt peak growing conditions and delay maturation until clearer atmospheric conditions return.
This effect represents a climate-related agricultural stressor that may become increasingly important as wildfire seasons expand.
3. The Hidden Fertilization Effect of Wildfires
Despite these negative impacts, wildfire emissions can also create unexpected ecological benefits in specific environments.
A notable example occurred during Australia’s Black Summer wildfire season (2019–2020). These fires were among the largest recorded in modern Australian history, releasing enormous quantities of carbon, smoke aerosols, and mineral particles into the atmosphere.
Researchers observed a major increase in phytoplankton productivity in portions of the Southern Ocean following the fires.
The mechanism was not the carbon itself, but rather pyrogenic iron contained within wildfire smoke and ash.
Iron is a limiting nutrient in many ocean regions. When wildfire-derived iron particles were transported over the ocean and deposited into nutrient-poor waters, they acted as a fertilizer, stimulating the growth of phytoplankton—microscopic marine algae that form the foundation of ocean food webs.
This created a paradox:
The wildfire released massive quantities of greenhouse gases.
The same wildfire also temporarily enhanced marine biological productivity.
4. Wildfires as Components of Earth System Feedback Loops
The wildfire example demonstrates why climate systems cannot be evaluated through isolated cause-and-effect relationships.
Wildfires interact with multiple feedback mechanisms:
4.1 Carbon Feedbacks
Wildfires release stored carbon from forests and soils, increasing atmospheric greenhouse gas concentrations and potentially accelerating warming.
4.2 Biological Feedbacks
Smoke-derived nutrients can stimulate biological activity in certain ecosystems, temporarily increasing carbon uptake.
4.3 Atmospheric Radiation Effects
Smoke aerosols can temporarily cool regions by reducing solar radiation but can also influence atmospheric chemistry and circulation patterns.
4.4 Cryosphere Feedbacks
One of the most important long-term concerns is the effect of wildfire soot and dark particles deposited onto snow and ice.
Normally, snow and ice reflect a large portion of incoming solar radiation through the ice albedo effect. When dark particles accumulate on these surfaces:
Reflectivity decreases.
More solar energy is absorbed.
Melting accelerates.
Darker surfaces are exposed.
Additional warming occurs.
This creates a reinforcing feedback loop that can accelerate ice loss.
5. The Challenge of Modeling Nonlinear Climate Systems
Wildfire impacts highlight a fundamental challenge in climate science: Earth is not a collection of independent systems.
Atmosphere, oceans, land ecosystems, and the cryosphere are interconnected through feedback mechanisms.
A single wildfire can:
reduce agricultural productivity through sunlight reduction,
increase atmospheric greenhouse gases,
fertilize marine ecosystems,
alter ocean carbon cycling,
accelerate ice melt through soot deposition.
The net outcome depends on:
location,
timing,
ecosystem sensitivity,
atmospheric circulation,
duration,
and interactions with other climate processes.
These nonlinear interactions make climate prediction challenging because small changes in one part of the system can produce unexpected consequences elsewhere.
6. Conclusion
Wildfire smoke represents a powerful example of the complexity of climate change impacts. While smoke exposure can reduce sunlight, harm crops, and threaten human health, wildfire aerosols can also transport nutrients that stimulate biological productivity in distant ecosystems.
The Australian Black Summer fires demonstrate that climate impacts are rarely purely positive or negative. They are part of a dynamic Earth system where destructive processes can simultaneously trigger secondary effects across continents and oceans.
Understanding these interactions requires moving beyond simple cause-and-effect thinking and recognizing climate change as an interconnected system of feedbacks.
The challenge ahead is not merely predicting individual climate events. It is understanding how thousands of interacting processes combine to reshape the stability of Earth’s environmental systems.
Climate change is not a collection of separate problems. It is a connected planetary system responding to human influence.
Climate change is often discussed as a problem of emissions, but emissions are the result of two interconnected forces: consumption and production.
Q: What are the greatest drivers of climate change? A: Consumption and production.
At present, I would rank our addiction to consumption and ecofascism as the two most significant drivers of the climate crisis. While they operate in different ways, both reinforce the systems that accelerate environmental degradation.
The Consumption Problem
The United States, Western Europe, Canada, and Australia represent some of the world’s most consumption-driven economies. When self-interest, materialism, and short-term economic incentives dominate decision-making, consumer demand becomes one of the primary drivers of climate change, influencing not only greenhouse gas emissions but also land-use change, deforestation, habitat destruction, water consumption, resource depletion, and biodiversity loss.
This is why consumption-based accounting provides a more accurate picture of climate responsibility than production-based accounting alone.
For example, if a smartphone is manufactured in Asia using coal-generated electricity and then shipped across the Pacific to a consumer in Los Angeles, the emissions from mining, manufacturing, transportation, and delivery are ultimately driven by the purchasing decision. Under consumption-based accounting, those emissions are attributed to the American consumer rather than solely to the country where the phone was manufactured.
Read the full explanation and view the rankings here:
The production side of the equation is likewise influenced by self-interest and economic incentives, but it is also shaped by ideological movements that obstruct effective climate action.
Two distinct, though sometimes overlapping, ideologies are particularly important:
Denialism is characterized by the rejection of scientific evidence, refusal to engage with empirical data, and reliance on misinformation or rhetorical distraction. Its primary objective is often the protection of political, ideological, or economic interests by undermining the scientific consensus.
Ecofascism combines elements of denialism with authoritarian, exclusionary, or extremist beliefs. In its most extreme forms, it portrays environmental collapse as acceptable—or even desirable—because it is viewed as reducing populations or preserving resources for groups considered more deserving than others. This ideology has historically been associated with racist, xenophobic, or eugenicist beliefs and rejects principles of equality and shared human responsibility.
The distinction is important. Traditional denialism primarily seeks to delay or prevent climate policy. Ecofascism goes further by framing unequal human survival as an acceptable or even desirable outcome — eliminationist logic.
Why This Matters
Climate change is not simply a technological or economic challenge. It is also a question of values.
On one side, excessive consumption drives demand for fossil fuels, resource extraction, and emissions. On the other, ideologies that reject science or rationalize unequal human suffering weaken society’s ability to respond effectively to the crisis.
Both sides must be addressed if meaningful progress is to be made.
Further Reading
While investigating climate change denialism, I examined material that I believe illustrates the intersection between denialist narratives and extremist environmental ideologies. A summary of that research is available here:
When most people think about greenhouse gas emissions, they picture sprawling cities, crowded highways, and millions of people flipping on lights and air conditioners. It’s no surprise, then, that states like California, Texas, Florida, and New York usually dominate lists of greenhouse gas emissions. But those rankings tell only part of the story.
What if the question isn’t simply “Which states emit the most greenhouse gases?” What if it’s “Which states are most responsible for producing the fossil fuels that drive climate change?”
The answer looks dramatically different.
Beyond Smokestacks and Tailpipes
Traditional greenhouse gas inventories are based on territorial emissions—the emissions that physically occur within a state’s borders. That includes electricity generation, transportation, manufacturing, agriculture, and buildings.
This accounting system is useful, but it overlooks much of the climate impact associated with fossil fuel production.
Before a gallon of gasoline reaches your car or natural gas heats your home, fossil fuels must be:
explored,
extracted,
processed,
transported,
refined,
and stored.
Each of these steps releases greenhouse gases. Oil wells leak methane. Coal mines vent methane. Natural gas fields flare excess gas. Refineries consume enormous amounts of energy. LNG export terminals require massive refrigeration systems. Petrochemical plants emit carbon dioxide while transforming hydrocarbons into fuels and plastics.
These emissions are real. Yet many are only partially reflected—or entirely absent—from conventional state comparisons.
Introducing the Composite Climate Responsibility Index
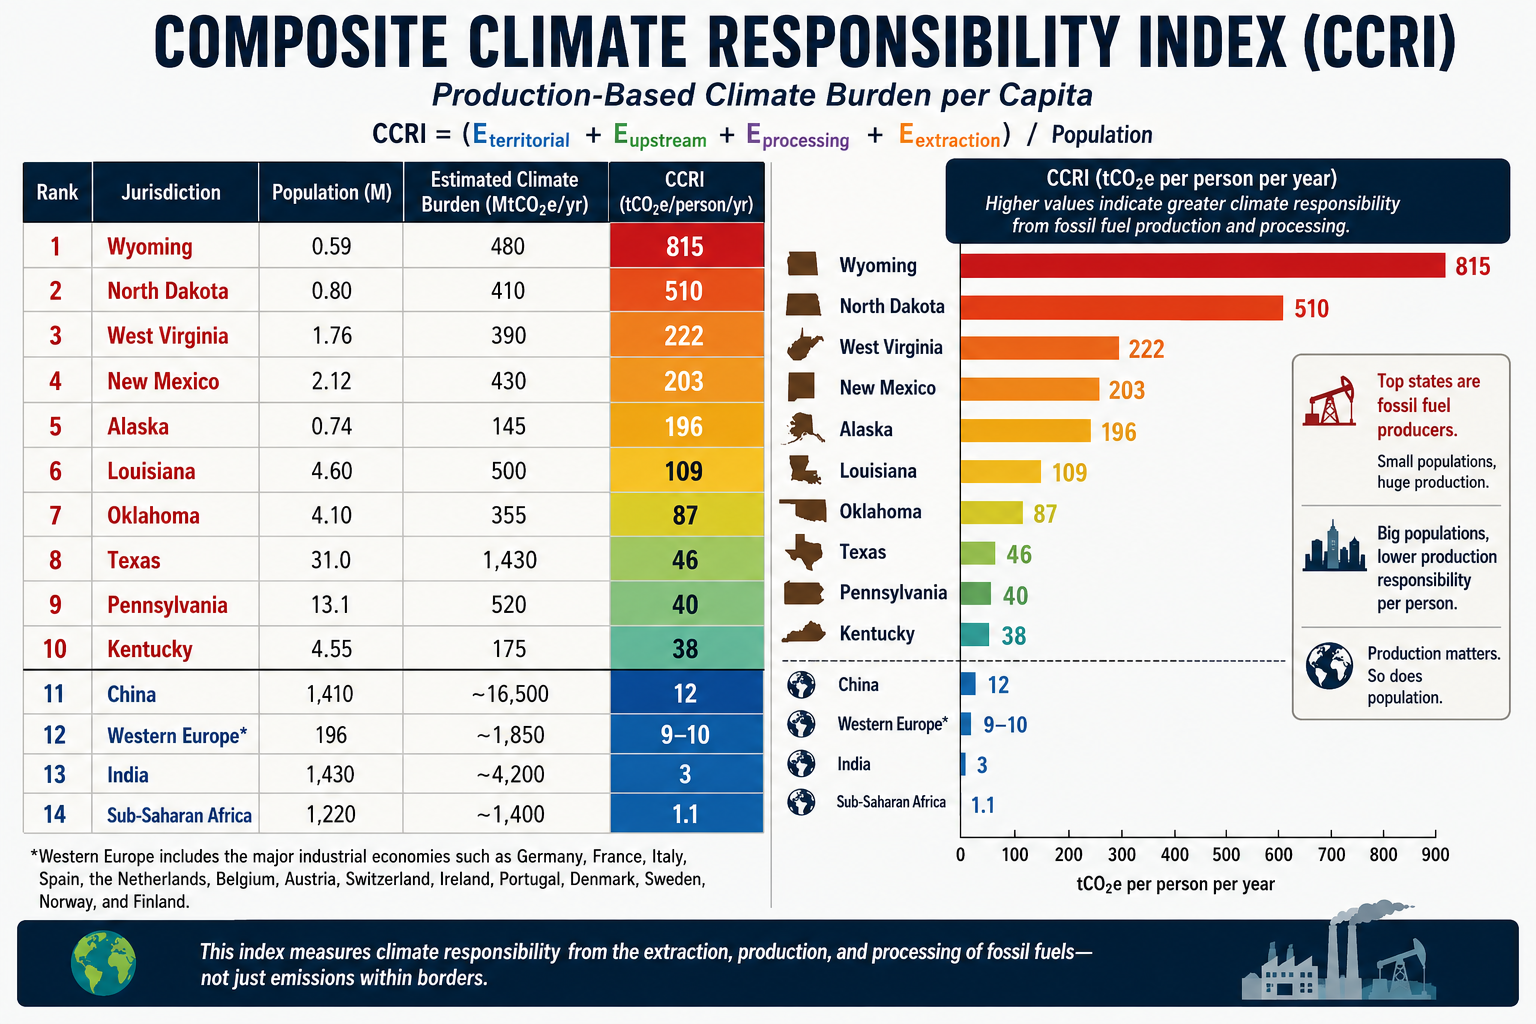
To capture the full climate burden of fossil fuel production, I developed the Composite Climate Responsibility Index (CCRI).
Rather than looking only at emissions released within a state’s borders, CCRI combines four major components:
Territorial emissions – direct greenhouse gas emissions occurring within the state.
Upstream emissions – methane leakage, venting, flaring, and other fugitive releases.
Processing emissions – petroleum refining, LNG facilities, natural gas processing, and petrochemical manufacturing.
Extraction emissions – emissions associated with coal mining, oil production, drilling, hydraulic fracturing, and natural gas extraction.
The combined total is then divided by the state’s population to produce a per-capita measure of climate responsibility.
This approach shifts the focus from where emissions occur to where the fossil fuel system originates.
A Completely Different Ranking
Applying this framework produces a ranking that bears little resemblance to traditional greenhouse gas inventories.
Instead of being dominated by the largest population centers, the states with the highest per-capita climate responsibility are overwhelmingly those that produce fossil fuels.
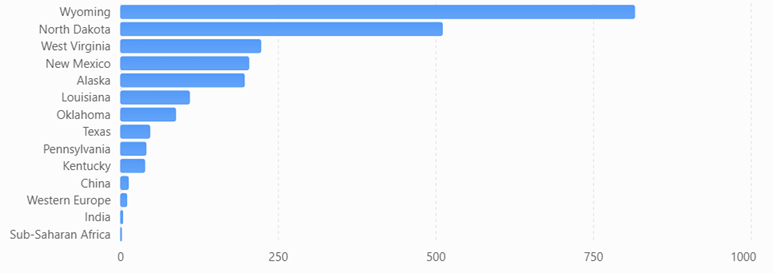
Top Ten States by Composite Climate Responsibility
Wyoming
North Dakota
West Virginia
New Mexico
Louisiana
Alaska
Oklahoma
Texas
Pennsylvania
Kentucky
Notice who’s missing.
California, Florida, New York, New Jersey, Massachusetts, and Washington—all states commonly associated with high emissions because of their large populations—drop dramatically in the rankings.
Instead, relatively small states become climate heavyweights because they extract, refine, process, or export enormous quantities of fossil fuels.
Wyoming: A Climate Giant with Half a Million People
Wyoming is home to fewer than 600,000 residents, yet it produces more coal than any other state and remains a major producer of natural gas.
Under conventional accounting, Wyoming appears to have modest total emissions simply because so few people live there.
But when coal mining, methane releases, and extraction activities are included, Wyoming’s per-capita climate burden becomes extraordinary.
Its climate footprint is measured not by how many people live there, but by how much carbon leaves the state embedded in coal, oil, and natural gas.
Texas: The Carbon Superpower
Texas remains in a category of its own.
No other state combines:
the nation’s largest oil production,
the largest natural gas production,
the largest refining capacity,
one of the world’s largest petrochemical industries,
extensive LNG export facilities,
and the highest total greenhouse gas emissions.
Its enormous population moderates its per-capita ranking, but Texas still lands in the top ten because the scale of its fossil fuel industry is unmatched.
In absolute terms, Texas likely contributes more lifecycle greenhouse gas emissions than any other U.S. state.
Methane Changes Everything
One of the largest differences between CCRI and conventional inventories is methane.
Natural gas has often been marketed as a “cleaner” fossil fuel because it emits less carbon dioxide when burned than coal.
However, methane itself is a potent greenhouse gas. Even relatively small leaks during drilling, gathering, processing, and transportation can substantially increase the climate impact of natural gas production.
States with large oil and gas industries—such as New Mexico, North Dakota, Pennsylvania, Oklahoma, and Louisiana—move sharply upward once methane leakage, venting, and flaring are included.
Ignoring upstream methane is like calculating the cost of owning a car while pretending gasoline is free.
Production Matters
The key insight of CCRI is that climate responsibility does not end where emissions occur.
A barrel of oil extracted in North Dakota may be refined in Louisiana, transported through Texas, shipped overseas, and ultimately burned in Europe or Asia.
Each step adds greenhouse gases.
Traditional inventories divide these emissions among multiple jurisdictions, often obscuring the role of the states that initiated the fossil fuel supply chain.
CCRI reconnects those pieces.
It recognizes that extraction, processing, and upstream emissions are not incidental—they are essential components of fossil fuel production.
A More Complete Picture
The Composite Climate Responsibility Index is not intended to replace traditional greenhouse gas inventories. Those inventories remain indispensable for tracking progress toward emissions reduction within individual states.
Instead, CCRI complements existing accounting by expanding the system boundary to include the activities that make fossil fuel consumption possible.
This broader perspective helps answer questions that territorial inventories cannot:
Which states produce the largest share of climate-forcing emissions?
Where would methane reductions have the greatest impact?
Which regions contribute disproportionately to fossil fuel supply?
How should climate responsibility be allocated in a production-based economy?
By incorporating extraction, processing, upstream methane, and direct emissions into a single per-capita metric, CCRI reveals a reality that traditional rankings often miss: the states producing the fuels that power the global economy are frequently those carrying the largest climate responsibility—even when their populations are relatively small.
In the coming years, as policymakers increasingly focus on lifecycle emissions, methane mitigation, and supply-side climate policy, production-based metrics such as CCRI may prove to be as important as the territorial inventories that have guided climate reporting for decades.
Global Comparison
A comparison becomes especially revealing when the same production-based accounting is applied to both U.S. states and world regions. Instead of asking who burns the carbon, the CCRI asks who produces and enables the fossil carbon economy.
The formula remains:CCRI=PEterritorial+Eupstream+Eprocessing+Eextraction
Using this methodology, the comparison changes dramatically from conventional per-capita emissions rankings.
Estimated Composite Climate Responsibility
Rank
Jurisdiction
Population (M)
Estimated Climate Burden (MtCO₂e/yr)
CCRI (tCO₂e/person/yr)
1
Wyoming
0.59
480
815
2
North Dakota
0.80
410
510
3
West Virginia
1.76
390
222
4
New Mexico
2.12
430
203
5
Alaska
0.74
145
196
6
Louisiana
4.60
500
109
7
Oklahoma
4.10
355
87
8
Texas
31.0
1,430
46
9
Pennsylvania
13.1
520
40
10
Kentucky
4.55
175
38
11
China
1,410
~16,500
≈12
12
Western Europe*
196
~1,850
≈9–10
13
India
1,430
~4,200
≈3
14
Sub-Saharan Africa
1,220
~1,400
≈1.1
*Western Europe includes the major industrial economies such as Germany, France, Italy, Spain, the Netherlands, Belgium, Austria, Switzerland, Ireland, Portugal, Denmark, Sweden, Norway, and Finland.
Composite Climate Responsibility Index (CCRI)
Estimated production-based climate burden per capita using territorial emissions, extraction, processing, and upstream emissions.
What the comparison shows
Several important conclusions emerge.
First, fossil fuel production is far more geographically concentrated than fossil fuel consumption. Wyoming’s estimated production-based climate burden is roughly 68 times higher per resident than China’s, despite China’s position as the world’s largest emitter under conventional territorial accounting. The difference reflects Wyoming’s role as a major coal and natural gas producer serving markets far beyond its borders.
Second, China’s ranking changes substantially under the CCRI framework. China remains a major contributor because of its large coal industry, extensive refining capacity, and industrial base, but its enormous population reduces its per-capita production burden to around 12 tCO₂e per person, well below several U.S. fossil-fuel-producing states.
Third, Western Europe falls even lower. While it retains significant refining and industrial capacity, domestic fossil fuel extraction has declined over several decades. Much of its energy is imported, so a production-based metric attributes a smaller share of upstream responsibility than a consumption-based metric would.
Fourth, India and Sub-Saharan Africa rank near the bottom. Although both regions have growing energy demand, their per-capita fossil fuel production and associated upstream emissions remain comparatively low. Their climate burden is driven primarily by domestic energy use rather than large-scale extraction and export industries.
A different perspective on climate responsibility
Traditional greenhouse gas inventories emphasize where emissions occur. The CCRI instead emphasizes where the fossil fuel supply chain begins. These are complementary perspectives, each useful for different policy questions.
Territorial inventories help governments manage emissions within their borders.
Consumption-based inventories assign responsibility to the end user of goods and energy.
The CCRI highlights the jurisdictions that extract, process, and prepare fossil fuels for global consumption.
Together, these three accounting systems provide a more complete understanding of climate responsibility. The comparison also illustrates that some of the world’s highest production-based climate burdens are found not in entire countries, but in a handful of resource-rich U.S. states whose fossil fuel industries serve national and international markets.
The Composite Climate Responsibility Index (CCRI): A Lifecycle, Population-Normalized Framework for Measuring State-Level Climate Responsibility
Abstract
Greenhouse gas accounting has traditionally relied on territorial emissions—the greenhouse gases emitted within a political boundary. While this approach provides a standardized framework for national and subnational reporting, it systematically underestimates the climate responsibility of fossil fuel-producing regions by excluding upstream methane releases, fossil fuel extraction, refining, petrochemical processing, and liquefied natural gas (LNG) operations. Consequently, jurisdictions that export carbon-intensive fuels often appear to have disproportionately low climate impacts relative to the emissions they enable elsewhere.
This paper introduces the Composite Climate Responsibility Index (CCRI), a lifecycle-based, population-normalized metric that integrates direct emissions with upstream and industrial contributions to provide a more comprehensive assessment of climate responsibility. By incorporating territorial emissions, extraction activities, processing emissions, and upstream methane releases, CCRI captures the complete climate burden associated with fossil fuel production. Normalizing by population further facilitates equitable comparisons among jurisdictions of vastly different sizes.
The resulting framework reveals that many energy-exporting states possess per-capita climate burdens several times larger than those suggested by conventional inventories. CCRI offers policymakers, researchers, and the public a more representative metric for evaluating climate responsibility and designing equitable mitigation strategies.
1. Introduction
Climate policy has historically focused on territorial greenhouse gas inventories reported under the United Nations Framework Convention on Climate Change (UNFCCC). These inventories assign emissions to the jurisdiction in which they physically occur. While appropriate for international reporting, territorial accounting does not fully represent the climate impacts associated with fossil fuel production.
For example, coal mined in Wyoming may ultimately be combusted in Texas or overseas. Natural gas extracted in Pennsylvania may be liquefied in Louisiana and consumed in Europe or Asia. Existing inventories allocate combustion emissions to the point of use while largely excluding the upstream activities that make fossil fuel consumption possible.
This accounting structure creates a disconnect between production and responsibility. Fossil fuel-producing regions often exhibit relatively modest reported emissions despite facilitating substantially larger global greenhouse gas releases.
The Composite Climate Responsibility Index addresses this limitation by expanding the accounting boundary to include the entire fossil fuel production chain.
2. Conceptual Framework
Climate responsibility extends beyond smokestacks and tailpipes.
Every fossil fuel undergoes a sequence of climate-relevant processes before combustion:
Exploration
Extraction
Processing
Transportation
Storage
Distribution
Combustion
Current inventories emphasize the final stages while giving comparatively little weight to the earlier phases, despite substantial emissions from methane leakage, venting, flaring, compressor stations, refineries, LNG facilities, and petrochemical complexes.
The CCRI recognizes these emissions as integral components of fossil fuel production rather than incidental byproducts.
3. Definition of the Composite Climate Responsibility Index
The Composite Climate Responsibility Index is defined as
(E_{\text{territorial}}) represents direct greenhouse gas emissions occurring within the jurisdiction;
(E_{\text{upstream}}) represents methane leakage, venting, flaring, compressor emissions, gathering systems, and other fugitive emissions occurring prior to end-use combustion;
(E_{\text{processing}}) represents emissions associated with petroleum refining, LNG facilities, petrochemical production, natural gas processing plants, and related industrial infrastructure;
(E_{\text{extraction}}) represents emissions directly associated with coal mining, oil production, natural gas extraction, drilling, pumping, and associated operations;
(P) represents the jurisdiction’s population.
The resulting metric is expressed as
metric tons CO₂-equivalent per capita per year.
4. Advantages Over Traditional Inventories
Traditional greenhouse gas inventories answer the question:
“How much greenhouse gas is emitted inside this state?”
CCRI instead asks:
“How much climate forcing is generated because this state produces fossil fuels?”
This distinction fundamentally changes state rankings.
Large population centers often dominate territorial emissions because of transportation and electricity demand.
However, production-based accounting reveals that relatively small states can exert disproportionately large global climate impacts through fossil fuel extraction and processing.
5. Components of the Index
5.1 Territorial Emissions
These include all greenhouse gases released within state boundaries, including
electricity generation
transportation
industrial processes
residential and commercial energy use
agriculture
waste management
These values are generally available through EPA greenhouse gas inventories.
5.2 Upstream Emissions
Upstream emissions include
methane leakage
venting
flaring
abandoned wells
gathering pipelines
compressor stations
storage facilities
Methane is particularly important because its near-term warming potential greatly exceeds that of carbon dioxide.
Failure to include upstream methane significantly underestimates the climate burden of natural gas production.
5.3 Processing Emissions
Processing emissions include
oil refining
LNG liquefaction
petrochemical production
fertilizer manufacturing
hydrogen production from fossil fuels
natural gas processing
Many refining states emit relatively modest territorial greenhouse gases compared with the enormous climate impacts associated with processing fossil fuels destined for global markets.
5.4 Extraction Emissions
Extraction includes
coal mining
drilling operations
hydraulic fracturing
pumping
mining equipment
dewatering
mine methane
associated infrastructure
Coal-producing regions often exhibit exceptionally large extraction-related emissions.
6. Why Population Matters
Absolute emissions measure scale.
Per-capita emissions measure responsibility.
Population normalization allows meaningful comparisons between states of vastly different sizes.
For example, Texas produces the largest absolute climate burden in the United States because of its enormous oil, gas, refining, petrochemical, and power sectors.
Conversely, Wyoming’s small population means that its production-related emissions translate into one of the highest per-capita climate burdens in the world.
Thus, CCRI distinguishes between total contribution and individual responsibility.
7. Policy Applications
CCRI provides policymakers with several advantages.
It can
identify regions with disproportionate upstream emissions;
improve methane reduction strategies;
prioritize investments in emissions monitoring;
support equitable climate policy;
inform carbon pricing mechanisms;
evaluate fossil fuel subsidies;
guide transition assistance for energy-producing regions;
improve state-to-state comparisons.
Because CCRI incorporates lifecycle emissions, it aligns more closely with the physical drivers of climate change than territorial inventories alone.
8. Illustrative Results
Applying the framework to U.S. states suggests that fossil fuel-producing regions dominate per-capita climate responsibility.
Illustrative rankings include:
Wyoming
North Dakota
West Virginia
New Mexico
Louisiana
Alaska
Oklahoma
Texas
Pennsylvania
Kentucky
These rankings differ substantially from traditional greenhouse gas inventories, which are dominated by population size rather than fossil fuel production.
9. Limitations
Like all composite indicators, CCRI depends on the quality of underlying datasets.
Future refinements should incorporate
satellite methane observations,
lifecycle emission factors,
temporal variability,
exported fossil fuel carbon content,
uncertainty analysis,
probabilistic confidence intervals.
Additional weighting schemes may also be developed to distinguish short-lived climate pollutants from long-lived greenhouse gases.
10. Conclusion
The Composite Climate Responsibility Index represents a significant advancement in greenhouse gas accounting by extending responsibility beyond territorial emissions to encompass the complete fossil fuel production chain. It recognizes that extraction, processing, and upstream methane emissions are not peripheral activities but essential components of the carbon economy.
By integrating these sources and normalizing by population, CCRI offers a more comprehensive measure of climate responsibility than traditional inventories. It reveals that many jurisdictions with modest reported emissions play an outsized role in enabling global fossil fuel consumption, while densely populated states often appear less carbon-intensive when viewed through a production-based lens.
As climate policy evolves toward lifecycle accounting and supply-side mitigation, the Composite Climate Responsibility Index provides a transparent, scalable, and scientifically grounded framework for evaluating the true climate burden associated with fossil fuel production. It complements existing territorial inventories rather than replacing them, offering decision-makers a broader perspective on responsibility, equity, and the pathways toward effective emissions reduction.