bookmark_borderClimate-Accelerated Flooding in Delaware and Chester Counties: The Brandywine Creek Threat

by Daniel Brouse
December 2, 2025

Mapping by the U.S. Geological Survey (USGS) highlights Brandywine Creek, the Christina Basin, and multiple watersheds across Delaware County as major flood-risk zones—an assessment that aligns with the region’s accelerating exposure to extreme weather. The USGS flood inundation maps show that the Brandywine is especially prone to rapid rises in water level during heavy rainfall events, often swelling far beyond its banks and inundating nearby neighborhoods, roadways, and infrastructure.

Several factors compound this vulnerability:

• Increased rainfall intensity
Climate data show that the Mid-Atlantic is experiencing more frequent high-intensity rainstorms, with total precipitation delivered in fewer, more extreme bursts. This overwhelms the creek’s capacity and turns tributaries into fast-moving flood channels.

• Watershed geometry and urbanization
Much of Delaware County lies in narrow river valleys with steep topography, which funnels rainfall directly into creeks and accelerates runoff. As urban development expands—adding impervious surfaces such as asphalt and concrete—the watershed loses its natural ability to absorb water, amplifying flash-flood potential.

• Aging and undersized infrastructure
Stormwater systems in many of these communities were not designed for 21st-century rainfall extremes. As a result, drainage networks back up quickly, turning what would once have been manageable floods into dangerous, property-damaging events.

• Climate-driven amplification
Warming oceans and atmospheric moisture increases—roughly 7% more water vapor available in the atmosphere per 1°C of global warming—supercharge storms in the region. This means each storm has the potential to deliver far more rain in a shorter timeframe, a trend consistent with the catastrophic floods the Brandywine watershed has experienced in recent years (e.g., the remnants of Hurricane Ida).

As a result, Delaware and Chester Counties are now among the fastest-escalating inland flood zones in the Mid-Atlantic, with climate-driven rainfall extremes transforming what were once episodic flood events into recurrent, high-impact disasters. Homes, businesses, schools, roadways, critical utilities, and regional transportation corridors along Brandywine Creek, Chester Creek, Darby Creek, and their tributaries face increasing year-over-year risk as the hydrologic regime becomes more volatile.

Chester County: Critical Infrastructure at High Risk

In Chester County, vulnerability extends well beyond residential flooding. The county’s wastewater system is centrally dependent on the Brandywine Creek, meaning multiple municipal sewage treatment facilities sit directly within high-risk floodplains. These facilities are increasingly exposed to:

  • Overbank flooding that can overwhelm treatment capacity
  • Structural inundation leading to electrical and pump failures
  • Raw sewage releases into the Brandywine and downstream into Wilmington’s water supply
  • Loss of operational access for emergency crews during severe flood stages

A major breach or system failure would trigger cascading public-health hazards, contaminate drinking water infrastructure, and disrupt wastewater services for tens of thousands of residents.

Additionally, stormwater basins, dams, aging bridges, and low-lying roadways—many built decades before modern flood-risk standards—are failing more frequently under record rainfall. The increasing intensity of flash-flood events threatens life-safety response times, evacuation routes, and continuity of essential services.

Delaware County: Industrial Legacy + Rising Water = Compounding Hazard

In Delaware County, the risk is even more severe due to the region’s industrialized, low-lying riverfront, much of which was historically built on wetlands, marshlands, and filled swamp soils that were never engineered to withstand modern hydrologic extremes.

Along the Delaware River and lower creek systems, the county hosts:

  • Petroleum refineries and former refinery complexes
  • Bulk fuel storage farms and transfer terminals
  • Chemical manufacturing sites
  • Rail corridors carrying hazardous materials
  • Natural gas infrastructure and distribution hubs
  • Superfund and brownfield sites with residual contaminants in soil and groundwater

As climate-amplified flooding intensifies:

  • Rising groundwater mobilizes petroleum residues, solvents, and heavy metals trapped in fill soils.
  • Floodwaters can inundate storage tanks, pipelines, rail lines, and industrial yards, increasing the risk of spills or chemical releases.
  • Power outages combined with inundation threaten refinery pump systems, tank farm containment walls, and emergency shutoff controls.
  • Flood-driven erosion can undermine pipelines and buried utility conduits, increasing explosion or leak risk.

This combination of subsiding land, sea-level rise, industrial contamination, and extreme rainfall places Delaware County in a uniquely dangerous situation: a region where climate-accelerated flooding threatens not just property and infrastructure, but public health, the regional economy, and environmental stability.

USGS and NOAA both warn that without aggressive climate mitigation and local adaptation—such as updated floodplain zoning, expanded stormwater capacity, and restoration of natural wetlands—the region’s flood severity will continue to worsen as climate change accelerates.

* Our probabilistic, ensemble-based climate model — which incorporates complex socio-economic and ecological feedback loops within a dynamic, nonlinear system — projects that global temperatures are becoming unsustainable this century. This far exceeds earlier estimates of a 4°C rise over the next thousand years, highlighting a dramatic acceleration in global warming. We are now entering a phase of compound, cascading collapse, where climate, ecological, and societal systems destabilize through interlinked, self-reinforcing feedback loops.

What Can I Do?
The single most important action you can take to help address the climate crisis is simple: stop burning fossil fuels. There are numerous actions you can take to contribute to saving the planet. Each person bears the responsibility to minimize pollution, discontinue the use of fossil fuels, reduce consumption, and foster a culture of love and care. The Butterfly Effect illustrates that a small change in one area can lead to significant alterations in conditions anywhere on the globe. Hence, the frequently heard statement that a fluttering butterfly in China can cause a hurricane in the Atlantic. Be a butterfly and affect the world.
Tipping points and feedback loops drive the acceleration of climate change. When one tipping point is breached and triggers others, the cascading collapse is known as the Domino Effect.

The Human Induced Climate Change Experiment

bookmark_borderPolar Amplification and the Collapse of Climate Stability: How Shrinking Temperature Gradients Are Driving Extreme Weather

By Daniel Brouse and Sidd Mukherjee
December 1, 2025

The rapid escalation of extreme weather across the planet is not random—it is tied directly to one of the clearest signatures of anthropogenic climate change: polar amplification, the phenomenon in which the Arctic and Antarctic warm much faster than the global average. The resulting shrinkage in the temperature gradient between the equator and the poles is destabilizing the fundamental circulation systems that have governed Earth’s climate for thousands of years.

This loss of contrast—once the engine of atmospheric order—is now ushering in a new era of climatic chaos.

How Polar Amplification Destabilizes the Planet

Normally, large temperature differences between the tropics and the poles help maintain a fast, well-organized jet stream in the upper atmosphere and a powerful ocean circulation in the North Atlantic known as the Atlantic Meridional Overturning Circulation (AMOC). These systems work together to redistribute heat, prevent stagnation, and maintain seasonal predictability.

But as the Arctic warms nearly four times faster than the global average, and as the Antarctic undergoes record ice loss, these temperature gradients are collapsing.

Two Major Climate Systems Have Now Crossed Tipping Points

Recent observations indicate that:

1. The Jet Stream
Once strong and relatively stable, the jet stream is weakening and meandering. With less temperature contrast to drive it, the flow now stalls, buckles, and forms persistent “omega blocks” and polar vortex leaks that trap extreme weather in place.

2. The AMOC
Freshwater from accelerating Arctic melt is disrupting the sinking of salty, dense water in the North Atlantic—a key driver of the AMOC. Multiple studies now show significant weakening, with early-stage collapse signatures emerging.

Both systems now oscillate directly over the North and Mid-Atlantic United States. Pennsylvania, situated beneath these interacting instabilities, has become a frontline example of climate volatility.

Pennsylvania: A Case Study in Rapid Climate Whiplash

In recent years—and especially in 2025—Pennsylvania has experienced dramatic climate swings that would have been statistically implausible just decades ago.

  • A record-wet spring driven by atmospheric rivers brought weeks of torrential rainfall.
  • This was followed almost immediately by drought conditions and repeated heat domes.
  • By late autumn, a stalled polar vortex plunged temperatures across much of the United States while drought re-emerged across the region.

These contradictions reflect a climate no longer anchored by stable circulation but instead governed by chaotic oscillations.

Rossby Waves: The Engine of Weather Extremes

Rossby waves—large meanders in the jet stream—are now amplified by polar warming. Their exaggerated loops trap weather systems, leading to:

  • Prolonged floods
  • Stalled heat domes
  • Flash droughts
  • Severe cold outbreaks

This “hydrologic whiplash” is a textbook example of nonlinear climate acceleration.

Late 2025: Polar Regions Show Record-Breaking Instability

As of November 2025, climate monitoring agencies report extreme conditions at both poles:

Antarctica

  • Lowest November sea ice extent on record
  • Regions near the Amundsen and Bellingshausen seas recorded extreme above-average temperatures
  • Large portions of ice shelves continue unprecedented thinning

Arctic

  • Second-warmest November ever recorded
  • Third-lowest November sea ice extent
  • Atmospheric temperatures soared above historical norms from Alaska to Siberia

These are not anomalies—they are acceleration signals.

Extreme Events of 2025 Illustrate a System in Breakdown

Hurricane Melissa: A New Benchmark for Rapid Intensification

Melissa ranks among the most explosively intensifying hurricanes in Atlantic history.

  • Winds doubled from 70 mph to 140 mph in only 18 hours
  • One of the fastest 24-hour intensification rates ever observed
  • Warm waters and decreased wind shear—both outcomes of climate warming—created ideal conditions

Rapid intensification is becoming the rule, not the exception.

Asia’s Twin Cyclone Catastrophe: A Rare and Deadly Event

The November 2025 rainstorms and landslides across Southeast Asia now rank among the region’s most devastating disasters in decades.

Severity Highlights:

  • Death toll exceeds 1,150 across Indonesia, Sri Lanka, Thailand, Malaysia, the Philippines, and Vietnam
  • Hat Yai, Thailand recorded 335 mm (13 in) of rain in a single day—the highest in 300 years
  • Cyclone Senyar formed in the Malacca Strait, only the second cyclone ever documented there
  • Infrastructure collapse affected over four million people
  • Catastrophic flooding and landslides followed back-to-back typhoons and monsoon rains

The rarity of these events reflects a system moving into previously uncharted territory.

The Broader Picture: A Climate System Entering Nonlinear Instability

What we are now witnessing is the combined outcome of:

  • Shrinking equator-to-pole temperature gradients
  • Jet stream destabilization
  • AMOC weakening
  • Accelerated polar melt
  • Intensification of Rossby waves
  • Record-breaking sea surface temperatures
  • Cascading feedback loops and tipping-point interactions

This is not simply “more extreme weather.” It is the emergence of a chaotic, nonlinear climate regime in which extremes intensify, persist, and compound in ways early climate models never captured.

The climate is no longer shifting gradually—it is reorganizing.

* Our probabilistic, ensemble-based climate model — which incorporates complex socio-economic and ecological feedback loops within a dynamic, nonlinear system — projects that global temperatures are becoming unsustainable this century. This far exceeds earlier estimates of a 4°C rise over the next thousand years, highlighting a dramatic acceleration in global warming. We are now entering a phase of compound, cascading collapse, where climate, ecological, and societal systems destabilize through interlinked, self-reinforcing feedback loops.

What Can I Do?
The single most important action you can take to help address the climate crisis is simple: stop burning fossil fuels.

Tipping points and feedback loops drive the acceleration of climate change. When one tipping point is toppled and triggers others, the cascading collapse is known as the Domino Effect.

The Human Induced Climate Change Experiment

bookmark_borderSudden Sea Level Pulses: How “Cork Release” Ice-Sheet Failures Could Rapidly Reshape Global Coastlines

By Daniel Brouse and Sidd Mukherjee

November 25, 2025

Introduction: The Shift From Gradual to Abrupt Sea Level Rise

Sea level rise (SLR) is one of the most revealing indicators of the accelerating pace of climate change. A century ago, global SLR was doubling roughly every 100 years. Ten years ago the doubling time had collapsed to a decade. By 2023, the doubling time had plunged to only two years.

This extraordinary acceleration led us to focus on a much more dangerous and poorly modeled phenomenon:

Sudden Sea Level Pulses (SSLPs) — rapid, stepwise jumps in sea level triggered by abrupt ice-sheet failures, subglacial “cork release” events, and ice-shelf structural collapse.

These pulses are not hypothetical. They are beginning to occur.

Examples include:

  • Greenland Subglacial Flood: A massive outburst where trapped meltwater burst through the ice, demonstrating the potential for sudden hydrofracture.
  • Alaska’s Mendenhall Glacier Outburst: A glacial flood that produced rapid, dangerous water-level increases downstream.

A detailed overview is archived at:
http://membrane.com/global_warming/Greenland-Ouburst.html

These events reveal something ice-sheet models have not yet fully integrated: meltwater can accumulate beneath ice until pressure surpasses structural integrity, causing the ice surface to fail catastrophically — a “cork release.” When this occurs at scale, sea levels can jump not millimeters per year, but multiple feet per year.

Why This Matters: The Risk of Abrupt, Multi-Foot Sea Level Jumps

The public still imagines sea level rise as a slow, linear process. But the Earth system does not behave linearly. When hydrofracture and ice-cliff collapse become common, we could face:

  • Multi-foot sea level increases within a single decade
  • 1–3 feet of rise within a single year in extreme pulse scenarios
  • Little or no time for adaptation in cities like Miami, New York, Mumbai, Lagos, and Shanghai

Current global climate models fail to incorporate most “cork release” pathways because:

  • Subglacial water transport is poorly mapped
  • Meltwater storage and pressurization are not well parameterized
  • Ice-shelf fracture mechanics are only partially resolved
  • Positive feedback loops — such as meltwater-driven lubrication and ice-cliff collapse — are not modeled dynamically

The Greenland outburst events show that ice sheets can undergo abrupt, nonlinear failures — far faster than infrastructure, economies, or governance systems can adapt.

Sidd summarized it best:

“Under-ice hydrology is hard to observe… but once enough pressure builds, ice doesn’t melt — it fractures.”

Antarctica: The System Most Likely to Produce Catastrophic Pulses

While Greenland contributes meaningfully to long-term SLR, Antarctica is the critical risk for abrupt sea level pulses.

The East Antarctic Ice Sheet (EAIS)

  • Holds ~170 feet of potential sea level rise
  • Once thought stable for millennia
  • Now showing early signs of warming-driven destabilization
  • Marine-based sectors may begin collapsing this century

The West Antarctic Ice Sheet (WAIS)

  • Highly vulnerable
  • Resting on retrograde (downward-sloping) bedrock
  • Warm ocean water is eroding the shelves from below
  • Pinning points are failing, which removes the natural “brakes”

Sidd’s assessment:

Greenland: “Effectively lost,” 100–300 years, +20 ft
West Antarctica: Likely collapse within decades to ~100 years, +10 ft

Total plausible rise by 2125: 20–30 feet, with the possibility of sudden pulses:

“We could dawdle along at half an inch a year, then see a few years at a foot per year.”

New Evidence: The Impending Failure of Thwaites Eastern Ice Shelf (TEIS)

In November 2025, Advancing Earth and Space Sciences published a landmark study:
“Evolution of Shear-Zone Fractures Presages the Disintegration of Thwaites Eastern Ice Shelf”
(https://agupubs.onlinelibrary.wiley.com/doi/10.1029/2025JF008352)

The TEIS is a keystone structure. Once it collapses, the glacier behind it — the “Doomsday Glacier” — will accelerate dramatically. The study found:

Key Findings

  1. Long-term shear fracturing (2002–2017):
    Large fractures formed parallel to flow as the shelf strained against its pinning point.
  2. Recent explosive tensile fracturing (2017–2022):
    Smaller, orthogonal fractures began proliferating, indicating that structural integrity is failing.
  3. Dynamic destabilization:
    Satellite and GPS data reveal velocity perturbations rippling across the shelf as fractures expand — a sign of imminent collapse.
  4. Transition of the pinning point from stabilizer to destabilizer:
    Echoing Benn et al. (2022), the pinning point now increases fracture stress instead of reducing it.
  5. Self-reinforcing feedback loop:
    The shelf appears to be entering the “damage-acceleration-damage” feedback proposed by Lhermitte et al. (2020), a hallmark of impending disintegration.

What This Means

When TEIS collapses — an event many glaciologists now expect within years to a decade — Thwaites Glacier could:

  • accelerate dramatically
  • initiate ice-cliff collapse
  • trigger multi-foot sea level pulses within short timescales

This is the largest currently unfolding structural failure in the cryosphere.

Cork-Release Events: A Distinct Class of Tipping Point

We define a “cork release” event as:

A sudden failure of ice or subglacial pressure systems causing rapid, high-volume discharge of water or ice into the ocean.

These events include:

  • subglacial lake drainage
  • rapid ice-shelf collapse
  • meltwater-driven hydrofracture
  • ice-cliff structural failure

Unlike gradual melt, cork-release events:

  • are nonlinear
  • occur suddenly
  • accelerate with warming
  • have global consequences within months to years
  • are triggered by thresholds that are difficult to predict

This makes them one of the most dangerous — and least modeled — climate feedbacks.

Conclusion: The Urgent Need to Model Abrupt Sea Level Change

The climate system is not simply warming. It is accelerating, destabilizing, and producing events far outside historical norms. Sea level rise will not be a smooth curve; it will be stepwise, punctuated by abrupt pulses.

To prepare for what is coming, climate science and adaptation planning must incorporate:

  • ice-shelf fracture dynamics
  • under-ice hydrology
  • subglacial pressurization
  • ice-cliff collapse physics
  • nonlinear feedbacks
  • sudden sea level pulse scenarios

Human systems are built for gradual change. The cryosphere is not.

The question is no longer if abrupt sea level pulses will occur — but how soon, how large, and how many.

* Our probabilistic, ensemble-based climate model — which incorporates complex socio-economic and ecological feedback loops within a dynamic, nonlinear system — projects that global temperatures are becoming unsustainable this century. This far exceeds earlier estimates of a 4°C rise over the next thousand years, highlighting a dramatic acceleration in global warming. We are now entering a phase of compound, cascading collapse, where climate, ecological, and societal systems destabilize through interlinked, self-reinforcing feedback loops.

What Can I Do?
The single most important action you can take to help address the climate crisis is simple: stop burning fossil fuels. There are numerous actions you can take to contribute to saving the planet. Each person bears the responsibility to minimize pollution, discontinue the use of fossil fuels, reduce consumption, and foster a culture of love and care. The Butterfly Effect illustrates that a small change in one area can lead to significant alterations in conditions anywhere on the globe. Hence, the frequently heard statement that a fluttering butterfly in China can cause a hurricane in the Atlantic. Be a butterfly and affect the world.

→ “Solutions to the Fossil Fuel Economy and the Myths Accelerating Climate and Economic Collapse.“

Tipping points and feedback loops drive the acceleration of climate change. When one tipping point is toppled and triggers others, the cascading collapse is known as the Domino Effect.

The Human Induced Climate Change Experiment

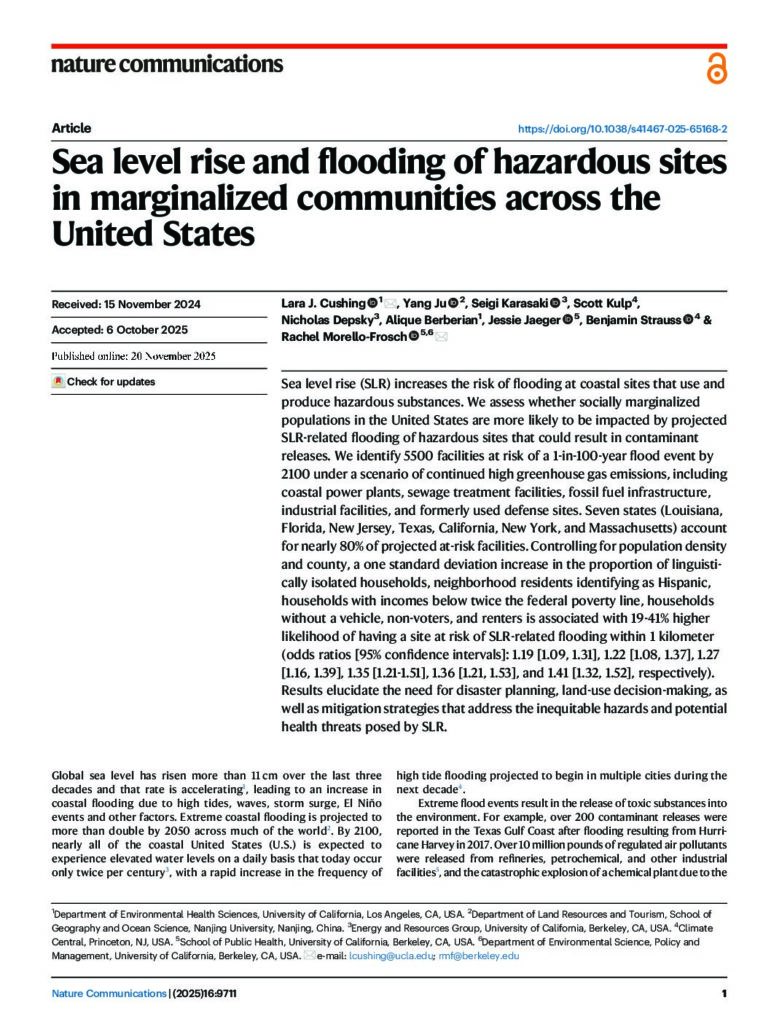
bookmark_borderFlooding at Coastal Sites That Use and Produce Hazardous Substances

Sea level rise and flooding of hazardous sites in marginalized communities across the United States
Published in Nature / 20 November 2025

Sea level rise (SLR) increases the risk of flooding at coastal sites that use and produce hazardous substances. We assess whether socially marginalized populations in the United States are more likely to be impacted by projected SLR-related flooding of hazardous sites that could result in contaminant releases. We identify 5500 facilities at risk of a 1-in-100-year flood event by 2100 under a scenario of continued high greenhouse gas emissions, including coastal power plants, sewage treatment facilities, fossil fuel infrastructure, industrial facilities, and formerly used defense sites. Seven states (Louisiana, Florida, New Jersey, Texas, California, New York, and Massachusetts) account for nearly 80% of projected at-risk facilities. Controlling for population density and county, a one standard deviation increase in the proportion of linguistically isolated households, neighborhood residents identifying as Hispanic, households with incomes below twice the federal poverty line, households without a vehicle, non-voters, and renters is associated with 19-41% higher likelihood of having a site at risk of SLR-related flooding within 1 kilometer.

Flooding at Coastal Sites That Use and Produce Hazardous Substances

Flooding at Coastal Sites That Use and Produce Hazardous Substances

bookmark_borderThe Physics Behind the 252-mph Gust: Why Hurricane Melissa Signals a New Era of Extreme Storms

By Daniel Brouse / November 19, 2025

Hurricane Melissa recorded a 252 mph wind gust, which shatters the previous highest record of 248 mph from Typhoon Megi in 2010, according to UCAR.

If you’re interested in flow dynamics… this is the highest verified hurricane wind speed ever recorded on Earth.

Climate change is increasing both the frequency and the intensity of extreme systems because the added thermal energy in the climate system does not stay as “heat” — it expresses itself through non-linear atmospheric dynamics. Warmer oceans load storms with more latent heat, more moisture, and stronger pressure gradients. That extra energy then appears as faster wind velocities, more violent updrafts, tighter eyewalls, and explosive rapid intensification cycles that didn’t occur at today’s frequency in the past.

In other words, we aren’t just “warming the air.”
We’re supercharging the fundamental physics of storms — momentum, turbulence, vorticity, and flow — which is why records like this are being broken more often and with greater severity.

The atmosphere is running on a different set of rules now — not because anyone “believes” in climate change, but because the math and the measurements leave no room for debate.

Start with the simplest fact in atmospheric science:
A warmer atmosphere holds about 7% more water vapor per 1°C of warming. That’s not a theory — that’s the Clausius–Clapeyron relation, a physical law.

We’ve warmed the planet more than 1°C already. That means storms today have 10–15% more moisture available, which translates directly into dramatically more energy and more violent rain.

Now connect this to flow dynamics:

1. Violent Rain: Mass × Velocity = Momentum

Raindrop size is increasing. Raindrop count is increasing.
And storms are producing higher wind velocities, which accelerate the droplets further.

Momentum p=mv.

More mass → more momentum.
More velocity → more momentum.
More momentum → more turbulence, more kinetic energy, more destructive power.

This isn’t speculation — it’s measurable.

2. Energy Release: Latent Heat

That extra water vapor carries enormous latent heat.
When it condenses, it releases energy that intensifies updrafts, pressure gradients, and storm organization. This creates:

  • faster strengthening
  • more explosive rainfall rates
  • more dangerous mesoscale convective systems
  • more catastrophic flash floods

This is why storms that used to drop 1–3 inches now dump 5–15 inches in a day.

3. Flow Dynamics After Rainfall

Once water hits the ground, the physics get even more brutal.

Force scales with the square of velocity (v²).

A 40 mph flow has 16× the force of a 10 mph flow.
And water is ~800× denser than air.

That is why modern flash floods move cars, rip out culverts, scour foundations, and carve out roads in seconds.

4. What You’re Calling “Not Climate Change”

The real world says otherwise:

  • Record-breaking rainfall events are happening at 4× the historical rate.
  • “1,000-year floods” are now occurring every few years.
  • Storms are intensifying faster and producing higher peak rainfall.
  • Several regions have already documented rainfall rates once considered meteorologically impossible.

This isn’t politics.
This isn’t a belief system.
This is physics — and we are watching it unfold in real time.

So yes… Climate change. Absolutely climate change.

Footnotes

NCAR has confirmed the 252 mph dropsonde gust in Hurricane Melissa as legitimate. Yes — it’s the highest ever recorded by a dropsonde and essentially tied with Cyclone Olivia’s 253 mph gust measured with ground instruments.

But focusing on whether it’s 1 mph higher or lower is meaningless in context. A 1 mph difference is statistically irrelevant when you’re dealing with storms undergoing record-breaking rapid intensification, unprecedented energy transfer, and historic drops in barometric pressure. These are the metrics that matter scientifically — and they’re the ones that are changing fastest.

The real story isn’t the bragging rights of a single gust measurement.
It’s that we are now routinely seeing:

  • extreme pressure falls that used to be once-in-a-lifetime events,
  • rapid intensification windows that defy past climatology,
  • and nonlinear energy spikes driven by warm SSTs and excess atmospheric moisture.

Melissa’s 252 mph gust is just one data point in a larger pattern: tropical cyclones are entering regimes of intensity that were virtually unknown in the pre-warming climate.

Recent Papers

The Human Induced Climate Change Experiment

bookmark_borderThe Physics of Violent Rain: Turning Ordinary Storms Into Catastrophic Events

by Daniel Brouse and Sidd Mukherjee
November 18, 2025

We’ve been working specifically on the physics of what we now call violent rain, and once you fully understand latent heat, the entire climate system reveals a deeper and far more alarming complexity. Latent heat is not just a chapter in a textbook; it is the engine behind much of Earth’s atmospheric power. But the energy budget is only the entry point. The way that energy manifests — through momentum, turbulence, pressure gradients, and flow dynamics — is some of the most elegant, and now increasingly dangerous, mathematics in climate science.

The fatal mistake many people make is equating “global warming” strictly with warmer temperatures. The additional heat does not simply remain as heat. It is continually exchanged, transformed, and expressed throughout the climate system. It reappears as massive increases in atmospheric moisture, sharper pressure differentials, explosive updrafts, and an atmosphere filled with stored potential energy waiting for the right trigger to be released.

A warmer atmosphere can hold about 7% more water for every 1°C of warming. Over the full temperature anomaly we are now entering, this increased capacity nearly doubles the amount of moisture available to A warmer atmosphere can hold about 7% more water for every 1°C of warming. Over the full temperature anomaly we are now entering, this increased capacity nearly doubles the amount of moisture available to storms. This is not theoretical — it is already transforming rainfall dynamics worldwide. Parts of the world, especially the poles, are now experiencing temperature anomalies that remain more than 22°C above normal for extended periods, supercharging atmospheric moisture and destabilizing global circulation patterns.

One of the most overlooked consequences of this added energy is the rise in both raindrop size and raindrop count. Larger droplets fall faster, strike harder, and inject more energy into the air column, intensifying turbulence. Upon impact with the ground, they deliver far more kinetic energy than raindrops did even a generation ago. Using the momentum relation p = mv:

  • As mass increases, momentum increases.
  • As velocity increases, momentum increases.

More momentum means more turbulence, more kinetic energy, and more destructive rainfall.

People already sense this intuitively — the louder impact of rain on roofs, water bouncing higher off pavement, and downpours that feel physically heavier — but few connect these sensations to the underlying physics.

The destructive power of violent rain actually begins before the drops reach the ground. As storms intensify, raindrops become larger and wind velocities rise, accelerating them horizontally and vertically. Because both m (mass) and v (velocity) increase, each raindrop carries significantly more momentum than in past climates.

Stronger horizontal winds effectively act as a second gravitational pull, increasing the angle and force of impact. This is why wind-driven rain can sting the skin, shred crops, strip leaves from trees, and erode soils far more quickly than vertical rainfall alone. The increased velocity also injects more energy into the air column, amplifying turbulence, updraft strength, and pressure gradients — processes that feed storm intensification.

Once the water reaches the ground, flow dynamics dominate. Force scales with the square of velocity (v²), and density multiplies that force dramatically:

  • A 20 mph wind exerts 4× the force of a 10 mph wind.
  • A 40 mph wind exerts 16× the force.
  • A 60 mph wind exerts 36× the force.

Now apply the same physics to water, which is ~800 times denser than air:

  • A shallow 10 mph sheet of runoff exerts 800× the force of a 10 mph wind.
  • At 20 mph, the force becomes 3,200×.
  • At 40 mph — common in debris-laden flash floods — the force jumps to 12,800×.

When storms produce larger raindrops and faster-moving rain, driven by extreme heat anomalies and stronger wind fields, the resulting flows carry exponentially greater destructive potential. This is why hillsides fail more quickly, roads wash out more often, and floodwaters rise and accelerate with far greater violence in a warming climate — and why these events are unfolding years to decades ahead of earlier projections.

As rainfall intensity spikes, so do these destructive flow forces. This is why modern storms overwhelm culverts, stormwater systems, levees, dams, and hillside soils. It’s why slopes liquefy, bridges scour, and infrastructure collapses in events that used to be considered “routine.”

The mathematics is beautiful — but the consequences are devastating. Violent rain is not a metaphor — it is the physical expression of a climate system carrying far more energy, mass, and momentum than it did just a few decades ago. And every additional fraction of a degree adds more fuel to that system.

For anyone watching closely, the evidence is not abstract. It’s outside your window.

The Climate Crisis: Violent Rain | Extreme Weather Events | Insurance | Soil | Updates

The Human Induced Climate Change Experiment

bookmark_border2025’s Catastrophic Triple‐Threat: EF-5 Tornado, Category 5 Hurricane & G5 Geomagnetic Storm

By Daniel Brouse
November 13, 2025

If confirmed, 2025 would be the first year in recorded history to experience an EF-5 tornado, a Category 5 hurricane, and a G5 geomagnetic storm all within the same calendar year — a convergence of atmospheric and space-weather extremes unlike anything previously documented.

Earth’s Systems in Overdrive

While each of these events operates in distinct domains — atmospheric, oceanic, and heliophysical — their occurrence within a single year underscores the accelerating volatility of Earth’s interconnected systems.

  • EF-5 tornadoes represent the most violent wind events on the planet, with speeds exceeding 200 mph and capable of leveling entire communities.
  • Category 5 hurricanes are the apex of tropical cyclone intensity, driven by ocean surface temperatures that have now repeatedly shattered records due to climate-induced warming.
  • G5 geomagnetic storms arise from the Sun’s eruptions — particularly coronal mass ejections (CMEs) — which slam into Earth’s magnetosphere, generating auroras visible across continents and posing risks to satellites, power grids, and communications systems.

Solar Storm Update: The First Potential G5 of 2025

If confirmed, this event would be the first recorded G5 geomagnetic storm of 2025. Currently, forecasts indicate the storm could reach G5 levels, though as of now it remains at G4 (severe) intensity pending final assessment by NOAA’s Space Weather Prediction Center (SWPC).

This storm has already produced multiple X-class solar flares and “cannibal CMEs” — instances where fast eruptions overtake slower ones, merging into powerful shock waves. If the storm is officially upgraded, it will join the small handful of G5-class events observed since measurements began in the 20th century, including the May 2024 event that caused widespread auroras and satellite disruptions.

A Year of Extreme Energy

2025 has already shattered climate and space-weather norms.

  • Global sea surface temperatures have remained at all-time highs for over a year, fueling record-strength hurricanes and flash droughts.
  • Atmospheric CO₂ concentrations are now above 427 ppm, continuing the steep rise that drives planetary energy imbalance.
  • Tornado and flood activity in the U.S. have been intensified by shifting jet streams and atmospheric instability tied to warming patterns.
  • In parallel, the Sun is nearing its Solar Maximum, with heightened solar activity expected through 2026.

A Warning from Nature and Physics

These converging extremes — in the atmosphere, oceans, and magnetosphere — demonstrate how Earth’s energy systems are now operating closer to physical and thermodynamic limits.
The EF-5, Category 5, and potential G5 are not random coincidences; they’re manifestations of a planet under compound stress, where terrestrial and solar dynamics can amplify one another through complex feedbacks.

If confirmed, 2025 will stand as a pivotal year — one that highlights both the escalating instability of Earth’s climate system and the profound vulnerability of our technological civilization to forces far beyond our control.

The Human Induced Climate Change Experiment

bookmark_borderRunaway Climate Feedbacks and Systemic Collapse

Daniel Brouse and Sidd Mukherjee
September 3, 2025


Our probabilistic, ensemble-based climate model — incorporating complex socio-economic and ecological feedback loops within a dynamic, nonlinear system — projects that global temperatures could rise by as much as 9°C (16.2°F) within this century. This far exceeds earlier estimates, which predicted a 4°C rise over the next thousand years, and signals a dramatic acceleration of warming.

Sidd responded: “9°C this century is a stretch. Consensus so far is closer to ~3°C.”

I ask: What do you make of the physics given the observable data?
We’re already at 1.5°C, which makes 3°C this century seem almost unavoidable. I used to think 9°C was a worst-case scenario — now I fear it’s shifting toward the “highly likely” range. In just the last couple of years, I’ve seen at least nine tipping points trigger feedback loops with my own eyes.

What strikes me most is not just that each loop accelerates warming, but that they are now amplifying each other. The interactions are compounding in ways that exceed current models.

So my question is: What do you think about the physics of reaching 9°C this century, given the observed interactions of feedback loops and tipping points, including:

  • Greenland and East Antarctic ice sheet tipping
  • Slowing of the Atlantic Meridional Overturning Circulation (AMOC)
  • Mountain glacier loss
  • Amazon rainforest dieback
  • Arctic sea ice loss
  • Boreal forest degradation and wildfire
  • Permafrost thawing and burning
  • Warm-water coral bleaching
  • West Antarctic Ice Sheet instability

Sidd replied: “I think ~3°C is likely this century, and that estimate already includes tipping points. But of course, I could be wrong. The oceans have the last word — and they take centuries to drive a 9°C+ shift.”


The Arctic as a Harbinger

The Arctic is warming far faster than the global average — ~2–3°C already, about 3–4 times faster than the planet as a whole. Projections vary:

  • Low emissions (~1.5–2°C global): Arctic warms 3–5°C by 2100.
  • High emissions (~3–4°C global): Arctic warms 7–10°C by 2100, with even higher local spikes.
  • Worst-case runaway: With reinforcing tipping points (permafrost, albedo collapse, ocean disruption), Arctic warming could exceed 12°C this century.

Consequences include seasonal ice-free summers by mid-century, permafrost fires releasing CO₂ and methane, and destabilization of AMOC, accelerating sea-level rise and global weather extremes.


Global Runaway Feedbacks

If multiple tipping points reinforce each other, the climate may enter a self-perpetuating heating cycle beyond human control. The main candidates include:

  1. Ice-Albedo Collapse — Ice loss locks in warming.
  2. Permafrost Thaw + Boreal Fires — Gigatons of CO₂/CH₄ released.
  3. Amazon & Rainforest Dieback — Carbon sinks flip to carbon sources.
  4. Ocean Circulation Breakdown — Jet stream chaos, monsoon collapse, food shocks.
  5. Marine Ecosystem Collapse — Coral death and plankton loss undermine food security.
  6. Soil & Crop Failure Feedbacks — Drought, famine, and forced migration.

Temperature outcomes:

  • Linear physics: ~3–5°C by 2100.
  • With feedbacks: 6–9°C this century is plausible.
  • Runaway: A “Hothouse Earth” trajectory of 10°C+ over centuries–millennia.

Feedback-Driven Warming Beyond 1.5 °C

As global mean temperature exceeds 1.5 °C and multiple climate tipping points activate, the critical question is not simply how much warmer the planet becomes, but how quickly feedbacks amplify that warming.

Scientific consensus: Current models suggest that carbon-cycle feedbacks — permafrost thaw, weakening ocean and land sinks, methane release from wetlands, and fire-driven emissions — could add ~0.2–1.0 °C of warming by 2100 on top of direct human emissions. This range reflects assumptions that:

  • Warming is held close to ~2 °C by policy.
  • Tipping points unfold slowly and largely independently.
  • Ecosystems and oceans continue absorbing a significant share of emissions.

Under a high-emissions trajectory, with multiple tipping elements engaged, the upper end of this estimate (or beyond) becomes more plausible.

My concern: These consensus estimates are already lagging reality. Observations suggest that at least nine major tipping points are not only triggered but are now reinforcing each other. Instead of unfolding over centuries or millennia, the pace is measured in years or decades. Models have struggled to keep up with this rapid nonlinearity.


Cascading Feedbacks in Real Time

Regardless of the rise in global mean temperature, cascading feedbacks are already reshaping weather extremes.

In just ten days during July 2025, the U.S. experienced:

  • Hundreds of flash floods nationwide, with hundreds of fatalities and billions in damages.
  • At least five “1-in-1,000-year” rainfall events (Texas, New Mexico, North Carolina, Florida, Illinois).
  • Multiple “500-year floods” across Pennsylvania, Delaware, New Jersey, Maryland, Virginia, and Iowa as extreme rainfall overwhelmed infrastructure.

These events illustrate how tipping feedbacks manifest in human terms — not only as gradual warming, but as sudden escalations in climate volatility and infrastructure failure.


Permafrost: From Slow Thaw to Year-Round Fire

The permafrost is one of the starkest examples of the gap between theory and reality:

  • Old assumption: Permafrost would thaw gradually over thousands of years, steadily releasing CO₂ and CH₄ into the atmosphere.
  • Observed reality: Large regions are no longer “permanently” frozen. Instead, they are catching fire and burning year-round, releasing greenhouse gases on much shorter timescales.

This raises new scientific uncertainties:

  • Fires combust organic matter directly, accelerating CO₂ emissions.
  • If methane is burned in situ during these fires, some fraction may be converted into CO₂ (a less potent but still powerful greenhouse gas) — effectively acting as a “natural flare.”
  • Yet, unburned methane still escapes, and the net balance between flaring vs. direct release remains poorly quantified.

What is clear is that the pace of release is orders of magnitude faster than assumed, and the feedbacks are already active, not hypothetical.


What 9°C Warming Would Mean for Humanity

  • Uninhabitable Tropics — Wet-bulb > 31–35°C renders regions physiologically uninhabitable.
  • Multi-Meter Sea-Level Rise — Coastal megacities drowned.
  • Food System Collapse — Crop yields crash across tropics and mid-latitudes.
  • Oceanic Collapse — Fisheries and reefs vanish.
  • Mass Extinction — 50–70% of species lost.
  • Mass Mortality & Migration — Billions displaced, political collapse, conflict.
  • Refugia Shrink — Only high-latitude/high-altitude zones remain marginally habitable.

At this level, modern civilization likely collapses, with human survival reduced to scattered refugia.


Why “Global Average” Misleads

The idea of a global average temperature obscures human experience. For example, while the average may rise 3°C, some regions (like the Arctic) could see 10°C+ increases. What matters more is regional extremes and wet-bulb thresholds — the real determinants of human survival.


Wet-Bulb Heat: The Real Threat

Wet-bulb temperatures >31°C are already being observed in parts of the U.S. Gulf Coast, Florida, and Mississippi River Valley, with lethal consequences. These levels were once thought “impossible” in the U.S., but climate change is shifting baselines.

This metric — not the global average — is the clearest signal of existential risk to human health and survival.


Conclusion: Humanity’s Chosen Fate

The question is not whether Earth will warm — it is how fast, how far, and how violently feedbacks will accelerate the process. A 9°C rise this century may or may not occur, but even “consensus” outcomes (~3°C) would be catastrophic.

The decisive factor is human action: whether we allow runaway feedbacks to trigger an irreversible “Hothouse Earth,” or whether we cut emissions, restore ecosystems, and adapt quickly enough to keep habitable zones intact.

We are not just modeling the future — we are choosing it.

* Our probabilistic, ensemble-based climate model — which incorporates complex socio-economic and ecological feedback loops within a dynamic, nonlinear system — projects that global temperatures are becoming unsustainable this century. This far exceeds earlier estimates of a 4°C rise over the next thousand years, highlighting a dramatic acceleration in global warming. We are now entering a phase of compound, cascading collapse, where climate, ecological, and societal systems destabilize through interlinked, self-reinforcing feedback loops.

We examine how human activities — such as deforestation, fossil fuel combustion, mass consumption, industrial agriculture, and land development — interact with ecological processes like thermal energy redistribution, carbon cycling, hydrological flow, biodiversity loss, and the spread of disease vectors. These interactions do not follow linear cause-and-effect patterns. Instead, they form complex, self-reinforcing feedback loops that can trigger rapid, system-wide transformations — often abruptly and without warning. Grasping these dynamics is crucial for accurately assessing global risks and developing effective strategies for long-term survival.

The Human Induced Climate Change Experiment

bookmark_borderThe Accelerating Collapse of the AMOC–Jet Stream Feedback Loop

By Daniel Brouse
September 1, 2025

The Atlantic Meridional Overturning Circulation (AMOC) and the jet stream are unraveling much faster than science once believed possible. What was once thought to take millennia, and later centuries, has now accelerated into mere decades.

Earlier this year, I wrote about the unsettling transition from spring to summer in Pennsylvania. A damp, cool spring gave way almost overnight to record-breaking heat, scorching the state in the very first days of summer. At first glance, these whiplash conditions might seem like disconnected events. In reality, they are symptoms of a deeper crisis: the breakdown of Earth’s major circulation systems that once stabilized climate.

Two of the most important of these systems—the jet stream and the AMOC—have now crossed critical tipping points. Both govern weather across the North and Mid-Atlantic United States, and both systems now oscillate directly over Pennsylvania, placing the state in the crosshairs of instability.

Atmospheric and oceanic circulation normally work in tandem to transport thermal energy across the planet, preventing extremes. But as Arctic ice melt pours freshwater into the North Atlantic, the AMOC weakens. The sinking of dense, salty water that drives this great current is slowing, stalling the northward transport of heat. Meanwhile, the jet stream—once strong and stable—has grown irregular. With the temperature difference between the poles and the tropics shrinking, the jet stream now stalls, bends, and meanders, allowing cold Arctic air to linger while trapping heat in other regions.

The consequence is a climate marked by contradiction, where sudden swings between extremes are no longer anomalies but the new normal. What happened in Pennsylvania this year illustrates this shift: a record-wet spring with atmospheric rivers and torrential rains, followed almost immediately by drought and heat domes. Now, as summer fades to autumn, the pendulum has swung again—this time toward a stalled polar vortex draped across much of the United States.

Compounding this instability is the intensification of Rossby Waves, those giant meanders in the jet stream that now drive hydrologic whiplash. The alternating floods and droughts, combined with extremes of heat and cold, are signatures of a nonlinear, chaotic climate system spinning further out of balance.

Perhaps most alarming is the speed of this transformation. Earlier models projected AMOC collapse and jet stream destabilization unfolding over many centuries. But today, feedback loops between these systems are accelerating change by thousands of years beyond those initial predictions. If this trajectory continues, the Northeast could face summers that resemble swamps—hot, humid, and stifling—followed by winters of unprecedented severity.

The collapse is no longer theoretical. It is here, it is accelerating, and it is reshaping daily life in Pennsylvania and across the globe. The only real uncertainty left is how much worse it will get, and how quickly.

The Human Induced Climate Change Experiment

bookmark_borderAntarctica, Inevitable Sea-Level Rise, and the Cascading Impacts of Climate Change

By Daniel Brouse and Sidd Mukherjee
August 21, 2025

Introduction

The destabilization of Antarctica represents the single greatest existential threat to humanity. What was once viewed as a slow-moving process unfolding over millennia is now accelerating at a pace that outstrips scientific projections. The August 2025 paper,“Emerging Evidence of Abrupt Changes in the Antarctic Environment,” confirms that Antarctica is destabilizing far faster than anticipated, with abrupt and potentially irreversible shifts already underway.

This is not a distant warning—it is a present reality. Antarctica’s collapse threatens to unleash catastrophic sea-level rise, disrupt global ocean circulation, amplify planetary warming, and destabilize ecosystems on which billions of people depend. Its fate is intertwined with the fate of every coastal city, every agricultural system, and every human community on Earth.

For decades, scientists warned of tipping points in the Antarctic system. Today, evidence shows those tipping points have been crossed. What follows is not a gradual decline, but a cascade of rapid, nonlinear changes: collapsing ice shelves, accelerating glacial outflows, and the weakening of the Antarctic Overturning Circulation that regulates Earth’s climate balance.

The conclusion is unavoidable: the destabilization of Antarctica is not only the largest existential threat to humanity—it is the defining crisis of our time.

The Inevitable

For decades, Sidd Mukherjee has regarded Antarctica as the single greatest threat posed by climate change. As he often says, “Antarctica is the big one.”

If history is our guide, he’s right. During past warming periods, sea levels have risen episodically—long stretches of stability punctuated by sudden, dramatic surges. In the fastest episodes, sea levels rose as much as three feet every twenty years for five hundred years straight.

The Long View: 270 Feet of Sea-Level Rise

Scientific consensus expects that sea level rise will ultimately total around 270 feet over the next several millennia. This estimate accounts not only for the melting of Greenland and Antarctica but also for thermal expansion of the oceans.

Back in 1998, the State of New Jersey published Sea Level Rise in New Jersey, which depicted the Statue of Liberty partially submerged under 270 feet of water. The message was clear: coastal civilization as we know it cannot endure.

When the last Ice Age ended, the Earth experienced “Meltwater Pulse 1A”—a dramatic period roughly 14,500 years ago when sea levels surged upward by about 66 feet in just 500 years. Data from Barbados, Tahiti, and Sunda confirm that the ocean rose at astonishing rates—sometimes more than 40 mm per year. We should expect similar patterns again.

Why 270 Feet Is “The Safe Minimum”

Our estimate of 270 feet as the “safe” elevation to live is conservative. High tides, waves, storm surge, and coastal flooding make it unsafe to live anywhere below that elevation in the long run. Even at 270 feet, hazards persist:

  • Biohazards: As the waters overtake sewage plants, landfills, farms, and industrial sites, contamination will make coastal waters toxic.

  • Soil Salinization: Saltwater intrusion will sterilize farmland, destroying food supplies.

  • Islandization: Communities below ~800 feet elevation risk being cut off, effectively becoming islands. This raises issues of food, water, healthcare, and security. History suggests piracy and lawlessness could accompany widespread displacement.

For these reasons, our recommendation is blunt: managed retreat must begin now. Florida, for example, has already seen storm surges of 14–20 feet in recent years, with projections of temporary surges reaching 20–40 feet this century. Billions spent rebuilding after Hurricane Ida and other storms will ultimately be lost. It is irresponsible to continue building where retreat is the only rational option.

The Antarctic “Regime Shift”

Recent research published in Nature confirms that Antarctica is already undergoing abrupt and potentially irreversible changes:

  • Regime Shift: The continent is moving into a new climate state, characterized by drastically reduced sea ice.

  • Accelerated Melting: Glacial outflow from Thwaites and others has doubled since the 1990s.

  • Tipping Point: The West Antarctic Ice Sheet may soon pass the point of no return for unstoppable collapse.

  • Ocean Circulation Slowdown: The Antarctic Overturning Circulation—which regulates heat transport and CO₂ absorption—is weakening, undermining a key planetary stabilizer.

  • Wildlife Collapse: Emperor penguins and other species face extinction as their habitats vanish.

Planetary Consequences

  • Amplified Warming: With less ice, the Antarctic reflects less sunlight, accelerating global warming.

  • Rapid Sea-Level Rise: Even temporary pulses of 20–40 feet this century will devastate coasts. The long-term inevitability is hundreds of feet.

  • Ecosystem Disruption: Warming and acidifying Southern Ocean waters threaten krill, penguins, whales, and entire food webs.

The Driving Force

At the heart of all this is human-caused climate change. Fossil fuel emissions continue to trap heat, warming both atmosphere and ocean. Unlike the Arctic, the Antarctic is responding with alarming speed, its feedback loops less understood and far harder to predict.

The Bottom Line

The Earth has crossed tipping points that make extreme sea-level rise both inevitable and irreversible within our lifetimes. The exact timing and scale will vary by location due to gravity, isostatic rebound, and thermal expansion. But the direction is clear:

  • Coastal communities must plan for retreat.

  • Governments must end fossil fuel dependency immediately.

  • Planners must recognize that rebuilding low-lying infrastructure is wasted effort.

The world is entering a new geological epoch shaped by rising seas. The only question left is whether we plan for it—or drown in denial.

The Future Is Now

Melting ice, rising seas, and intensifying climate impacts are not distant possibilities—they are unfolding before our eyes. Each impact amplifies others, pushing the climate system into dangerous new territory.

In October 2023, Sidd Mukherjee remarked, “Now I am thinking the violent rain will be a bigger problem before we die.” His words have proven prophetic. By 2025, the world is experiencing a record-shattering year of violent rain events, marked by atmospheric rivers, catastrophic flash floods, and rainfall extremes that overwhelm infrastructure, agriculture, and human safety.

Cascading Failures, Not Gradual Change

The climate system does not degrade in a smooth, linear way. Instead, it behaves like a network of interconnected subsystems—when one falters, it destabilizes others. These interactions create cascading feedback loops that accelerate collapse.

For instance:

  • AMOC Collapse Loop: Melting at the poles injects massive amounts of freshwater into the North Atlantic, lowering salinity and density. This slows the Atlantic Meridional Overturning Circulation (AMOC), reducing the ocean’s ability to transport heat and regulate the climate. A weaker AMOC intensifies warming in the tropics and Arctic, which then accelerates ice melt, further destabilizing the system.

  • Jet Stream & Weather Extremes: Polar warming reduces the temperature gradient between the poles and the equator. This weakens and destabilizes the jet stream, causing it to meander. Stalled or “stuck” jet streams lead to prolonged droughts, heat domes, atmospheric rivers, or weeks of torrential rainfall in the same region.

  • Albedo Feedback: As reflective ice vanishes, darker land and ocean surfaces absorb more solar radiation, amplifying warming. This in turn accelerates ice melt and further reduces albedo—a reinforcing loop with no natural brake.

  • Rossby & Polar Vortex Disruptions: These shifts send frigid Arctic air southward and lock extreme weather in place, producing events like the deadly Texas freeze, followed months later by record-breaking heat waves in the same region.

The Violent Rain Era

The hydrological cycle itself is now destabilizing. A warmer atmosphere holds more moisture, and when that water is released, it falls with unprecedented intensity. We are entering what might be called the Violent Rain Era:

  • Cities flood in hours from rainfall amounts once considered “1,000-year events.”

  • Agricultural systems collapse under alternating extremes—parching droughts followed by soil-eroding floods.

  • Infrastructure built for the 20th century fails under the weight of 21st-century storms.

2025 stands as a stark marker: atmospheric rivers in California, monsoon extremes in South Asia, and deluge-level storms in Europe have all set records in rainfall intensity, duration, and damage.

From Stability to Chaos

This is only one example in a larger mosaic. Each subsystem—cryosphere, ocean, atmosphere, biosphere—feeds into the others. Their breakdown is already shifting Earth from a relatively stable climate state into a chaotic, self-reinforcing collapse.

The future is not centuries away—it is here now, arriving in the form of violent rain, collapsing coastlines, failing crops, and shattered infrastructure. The challenge is no longer about preventing climate change, but about surviving the acceleration already underway.

Ignite a Domino Effect: Albedo, Brown Carbon, AMOC, Permafrost, Amazon Rainforest Dieback, Sea Level Rise Pulses, Hydroclimate Whiplash, and Arctic Sea Ice

The Human Induced Climate Change Experiment