bookmark_borderWar and Economics Reality

The latest developments surrounding negotiations reveal a fragile and highly conditional pause in hostilities—one that is already being overshadowed by deeper structural disruptions in energy, trade, and global markets.


Status of Negotiations

Frozen Assets

A senior Iranian official has confirmed that part of the agreement to reopen the Strait during the ceasefire period includes the unfreezing of approximately $30 billion in Iranian oil and gas revenues. This represents a significant financial concession and a key incentive for temporary de-escalation.

Sanctions as the Core Demand

While President Trump has expressed optimism about reaching a “quick” deal, Iranian officials continue to emphasize that any lasting agreement must include:

  • Full lifting of international sanctions
  • Potential compensation for war-related damages

Without these elements, Iran has signaled that any agreement would remain temporary and conditional.


The Nuclear Sticking Point

One of the most significant barriers to a long-term resolution remains Iran’s nuclear program.

  • U.S. Proposal: 20-year suspension of all nuclear activity
  • Iran’s Position: 3–5 year limitation with continued oversight

This gap is substantial and reflects fundamentally different strategic objectives. For the U.S., the goal is long-term containment; for Iran, the focus is near-term sovereignty and flexibility.


Reality on the Ground: Trade Still Frozen

Despite the framework of a ceasefire, the physical reality tells a different story:

  • Very few, if any, ships are currently moving through the Strait
  • Maritime risk remains elevated due to security concerns and uncertainty
  • Insurance costs and logistical barriers continue to deter commercial traffic

In effect, the Strait may be “open” in theory—but not yet in practice.


Supply Chain Distortions

Fertilizer Flows Reversing

U.S. fertilizer buyers are now redirecting shipments out of the country, driven by higher prices overseas. This creates a paradox:

  • Domestic supply tightens
  • Global buyers outcompete U.S. demand
  • Food production costs may rise domestically

This is a clear example of how global pricing pressures can override national supply priorities.


Oil Industry Recovery Timeline

Industry sources indicate that full operational recovery could take a minimum of two years, even under stable conditions.

This reflects:

  • Infrastructure damage
  • Logistical bottlenecks
  • Persistent geopolitical risk

In other words, even a successful ceasefire does not quickly restore normalcy.


Market Behavior: Signals or Noise?

Perhaps the most puzzling element is market reaction.

  • Stock market indexes remain near record highs
  • Oil futures have declined sharply, in what some view as an overreaction to optimistic headlines
  • Major announcements have coincided with market closures or low-liquidity periods

The timing and magnitude of these movements raise questions about whether markets are:

  • Reacting to incomplete information
  • Overweighting political signaling
  • Or potentially reflecting more complex dynamics behind the scenes

A Pattern Worth Watching

These developments are not occurring in isolation. They fit into a broader pattern of:

  • Sudden policy announcements
  • Sharp, short-term market moves
  • Ongoing scrutiny around transparency and information flow

While definitive conclusions are difficult to draw, such patterns continue to attract attention from analysts and regulators alike.


Final Thought

The current moment reflects a disconnect between headline progress and underlying reality.

  • Negotiations are active—but unresolved
  • The Strait may be reopening—but remains functionally constrained
  • Markets appear stable—but are sending mixed signals

The result is a system in limbo: neither at war nor at peace, neither stable nor fully disrupted.

And in that uncertainty, the risks—economic, geopolitical, and structural—continue to accumulate beneath the surface.

bookmark_borderHeat Health Risks

Heat stress is not just uncomfortable—it’s dangerous.

Rising exposure:
Over the past four years, the average person has experienced 19 days per year of life-threatening heat, driven almost entirely by human-caused warming.

Severe health impacts:
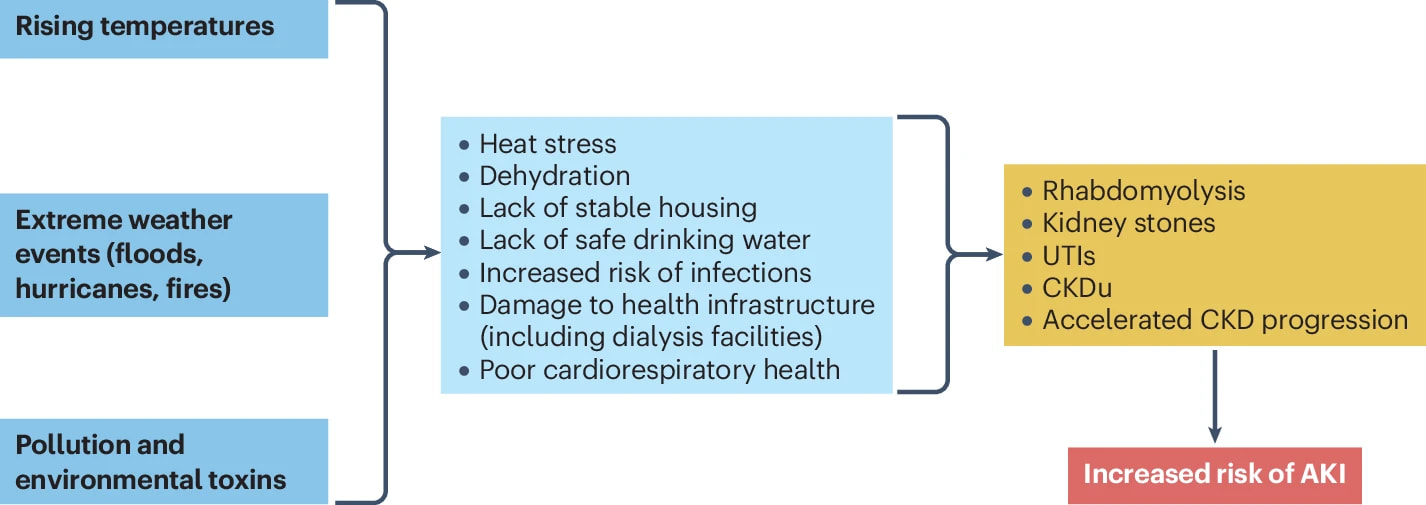
Extreme heat can trigger heatstroke, dehydration, and kidney injury, while also worsening existing heart and lung conditions.

Accelerated aging:
Prolonged exposure to extreme heat speeds up biological aging—damaging tissues and shortening telomeres at the cellular level.

Chronic disease risk:
These changes increase the likelihood of diseases such as cancer, dementia, and diabetes—conditions that are further exacerbated by pollution and infection.

Mental health effects:
Heat stress is also linked to higher rates of depression, anxiety, and even suicide.


Epigenetic Changes: The Molecular Convergence of Climate Stressors

A key connection between these risks lies in epigenetic changes—chemical modifications that influence how genes are expressed without altering the DNA itself. Think of them as switches that turn genes on or off.

Extreme heat has been shown to trigger these changes.

  • Heat—especially humid heat—can trigger epigenetic changes that activate high-risk genes linked to cancer, diabetes, cardiovascular disease, and neurological disorders.
  • Each time you are exposed to extreme heat , the effects don’t just add up—they compound, increasing long-term vulnerability across multiple organ systems..

This molecular disruption represents a shared pathway linking climate-related health threats. It amplifies feedback loops that drive chronic illness and premature death, and raises concerns about transgenerational effects, where these changes may increase disease risk in future generations.


A recent study in Nature examines the impact of heat stress on kidney health:
https://www.nature.com/articles/s41581-026-01063-3

bookmark_borderWeakening AMOC

Many of the extreme weather events now being experienced in the U.S. are linked to a weakening AMOC and an increasingly unstable, “wavier” jet stream. Both are driven by shifting temperature, pressure, and moisture gradients, and they are physically connected through shared feedback processes. As these feedbacks interact, they can amplify one another, accelerating the broader system toward destabilization.

A recent study highlights that the rate—and particularly the acceleration—of these changes may have been underestimated.

Led by Dr. Valentin Portmann at the Inria Centre de recherche Bordeaux Sud-Ouest, the research utilized a statistical method called ridge regression to assess climate models against real-world salinity observations in the South Atlantic.

  • Underestimated Decline: The study found that previous “average” climate models likely underestimated how quickly the AMOC is weakening.
  • Realistic Pessimism: Models previously considered “pessimistic” actually align better with observational data, making their severe outcomes more likely to be realistic.
  • Tipping Point Proximity: Experts now suggest there is a greater than 50% chance of an AMOC shutdown tipping point being reached, possibly as early as the middle of this century (circa 2050).

Dr Valentin Portmann, at the Inria Centre de recherche Bordeaux Sud-Ouest in France and who led the new research, said: “We found that the AMOC is going to decline more than expected compared to the average of all climate models. This means we have an AMOC that is closer to a tipping point.”

Prof Stefan Rahmstorf, at the Potsdam Institute for Climate Impact Research in Germany, said: “This is an important and very concerning result. It shows that the ‘pessimistic’ models, which show a strong weakening of the AMOC by 2100, are, unfortunately, the realistic ones, in that they agree better with observational data. I now am increasingly worried that we may well pass that AMOC shutdown tipping point, where it becomes inevitable, in the middle of this century, which is quite close.”

https://www.science.org/doi/10.1126/sciadv.adx4298

bookmark_borderThe $50 Oil Disconnect: Futures, Physical Delivery, and the Illusion of Market Calm

There is a growing and unusual divergence in global oil markets that is difficult to ignore: spot oil prices are now trading roughly $50 per barrel above futures prices. Historically, such a wide gap is rare and typically signals acute near-term scarcity, physical bottlenecks, or extreme geopolitical risk premiums that the futures curve has not fully absorbed.

At the same time, market commentary often assumes oil pricing is abstract or purely financial. But underneath that abstraction is a very real physical system—one that occasionally forces traders to take actual delivery of barrels of crude oil.


Do Oil Futures Ever Lead to Physical Oil Delivery?

Yes.

Although most participants never touch a barrel of oil, oil futures contracts can result in physical delivery of the underlying commodity.

This happens when contracts are “physically settled,” meaning the buyer is obligated to accept, and the seller is obligated to deliver, real oil—not cash settlement.

That said, this occurs in fewer than 5% of oil futures contracts, as most positions are closed or rolled before expiration.


How Physical Delivery Actually Works

When delivery does occur, it is highly structured and far more logistical than most people imagine.

For the benchmark U.S. contract—West Texas Intermediate (WTI):

  • Delivery point: Cushing, Oklahoma
  • Contract size: 1,000 barrels per contract
  • Mechanism: Storage-based transfer, not trucked barrels

Importantly, delivery does not usually involve physical barrels being transported to a buyer. Instead, it is handled through:

  • In-tank transfers: changing ownership of oil in storage tanks
  • Pipeline transfers: moving oil between connected facilities
  • Book transfers: purely administrative changes in ownership records

In other words, “taking delivery” often means taking legal control of oil sitting in a tank farm, not physically handling it.


Who Actually Takes Delivery?

Physical settlement is almost entirely the domain of industrial players:

  • Refiners securing feedstock
  • Airlines hedging jet fuel costs
  • Power producers locking in energy supply

These participants have the infrastructure—storage, pipelines, logistics—to actually manage crude oil.

Retail traders, by contrast, are generally excluded from physical delivery. Brokers typically close or roll positions before expiration. If a trader were somehow to remain exposed, the result could be catastrophic financial and logistical consequences.

Even smaller “micro” contracts are designed specifically to avoid physical delivery altogether, relying instead on cash settlement.


Can You Take Delivery of Oil on a Tanker?

Yes—but not from the standard WTI contract.

The most widely known contract (WTI at Cushing, Oklahoma) is landlocked and cannot be accessed by tanker ship. However, there are specialized contracts and physical hubs that do allow waterborne delivery:

Houston, Texas (Primary Gulf Hub)

Certain futures contracts settle at terminals along the Houston Ship Channel, including facilities such as:

  • Enterprise terminals
  • Magellan East Houston (MEH) terminal
  • Enterprise Crude Houston (ECHO) terminal

These allow oil to be transferred directly into export systems feeding tanker ships.


Corpus Christi, Texas

Now the largest U.S. oil export hub, Corpus Christi can load Very Large Crude Carriers (VLCCs) after major port expansions. Most activity here occurs in the physical spot market, but it is a critical export point for global supply.


Louisiana Offshore Oil Port (LOOP)

LOOP is the only deepwater U.S. facility capable of fully loading a VLCC offshore without lightering operations. It is also connected to specialized storage-linked contracts.


The Scale Problem: Oil Is Not a Paper Asset

Physical delivery highlights the scale mismatch between financial markets and physical reality.

  • One VLCC tanker holds ~2 million barrels
  • That equals 2,000 standard futures contracts
  • Loading requires pipeline access, storage coordination, and terminal scheduling

This is not a retail-scale system—it is industrial infrastructure operating behind a financial overlay.


The Market Disconnect: Spot vs Futures

Against this physical backdrop, the current pricing structure is unusual:

  • Spot oil: ~$50 per barrel higher than futures
  • Futures: implying significantly lower future prices

This kind of divergence typically suggests one of three conditions:

  1. Immediate physical shortage
  2. Severe logistical disruption
  3. Market expectation that the shock is temporary

But historically, when spot prices lead futures by this magnitude, it often signals that physical markets are under far more stress than paper markets are pricing in.


What the Spread Really Means

The futures market is, in effect, pricing a normalization.

The spot market is pricing reality today.

That $50 gap suggests the present system is strained in ways that cannot be fully expressed in forward contracts—at least not yet.


Final Thought: Paper Calm, Physical Pressure

Oil markets are often treated as financial abstractions, but underneath every contract is a barrel that must be stored, moved, refined, or consumed.

When spot prices diverge this sharply from futures, it is usually not a statistical curiosity—it is a signal that physical constraints are dominating financial expectations.

And in markets like this, the real question is not just what prices are today or tomorrow—but whether the infrastructure of global supply is quietly moving faster than the models that try to describe it.

bookmark_borderWar Update: Escalation, Broken Negotiations, and the Closure of the Strait

The latest developments mark a sharp and consequential turn in the conflict. The United States has declared the war “won” while simultaneously abandoning ongoing peace negotiations. At the same time, officials have justified continued escalation by asserting that Iran is pursuing a nuclear weapon—an assertion that remains highly contested.


A Pattern of Negotiation and Breakdown

Iran is a signatory to the Nuclear Non-Proliferation Treaty (NPT), which commits participating countries to forgo nuclear weapons development and accept international oversight.

In addition, Iran previously entered into a broader multilateral agreement with global powers, including the United States, that allowed for extensive and intrusive inspections of its nuclear program. The U.S. later withdrew from that agreement, effectively ending its enforcement framework.

Since then, a repeated pattern has emerged:

  • Iran signals a willingness to negotiate
  • Iran reiterates that it does not intend to pursue nuclear weapons
  • Iran agrees to inspection frameworks
  • Military escalation follows, including strikes on civilians, as well as schools, hospitals, energy facilities, and other civilian infrastructure

This cycle has played out multiple times over the past year, with negotiations repeatedly collapsing amid renewed hostilities.


Conflicting Narratives

The current justification for escalation rests on claims that Iran is actively seeking a nuclear weapon. Iranian officials continue to deny this, maintaining that their nuclear program is for civilian purposes and remains open to inspection.

Public statements from U.S. leadership, including J.D. Vance, have reinforced the administration’s position, though critics argue these claims conflict with Iran’s repeated public commitments to non-proliferation and monitoring.

This divergence in narratives has made diplomatic resolution increasingly difficult, as each side operates from fundamentally different premises.


From De-escalation to Full Closure

Perhaps the most significant development is not the rhetoric, but the shift in policy.

Instead of announcing progress toward reopening the Strait of Hormuz—even more than partially—the United States has moved in the opposite direction, declaring a full closure of the waterway.

This represents a major escalation with global implications:

  • The Strait is one of the most critical energy chokepoints in the world
  • A full closure threatens a substantial portion of global oil and gas flows
  • Supply chains across energy, manufacturing, and agriculture are immediately impacted

Escalation Extends to the Red Sea

The risks are no longer theoretical—they are already materializing across key shipping lanes.

A commercial vessel was approached and nearly boarded by 10–12 armed individuals in a skiff approximately 54 nautical miles southwest of Hodeidah, Yemen, on April 12, 2026. The incident occurred in the Red Sea, a region already designated as high-risk due to ongoing conflict and maritime instability off the Yemeni coast.

Such encounters highlight the growing threat to commercial shipping. Small, fast-moving vessels can attempt interdiction or seizure, raising both security concerns and the cost of global trade through higher insurance premiums and rerouting.


Global Consequences

The decision to close the Strait transforms a regional conflict into a systemic global shock:

  • Energy prices face sustained upward pressure
  • Shipping and insurance costs surge
  • Critical materials—from fuel to fertilizers—become constrained
  • Inflationary pressures intensify across nearly all sectors

Even the threat of disruption had already destabilized markets. A full closure introduces a new level of structural risk.


A Turning Point

What makes this moment particularly significant is the contrast between opportunity and outcome.

At multiple points, there appeared to be openings for renewed agreements—particularly around inspections and nuclear commitments. Instead, the trajectory has shifted toward deeper conflict and broader economic consequences.

Whether this path is reversible remains uncertain. What is clear is that the costs—economic, geopolitical, and humanitarian—are continuing to rise.


Final Thought

This is no longer just a regional conflict or a diplomatic dispute. It is a defining moment for global markets, international agreements, and the credibility of negotiation itself.

The question now is not simply how the conflict ends—but how much of the global system is reshaped before it does.

bookmark_borderPrediction Markets, Oil Futures, and the 6PM Inflection Point

I’ve become increasingly interested in prediction markets—especially how they behave ahead of major geopolitical events. There have been multiple documented instances where unusual trades appeared to anticipate policy decisions tied to the White House, raising persistent questions about information asymmetry and whether some participants are trading on insights others simply don’t have.

Tonight at 6:00 PM ET is the next major inflection point—effectively a “Super Bowl moment” for global oil markets.


Market Reset: Why 6PM Matters

Oil futures are currently closed for the weekend and will reopen this evening:

  • Current State: Closed
  • Reopen Time: Sunday, April 12, 2026 at 6:00 PM ET

This reopening is critical. It will be the first opportunity for markets to react to a weekend full of geopolitical developments, diplomatic signals, and supply risks.


Last Market Snapshot (April 10 Close)

Heading into the weekend, oil prices softened slightly:

  • WTI Crude (CL): $89.58 (-0.39%)
  • Brent Crude (B): $95.20 (-0.75%)

This pullback appears to reflect profit-taking and position unwinding ahead of uncertainty—not necessarily a shift in underlying fundamentals.


Prediction Markets: What Traders Are Betting

Prediction markets are telling a very different story—one that leans toward volatility and higher price risk.

On Polymarket, the primary WTI April contract—“What will WTI Crude Oil hit in April 2026?”—reveals how traders are positioning:

Implied Probabilities (April 12, 2026)

  • WTI ≥ $110: 50% probability ($96K+ volume)
  • WTI ≥ $105: 69% probability ($144K+ volume)
  • WTI ≤ $95: 71% probability ($219K+ volume)
  • WTI ≤ $90: 61% probability ($1M+ volume)

This structure reflects a market expecting wide price swings, not stability. Importantly, these contracts resolve if the price is hit at any point, even briefly—meaning traders are betting on spikes, not just sustained levels.

In other words, the market is pricing in volatility as the base case.


Key Drivers Heading Into the Open

1. Diplomatic Uncertainty

U.S. and Iranian delegations are meeting in Pakistan. Even the perception of progress has triggered recent selling, but conviction appears low.

2. Supply Disruptions

The Strait of Hormuz remains largely obstructed, while Saudi Arabia has reported production cuts of approximately 600,000 barrels per day following attacks.

3. Asymmetric Risk

Major institutions warn that oil could reach $120 per barrel if disruptions persist. Downside appears limited; upside risk remains substantial.


The Disconnect: Futures vs. Prediction Markets

Here’s where things get interesting.

  • Futures markets (Friday close): relatively calm, slight decline
  • Prediction markets (current): pricing significant volatility and upside risk

This divergence raises an important question:

Are traditional markets behind the curve—or are prediction markets overreacting?

Or more pointedly:

Are some participants already positioned based on information not yet reflected in futures prices?


The Insider Question

Prediction markets are designed to aggregate information efficiently. But in situations driven by closed-door negotiations and military strategy, information is not evenly distributed.

That creates the possibility that:

  • Some traders are acting on superior information
  • Markets are partially pricing in outcomes before they are public
  • Early trades at reopening may reflect decisions already made

There is no definitive proof—but the pattern is hard to ignore, especially when markets move sharply at reopen.


What to Watch at 6PM

When futures reopen, the first moves may be the most revealing:

  • Sharp spike upward: escalation or failed diplomacy already priced in
  • Sharp drop: credible de-escalation signals
  • Extreme volatility: conflicting signals or uncertainty

Equally important is speed—fast, decisive moves often indicate conviction, not speculation.


Final Thought

Prediction markets and futures markets are often treated as reflections of reality. But at moments like this, they may be reflecting something else entirely:

who knows what—and when they knew it.

Tonight’s open isn’t just about oil prices. It’s about information, positioning, and whether the market is reacting in real time—or revealing decisions that were already made.

bookmark_borderThe Greatest Economic Lies of All Time: War, Tariffs, and the Hidden Tax on Consumers

Perhaps the two greatest economic misconceptions of the 21st century are:

  • Foreign countries pay tariffs
  • The United States does not depend on the Strait of Hormuz

Both claims are not just misleading—they fundamentally distort how the global economy actually functions.


The Tariff Illusion: Who Really Pays?

The tariff argument is the easier of the two to understand.

Tariffs are taxes on imports. In practice, the importer—the domestic company bringing goods into the country—pays the tax. Those costs are then passed on through supply chains to businesses and ultimately to consumers.

This is not theoretical—it has been tested. In court rulings requiring tariff refunds, the recipients were overwhelmingly U.S. companies. Small and mid-sized businesses, which lack the pricing power and flexibility of large corporations, bore a disproportionate share of the burden.

In short, tariffs function as a domestic tax disguised as foreign punishment.


The Strait of Hormuz Myth: Indirect Dependence, Direct Consequences

The second claim—that the U.S. does not rely on the Strait of Hormuz—is more complex, and far more consequential.

It is technically true that the United States imports relatively little crude oil directly from the Persian Gulf compared to past decades. However, this misses the larger reality: oil is priced globally.

When the Strait of Hormuz—through which roughly 20 million barrels per day flow—is disrupted, the impact is immediate and universal. Prices rise not just for crude, but for refined fuels, petrochemicals, and nearly every energy-intensive product.

As a climate scientist, one might view this as an unintended but powerful carbon tax—accelerating the transition away from fossil fuels. As an economist concerned with inequality, poverty, and food security, the implications are deeply troubling.


War and the Permanent Price Shift

Early claims that the Strait would quickly reopen have proven overly optimistic. Even temporary disruptions create long-term structural changes:

  • Increased insurance costs
  • Security-related tolls and delays
  • Rerouting of global shipping lanes
  • Persistent risk premiums embedded in pricing

Even if hostilities decline, the system does not simply revert. Markets price risk forward, not backward.


Fossil Fuels: The Reality of “Energy Dominance”

Despite claims of “energy dominance,” the U.S. remains deeply exposed to global energy shocks.

Recent market behavior underscores this:

  • U.S. West Texas crude trading above Brent signals tightening domestic supply
  • Spot prices running $20–$30 above futures indicate immediate scarcity
  • Physical Brent cargoes reaching record highs reflect extreme demand for near-term delivery

This is classic backwardation—markets signaling shortage, not abundance.

As a result, gasoline prices moving toward $5 per gallon are not speculative—they are consistent with current market structure.


The Great Rerouting: Why U.S. Consumers Pay More

In response to disruptions, global buyers have begun shifting supply chains:

  • Tankers are increasingly sourcing oil from the U.S. Gulf Coast instead of the Middle East
  • American crude is being exported to replace disrupted supply elsewhere
  • Domestic supply tightens as global demand competes for U.S. barrels

Ironically, this means U.S. consumers may pay more than consumers in other regions.

Energy dominance, in this context, becomes exposure rather than insulation.


The Hidden War Tax on Oil

Even in a de-escalation scenario, new cost structures remain:

  • Tolls, insurance, and financing add an estimated $3.50–$5 per barrel to Middle Eastern oil
  • By comparison, shipping from Texas to Europe adds only $1–$3 per barrel

This creates a structural shift in global sourcing—but not necessarily lower prices for U.S. consumers. Instead, it embeds a long-term premium into the system.


Beyond Oil: System-Wide Inflation

The disruption extends far beyond crude oil.

Petrochemicals and Plastics

  • Plastic prices have surged as much as 60% in some markets
  • Plastic feedstock shortages are tightening global resin supply
  • Consumer goods—from packaging to household items—are rising in price. Less obvious are items like clothing, which are heavily dependent on plastics and synthetic fibers, making them particularly sensitive to these cost increases.

Fertilizer and Food Security

  • Roughly half of global fertilizer supply moves through the Strait
  • Disruptions threaten agricultural output worldwide
  • Some estimates suggest food security could collapse from supporting 8 billion people to as few as 2 billion under sustained disruption

This is not just inflation—it is systemic risk.


Metals and Industrial Inputs

Aluminum:

  • Prices at four-year highs
  • Production disruptions in key Gulf facilities
  • Supply chain impacts across automotive, construction, and packaging sectors

Downstream Effects:

  • Higher costs for consumer goods, infrastructure, and manufacturing inputs
  • Increased volatility in global supply chains

Helium: A Critical but Overlooked Shock

Strikes affecting LNG infrastructure in Qatar have disrupted nearly one-third of global helium supply.

Impacts include:

  • Semiconductor manufacturing
  • MRI medical systems
  • Aerospace and defense
  • Industrial applications

Some analysts warn shortages could persist for years due to infrastructure damage and logistical constraints.


Interest Rates: The Amplifier of Economic Pain

Rising interest rates are compounding the effects of war, tariffs, and supply shocks, acting as a powerful amplifier across the entire economy. As central banks attempt to contain inflation, higher rates are tightening financial conditions for households, businesses, and governments alike.

Impact on Consumer Spending

Higher interest rates directly reduce consumer purchasing power:

  • Credit card rates rise, increasing the cost of carrying balances
  • Auto loans become more expensive, suppressing vehicle demand
  • Personal loans and financing costs increase across the board

As debt servicing consumes a larger share of income, discretionary spending declines. This is particularly significant in an economy where consumption drives roughly 70% of GDP. Even modest increases in borrowing costs can lead to outsized reductions in spending, especially among middle- and lower-income households.

There is also a psychological component. Higher rates signal economic tightening, leading consumers to delay major purchases and increase savings as a precaution. This behavioral shift can accelerate economic slowdowns.

Impact on Housing and Real Estate

The real estate market is especially sensitive to interest rates:

  • Mortgage rates have risen sharply, significantly increasing monthly payments
  • Affordability has deteriorated even where home prices have stabilized
  • First-time buyers are increasingly priced out of the market

For example, a one percentage point increase in mortgage rates can raise monthly payments by hundreds of dollars, effectively reducing purchasing power by tens of thousands of dollars.

This has several cascading effects:

  • Home sales slow as buyers step back
  • Construction activity declines, impacting jobs and materials demand
  • Homeowners with low-rate mortgages are reluctant to sell, reducing supply and creating market rigidity

Commercial real estate faces even greater stress. Higher borrowing costs, combined with shifting demand patterns, are placing pressure on property valuations and increasing refinancing risks.

The Feedback Loop

Rising interest rates create a feedback loop within the broader economic environment:

  • Higher rates reduce demand
  • Reduced demand slows economic growth
  • Slower growth increases financial stress
  • Financial stress can further tighten credit conditions

At the same time, elevated rates increase the cost of servicing government debt, adding pressure to already high deficits and limiting fiscal flexibility.

The Combined Effect

When combined with war-driven energy inflation and tariff-induced price increases, higher interest rates leave policymakers with limited options. Attempts to control inflation risk deepening economic slowdown, while efforts to stimulate growth risk reigniting inflation.

The result is a structurally fragile environment in which consumers face higher prices, higher borrowing costs, and fewer opportunities for economic mobility.


Tariffs in a Time of War

Layered on top of these supply shocks are new tariffs:

  • 10% global import surcharge
  • 50% tariffs on key metals
  • Expanded sector-specific tariffs, including pharmaceuticals

These policies amplify inflationary pressure by increasing input costs across industries already strained by supply disruptions.


Conclusion: The Convergence of Two Lies

These two misconceptions—about tariffs and the Strait of Hormuz—converge into a single reality:

  • War acts as a global tax
  • Tariffs act as a domestic tax
  • Consumers ultimately pay both

The result is a compounding inflationary cycle driven not by a single factor, but by the interaction of policy, conflict, and global supply chains.


A Final Paradox

There is one undeniable outcome:

This crisis will likely accelerate the transition away from fossil fuels at a pace that would have been politically impossible under normal conditions.

But that transition is being forced not by planning—but by disruption.

And the cost of that disruption will be borne unevenly, with the greatest burden falling on those least able to afford it.

Iran has indicated that it has lost track of some floating mines in the Strait, underscoring the ongoing danger and uncertainty in the region. With mines already deployed and difficulties in locating and clearing them, reopening the waterway safely is a complex and time-consuming process.

Any assumption that conditions will return to normal in the near term—if ever—appears increasingly unrealistic.

bookmark_borderWar Update: A Failed Strategy and a Shifting Balance of Power

The United States’ attempt to reshape the Middle East through military force and coercion has backfired. Rather than weakening Iran, the conflict has arguably strengthened its geopolitical position and expanded its influence across the region.

Before the recent escalation, Iran was widely viewed as a regional power with significant influence in the Middle East, but not as a dominant global force. Its reach was largely limited to neighboring countries and proxy networks in places such as Lebanon, Syria, Iraq, and Yemen.

However, the conflict has altered international perceptions. By becoming more deeply involved in the war, the United States has unintentionally elevated Iran’s status in the eyes of many governments and geopolitical analysts. Iran is now increasingly seen as one of the most influential powers in the emerging multipolar world order.

Many analysts now describe the new geopolitical landscape as consisting of:

  1. The United States and China as the two largest global powers.
  2. Russia as the next major military and geopolitical force.
  3. Iran as the #4 world power.

Iran’s influence has grown not only because of its military posture, but also because of its strategic importance in energy markets, shipping routes, proxy alliances, and its closer ties with both Russia and China. Sanctions and military pressure have not isolated Iran to the degree many expected. Instead, they have encouraged stronger economic, military, and diplomatic relationships among countries seeking alternatives to Western influence.

This shift may be difficult to reverse. Once a country gains leverage over global energy supplies, fertilizer, helium, shipping lanes, military alliances, and regional security, that influence can become self-reinforcing.

Continued escalation could strengthen Iran even further. Additional military strikes, prolonged instability, or broader regional conflict may increase oil prices, disrupt trade routes, and give Iran even greater leverage over the global economy.

The longer the conflict continues, the greater the risk that the United States will further undermine its own strategic position while expanding the influence of the very adversary it originally sought to weaken. In fact, Iran anticipates that the November midterms could bring a political “regime change” in the United States.

bookmark_borderEconomic Update: Uncertainty and Pain

The latest economic data paints a troubling picture for consumers and the broader economy. Inflation accelerated again while personal income declined, creating what is effectively the worst of both worlds for households already struggling with high costs.

When wages and personal income fail to keep pace with inflation, families are forced to make difficult choices. Rising prices for food, energy, housing, insurance, and basic goods are stretching budgets thinner, while many Americans are seeing less purchasing power with each passing month.

Several key indicators point to growing economic weakness:

  • Personal income declined.
  • Goods prices rose 0.7% for the month.
  • Goods inflation is now running above 8% on an annual basis.
  • PCE inflation increased 0.4% for the month and is up 2.8% year over year.
  • Core PCE inflation also rose 0.4% for the month and is now running at 3.0% year over year.
  • Fourth quarter GDP was revised down to just 0.5%.
  • The Atlanta Fed GDPNow estimate currently shows growth slowing sharply to 1.3%.
  • The dollar has continued to trend downward.
  • Federal deficits and debt remain near record highs.

Taken together, these numbers suggest that the economy may be entering a period of slower growth combined with persistent inflation. That combination is especially painful because it leaves policymakers with few easy options. Higher interest rates can help slow inflation, but they can also weaken economic growth further. On the other hand, efforts to stimulate the economy risk fueling even more inflation. The markets have largely priced out any interest rate cuts for the year and, in fact, are increasingly pricing in the possibility of additional rate hikes.

Global instability is also contributing to the uncertainty.

Despite Pakistan confirming that the ceasefire agreed upon by the United States included Lebanon, Israel carried out one of its deadliest strikes on civilians, reportedly resulting in more than 200 deaths and roughly 2,000 casualties. Iran responded by restricting traffic through the Strait of Hormuz, causing oil prices to spike once again.

Higher oil prices ripple through nearly every part of the economy. Transportation costs rise, supply chains become more expensive, and consumers end up paying more for gasoline, heating, groceries, and manufactured goods. Any sustained disruption in oil markets could place even more upward pressure on inflation in the months ahead.

An even more important but less recognized source of inflationary pressure is fertilizer. A significant share of the world’s fertilizer supply moves through the Strait of Hormuz. Disruptions there can drive fertilizer prices sharply higher. While the pass-through effect often takes longer to reach consumers than oil price increases, it can ultimately produce even larger spikes in food prices. In many parts of the world, that can also become a serious food security issue.

The economy is increasingly facing pressure from multiple directions at once: weakening growth, falling income, rising prices, record debt, and escalating geopolitical instability. Unless inflation eases significantly or income growth rebounds, consumers are likely to continue bearing the brunt of the pain.

bookmark_borderClimate Change Change

Third Derivatives, Time Compression, and the Collapse of the 30-Year Climate Baseline

by Daniel Brouse and Sidd Mukherjee / April 1, 2026

Abstract

The question is no longer simply how fast the climate is changing. The more important question is: how fast is climate change itself changing?

The acceleration of warming impacts now appears to be increasing at a pace that may approach an effective doubling on the order of every decade across multiple coupled variables, including extreme precipitation, heat, wildfire behavior, atmospheric moisture loading, economic losses, infrastructure failures, and ecosystem disruption. This implies that the climate system is no longer adequately described by first-order change alone, or even by second-order acceleration. Instead, the climate system increasingly appears to be entering a third-derivative regime in which the acceleration itself is accelerating.

This transition has profound implications for forecasting, adaptation, economics, infrastructure, insurance, and the definition of climate itself. Traditionally, climate has been distinguished from weather by the use of 30-year averages. However, when climate states shift substantially within a single decade, a 30-year baseline becomes increasingly incapable of describing the system in real time. By the time a climate normal is established, the underlying climate may already have changed.

This paper argues that the Earth system is now entering a period of climate time compression, in which the historical distinction between weather and climate becomes increasingly blurred. In this regime, traditional linear assumptions fail, nonlinear amplification dominates, and the system begins to exhibit singularity-like behavior characterized by instability, amplification, and declining predictability.


1. Introduction

For most of modern science, climate change was assumed to be gradual. Changes in temperature, precipitation, sea level, and ecosystem structure were expected to occur over centuries, millennia, or longer. Paleoclimate records from events such as the Younger Dryas and Older Dryas suggested that even abrupt climate shifts unfolded over periods that were slow relative to a human lifetime.

That assumption is no longer valid.

Today, warming impacts are intensifying so rapidly that the acceleration itself is becoming measurable. Heat waves are becoming hotter, more frequent, and longer lasting. Rainfall extremes are becoming more intense. Wildfire behavior is becoming more explosive. Drought-to-flood transitions are becoming more abrupt. Economic losses are increasing at rates that exceed both inflation and population growth.

The critical issue is that these changes are no longer merely increasing. They are accelerating. More importantly, the acceleration itself appears to be increasing.

In mathematical terms:

  • First derivative: the rate of change
  • Second derivative: the acceleration of change
  • Third derivative: the acceleration of the acceleration

Historically, climate analysis has focused primarily on first derivatives and, more recently, second derivatives. However, recent evidence suggests that multiple climate variables are now behaving in ways more consistent with third-derivative dynamics.


2. From Linear Change to Third-Derivative Behavior

In a stable system, changes occur gradually enough that historical averages remain useful. This assumption underlies nearly every climate baseline currently in use.

For example:

Climate normals are often based on 30-year averages.

Insurance pricing relies on long-term historical event frequencies.

Infrastructure design assumes that the future will broadly resemble the past.

Agriculture depends on relatively stable planting zones and seasonal cycles.

These assumptions become unreliable when change itself accelerates rapidly.

A useful analogy is compound interest. If a system grows linearly, each year adds roughly the same amount of change. If a system grows exponentially, each year adds more than the year before. However, if the growth rate itself accelerates, the curve steepens even faster.

That is the difference between second-derivative and third-derivative behavior.

A second-derivative system may accelerate steadily.

A third-derivative system accelerates at an increasing rate.

This is the difference between a car gradually speeding up and a car whose acceleration pedal is itself being pressed harder every second.


3. The Failure of the 30-Year Climate Definition

The distinction between weather and climate has traditionally been based on time.

Weather describes short-term atmospheric conditions.

Climate describes long-term averages, typically over 30 years.

This distinction made sense when climate changed slowly.

However, if the climate shifts substantially within a decade, a 30-year average becomes less representative of present conditions. By definition, it becomes a backward-looking metric describing a world that no longer exists.

For example, if rainfall intensity, wildfire risk, heat wave duration, and atmospheric moisture content all change significantly within 10 years, then using a 30-year baseline may smooth away the very acceleration that matters most.

This creates a paradox:

The faster climate changes, the less useful traditional climate definitions become.

In effect, the climate baseline begins to lag behind reality.

The result is a form of observational delay in which institutions, governments, insurers, engineers, and economists continue to plan around conditions that are already obsolete.


4. Time Compression and the Experience of Acceleration

One of the most important consequences of third-derivative behavior is time compression.

As the pace of change accelerates, events that once occurred over centuries may begin occurring within decades, years, or even seasons.

A useful analogy is a vortex.

Imagine floating on a small boat circling near the outer edge of a whirlpool. At first, the movement feels slow and manageable. However, as the boat approaches the center, it begins to move faster and faster.

The closer it gets to the center, the more rapidly its speed increases.

Mathematically:

v ∝ 1/r

Where:

  • v is velocity
  • r is the distance from the center

As r becomes smaller, velocity rises dramatically.

The same effect occurs in a tornado vortex. Winds near the outer edge may be severe but survivable. Near the core, the increase in rotational velocity becomes extreme. At touchdown, the force concentration can become catastrophic.

Climate change now appears to be behaving similarly.

The closer the Earth system moves toward instability thresholds, the faster the impacts appear to unfold.

What once felt distant begins arriving all at once.


5. Why Traditional Forecasting Matters Less

This does not mean that climate models are unimportant.

To the contrary, climate models remain essential for understanding broad trends, emissions scenarios, feedback loops, and risk trajectories.

However, in a rapidly accelerating system, the need for precise long-term forecasting may diminish because the change becomes increasingly observable in real time.

People do not need advanced statistical training to recognize:

  • Record-breaking heat
  • More intense rainfall
  • Larger wildfires
  • Rising insurance costs
  • Crop failures
  • Infrastructure collapse
  • Expanding flood zones
  • Chronic drought

The climate signal is no longer subtle.

It is increasingly visible through everyday experience.

This is one reason the public often perceives climate change more rapidly than institutions are willing to acknowledge it.

People can see the acceleration directly.


6. Implications for Science, Economics, and Policy

If the climate system is indeed entering a third-derivative regime, the implications are profound.

Scientific implications include:

  • Shorter baseline periods for defining climate normals
  • Greater emphasis on nonlinear thresholds and tipping points
  • Increased focus on compound and cascading events
  • Recognition that historical data may underestimate future risk

Economic implications include:

  • Faster increases in insurance losses
  • More rapid devaluation of vulnerable property
  • Larger infrastructure adaptation costs
  • Greater supply-chain instability
  • Rising food and water insecurity

Policy implications include:

  • Faster decarbonization timelines
  • More aggressive adaptation strategies
  • Expanded emergency planning
  • New definitions of risk and resilience

Most importantly, policymakers may need to stop assuming that the future will resemble the past.

The past is no longer a reliable guide when the rate of change itself is changing.


7. Conclusion

Climate change is no longer simply occurring.

Climate change itself is changing.

The system appears to be moving beyond linear warming and even beyond steady acceleration into a regime where the acceleration itself is increasing.

This third-derivative behavior creates time compression, instability, and declining predictability.

It also undermines the usefulness of traditional 30-year climate definitions.

By the time we finish measuring the old climate, the new climate may already be here.

The defining challenge of the coming decades may not simply be adapting to climate change.

It may be adapting to the speed at which climate change itself is accelerating.