DIY Climate Control: Save Money, Reduce Waste, and Cut Greenhouse Gas Emissions
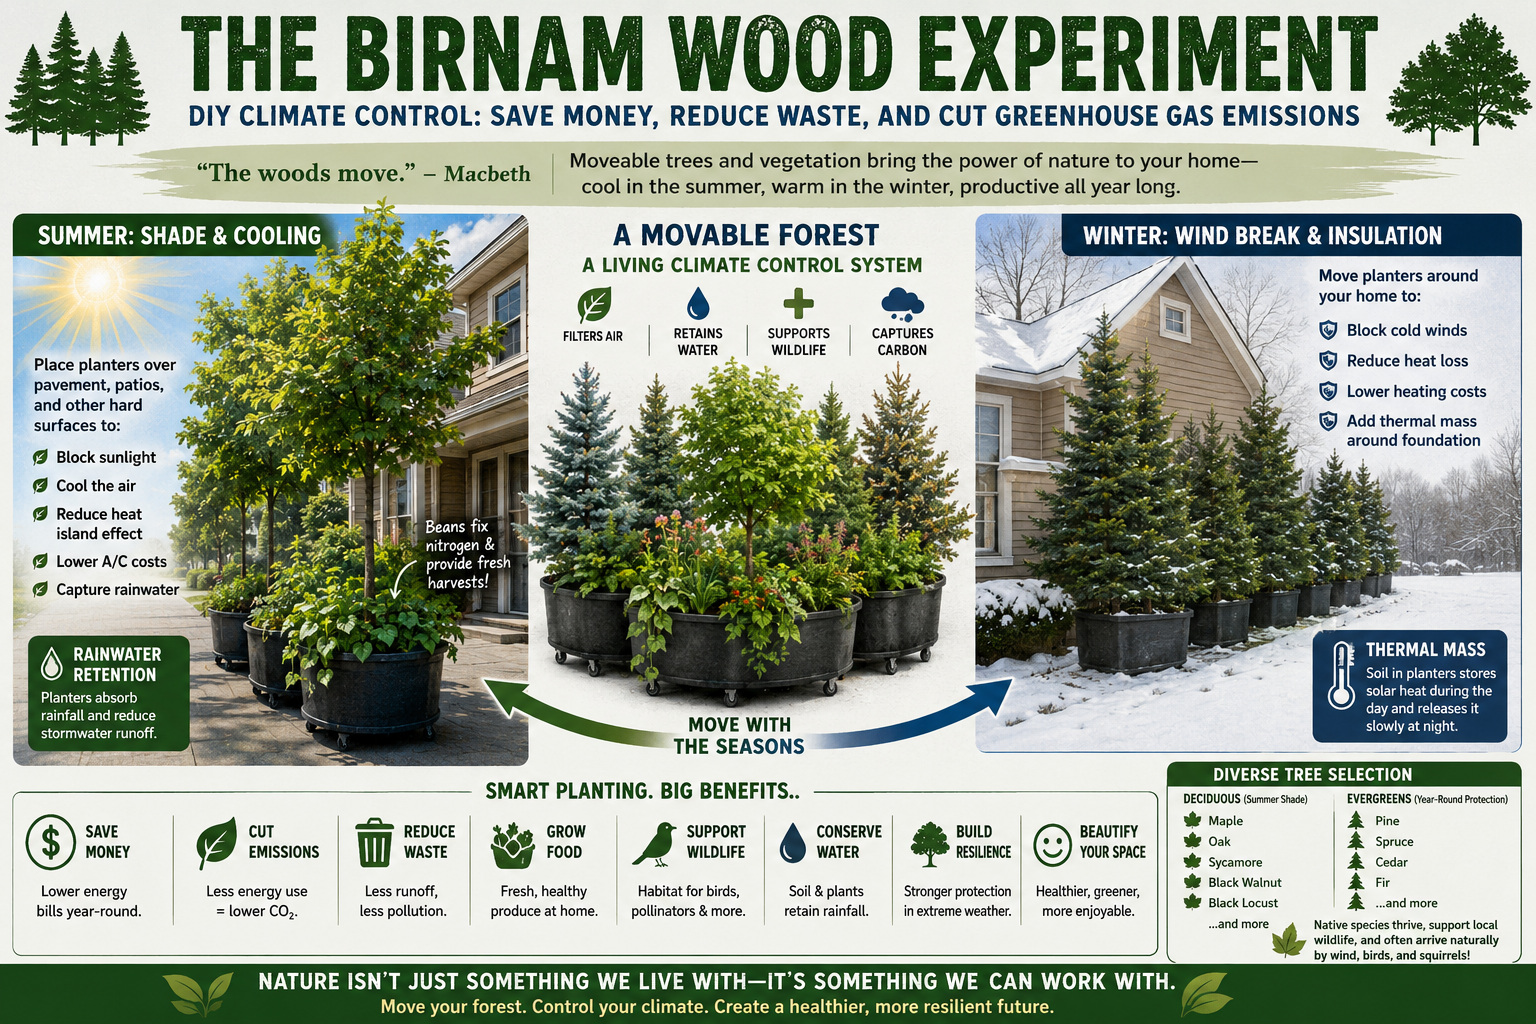
In Shakespeare’s Macbeth, Birnam Wood appears to come alive as Malcolm’s army cuts branches from the forest and carries them toward Dunsinane Castle, concealing its advance. What seemed like magic was actually an ingenious use of nature to solve a practical problem.
The Birnam Wood Experiment applies that same concept to climate resilience by using moveable trees and vegetation to improve home energy efficiency, reduce urban heat, harvest rainwater, provide food, and create healthier outdoor living spaces.
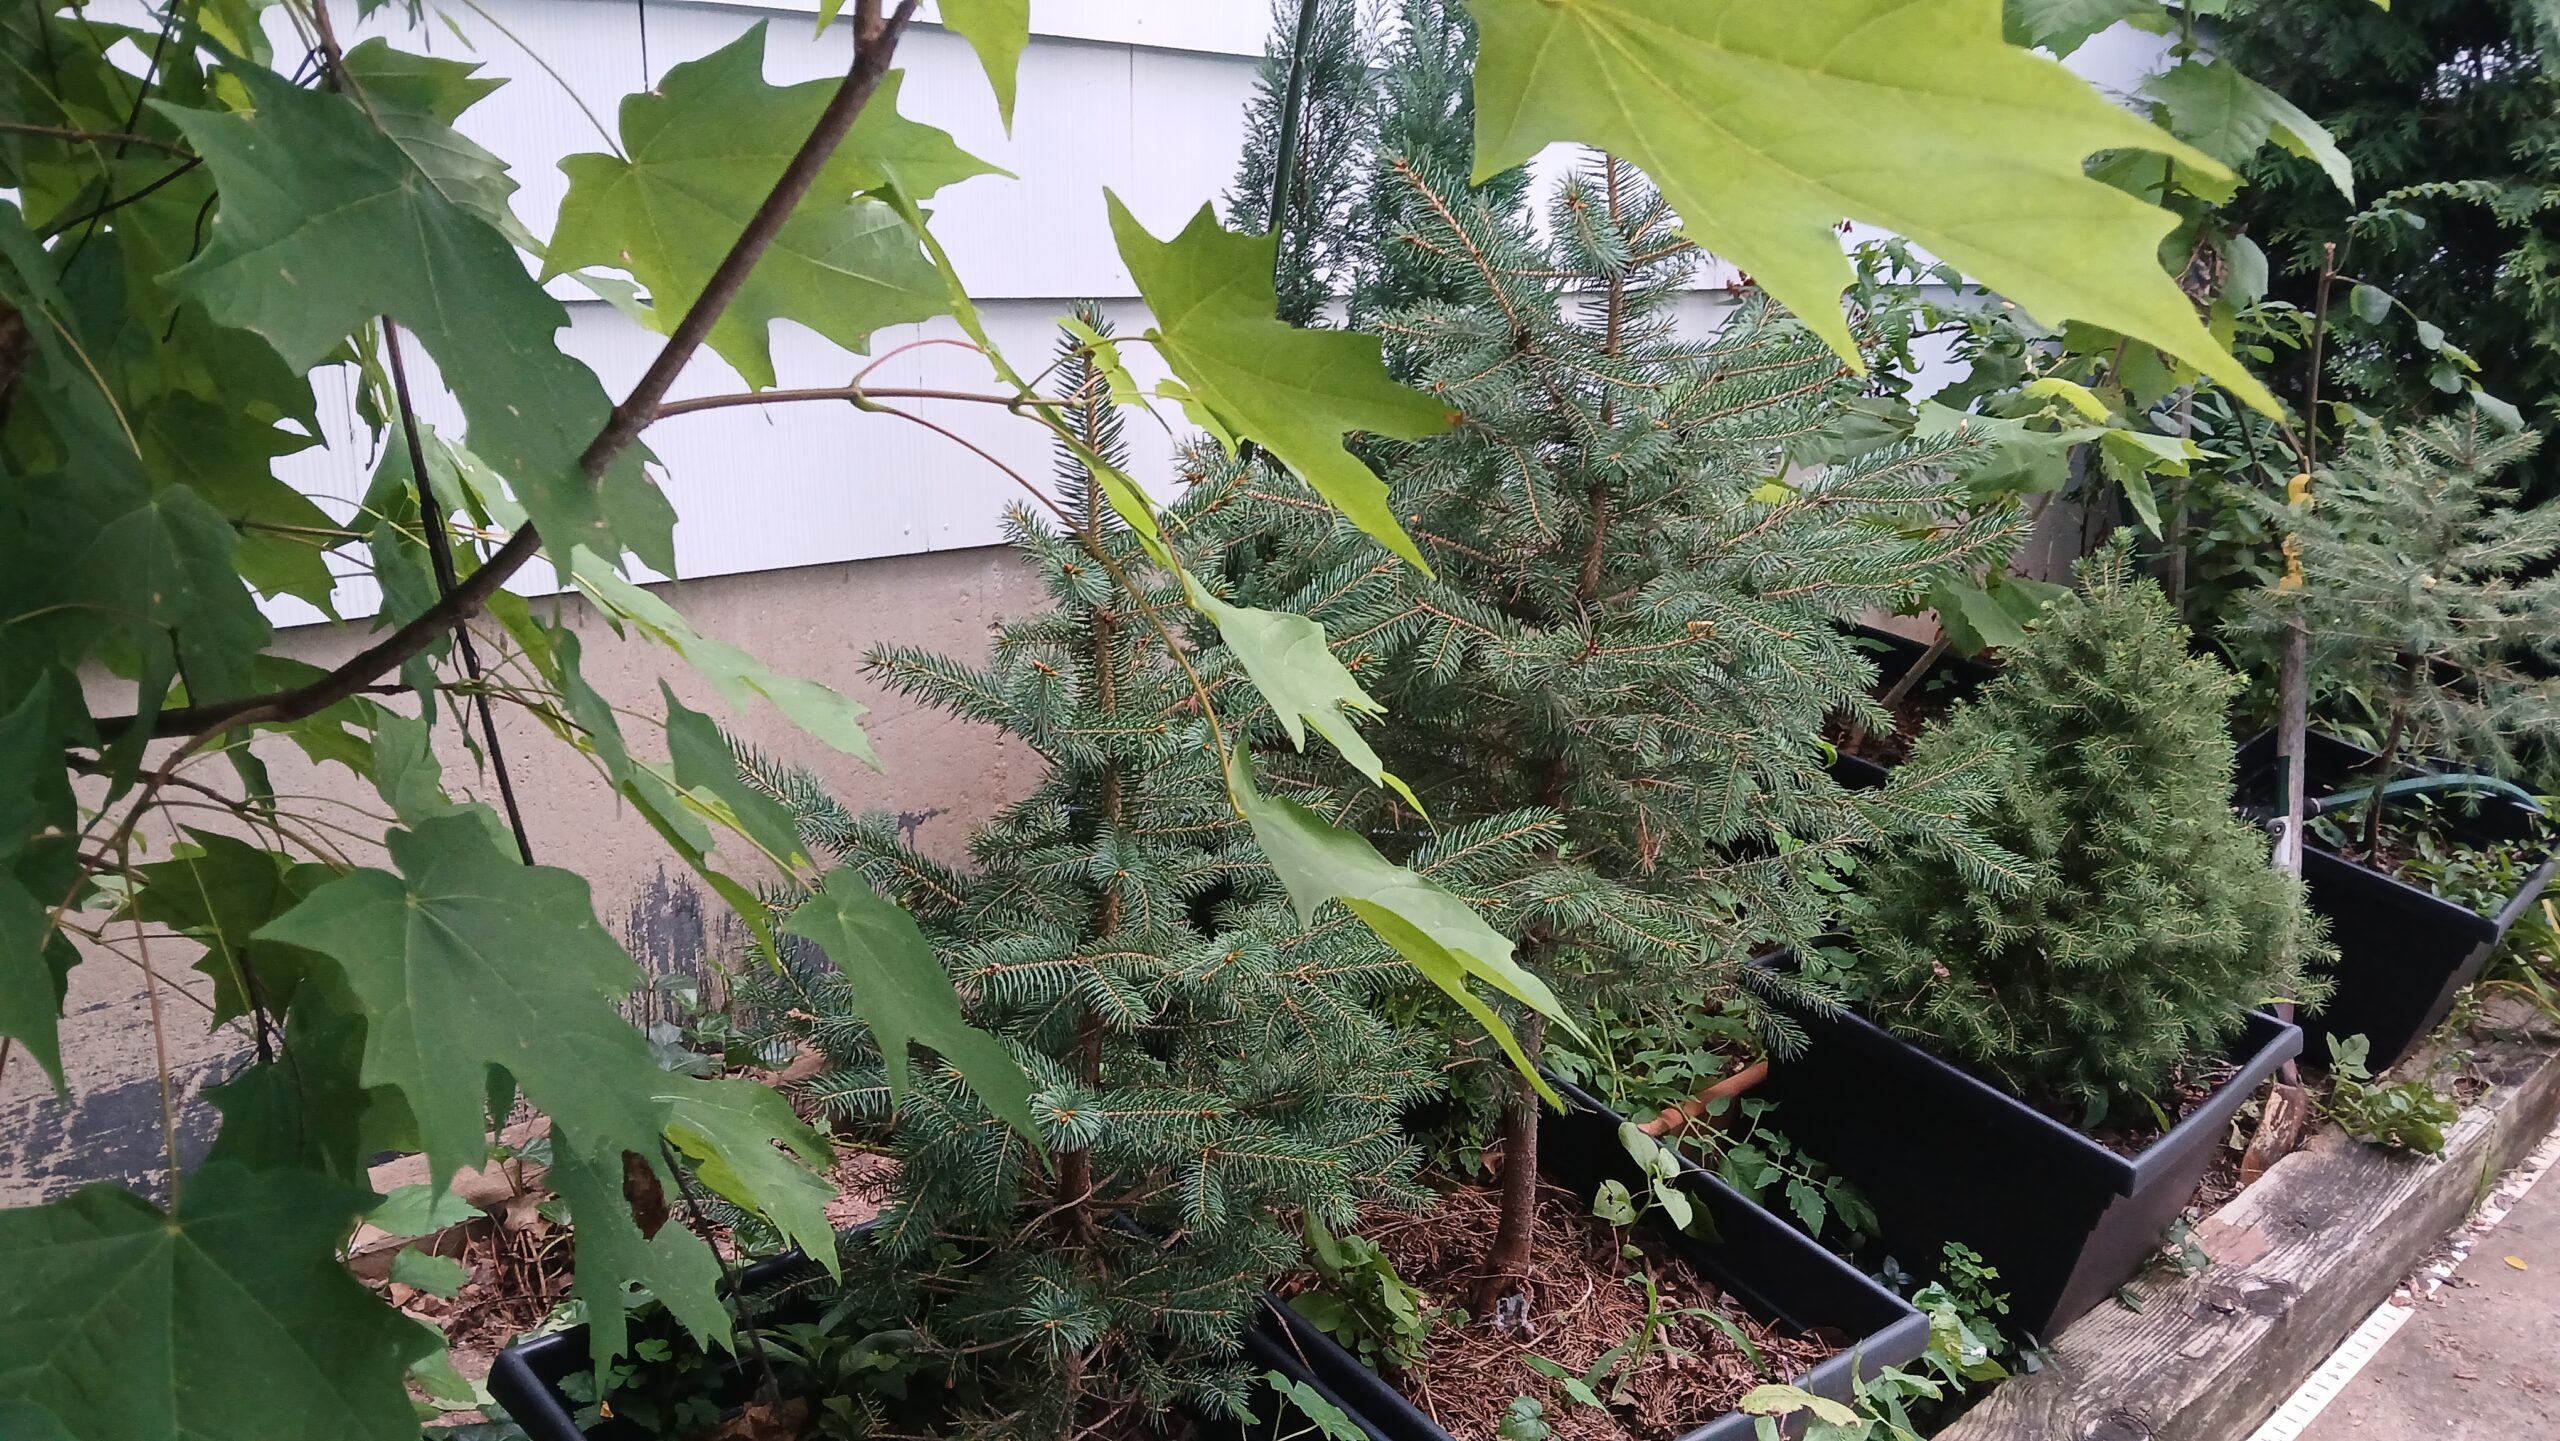
Rather than planting every tree permanently in the ground, many are grown in large mobile planters that can be repositioned throughout the year wherever they provide the greatest environmental and economic benefit.
A Living Climate Control System
Unlike traditional landscaping, movable planters allow homeowners to adapt their landscape to changing seasons and weather conditions.
The planters serve multiple purposes:
Summer shade for homes, patios, and paved surfaces
Winter windbreaks around buildings
Rainwater retention
Reduced stormwater runoff
Heat storage within the soil
Wildlife habitat
Carbon storage
Food production
Improved air quality
Instead of relying entirely on mechanical heating and cooling, the landscape itself becomes part of the home’s climate-control system.
Building the Mobile Forest
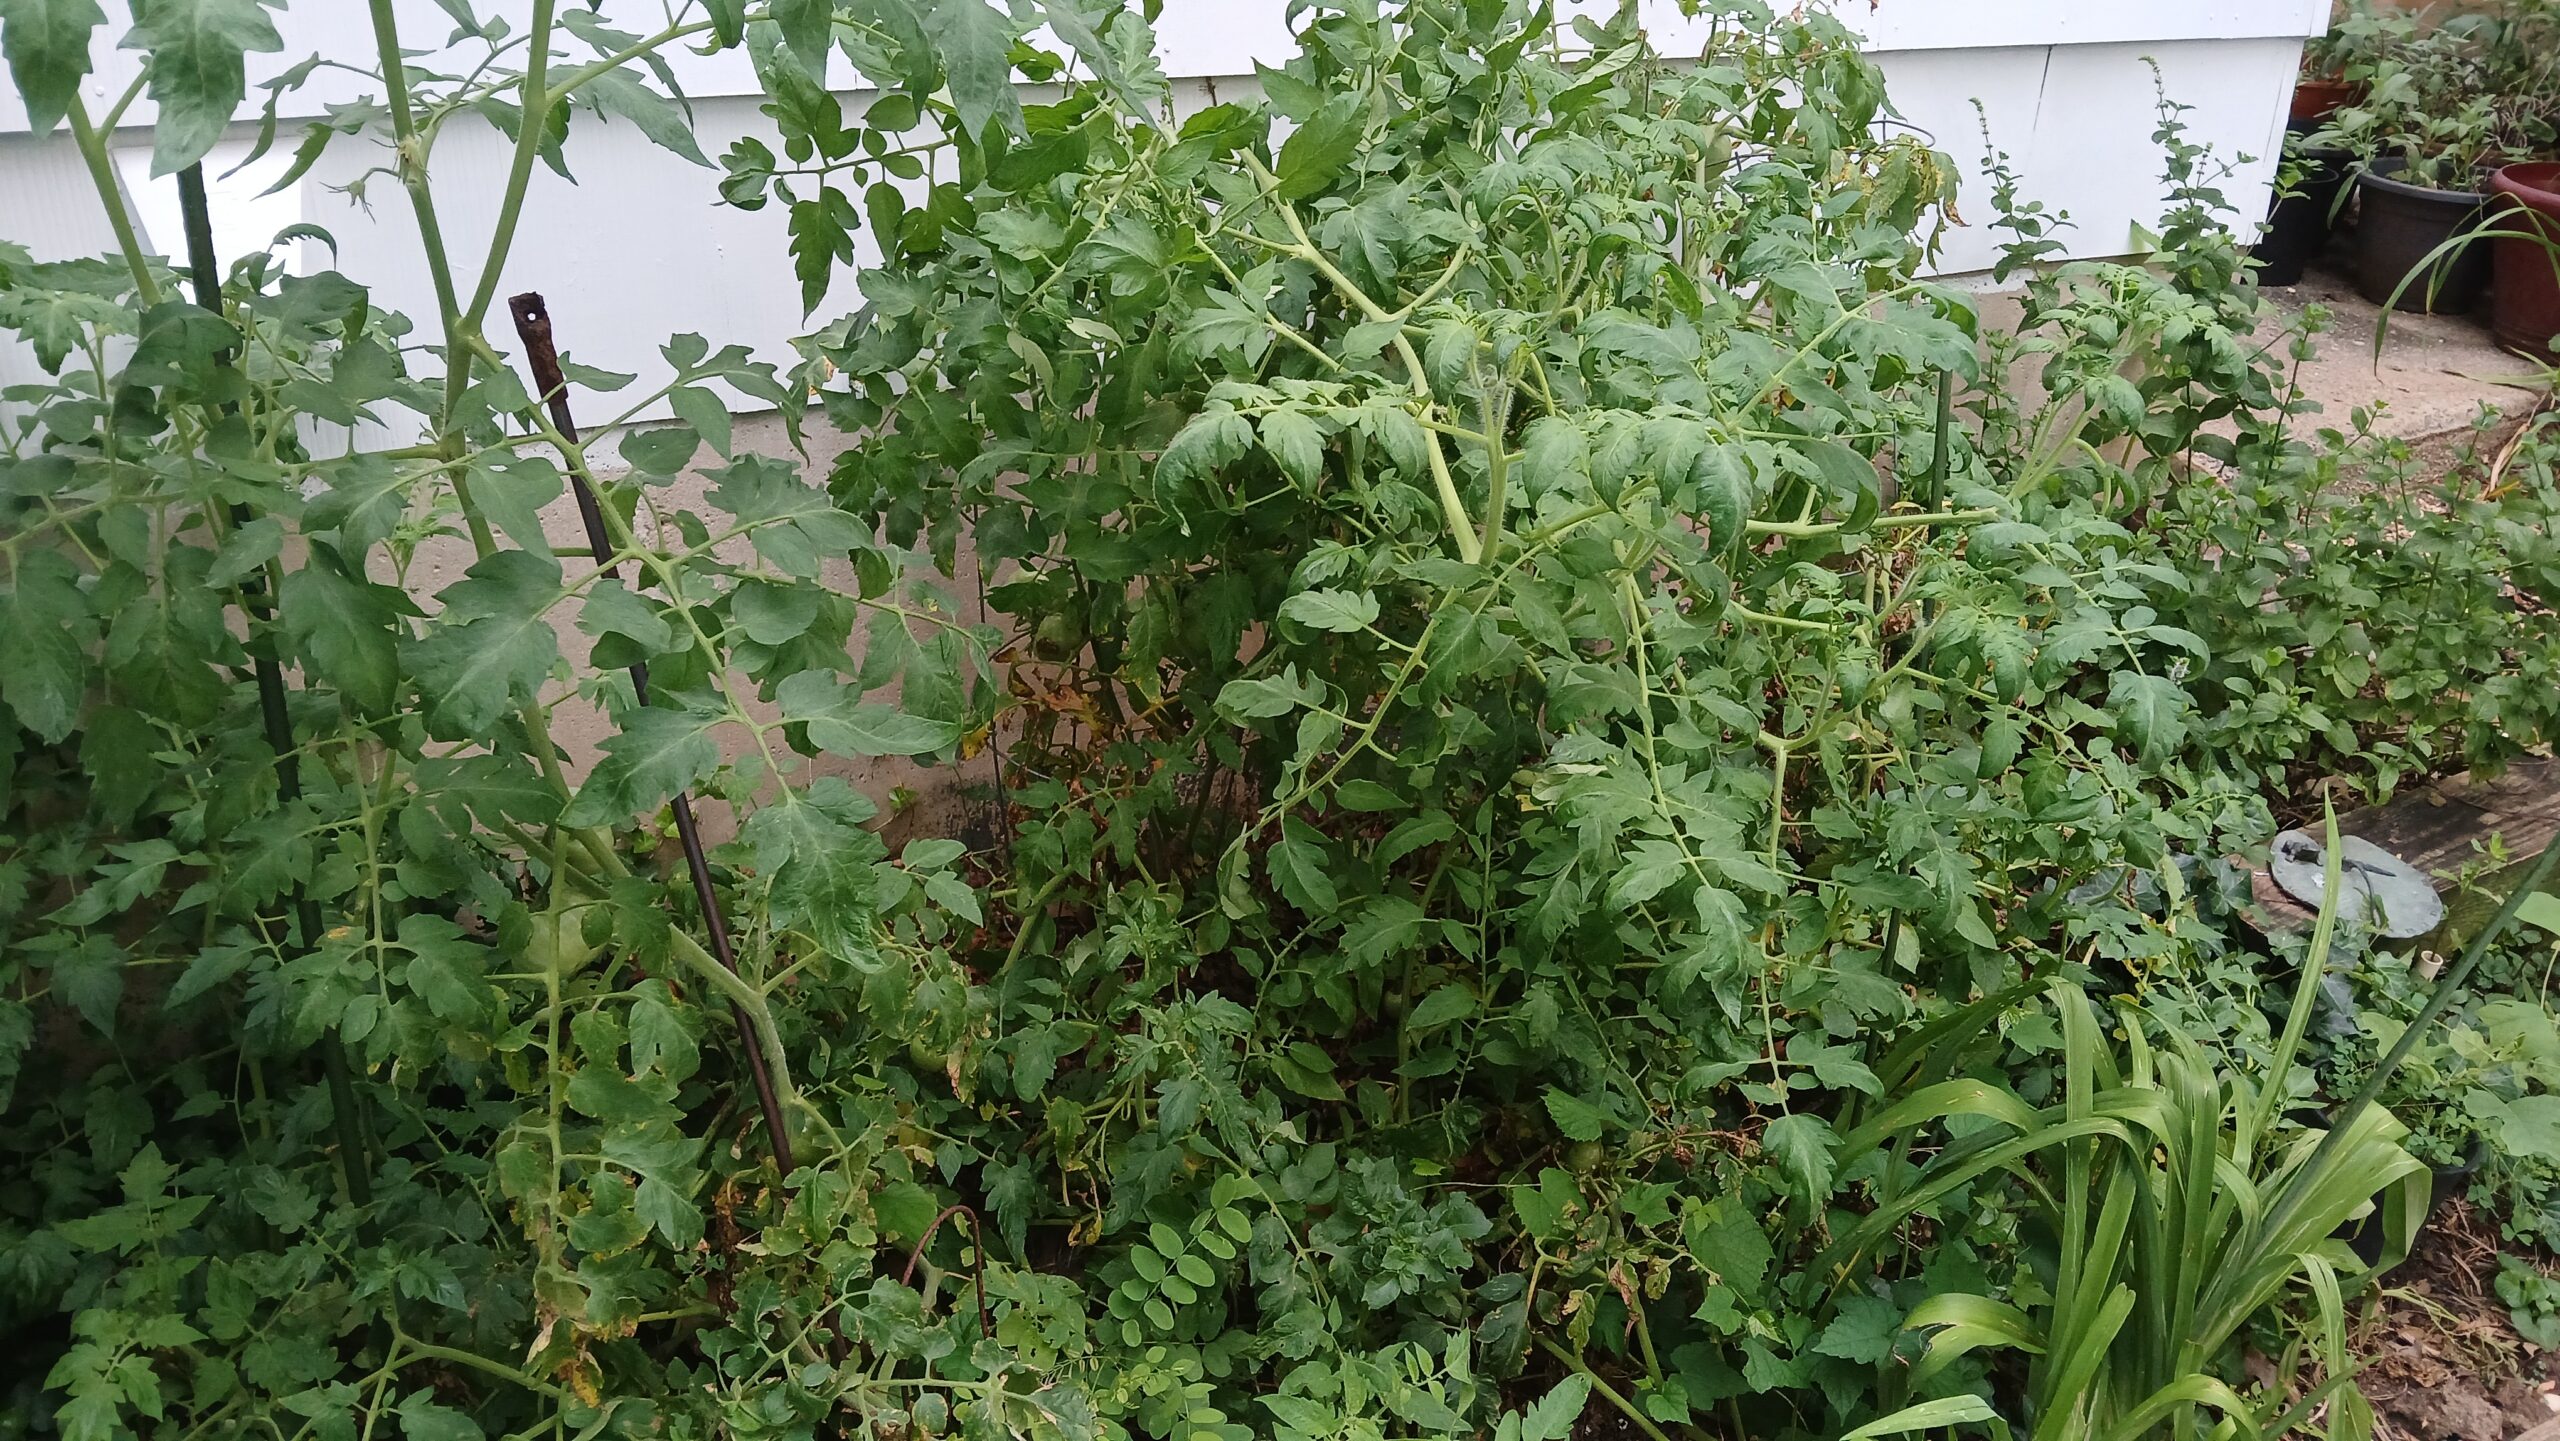
Large containers are planted with a mixture of trees, companion plants, and climbing vegetables.
Beans are especially valuable because they naturally fix nitrogen in the soil through symbiotic bacteria living on their roots. This reduces fertilizer requirements while producing a fresh harvest throughout the growing season.
Other vegetables, herbs, flowers, and pollinator-friendly plants can also be incorporated depending on the available space.
Selecting Trees
A diverse mixture of trees provides the greatest resilience.
Both deciduous and evergreen (conifer) species should be included whenever practical.
Deciduous trees provide:
Dense shade during summer
Natural cooling through evapotranspiration
Autumn leaf mulch
Winter sunlight after leaves fall
Evergreens provide:
Year-round wind protection
Winter insulation
Wildlife shelter
Continuous carbon capture
Whenever possible, native species should be prioritized because they support local wildlife, require less maintenance, and are naturally adapted to regional conditions.
Nature often contributes to the experiment as well. Birds, squirrels, and the wind frequently plant volunteer seedlings that can be transplanted into containers.
During the Pennsylvania experiment, naturally occurring species included:
Black locust
Red maple
Oak
Sycamore
Black walnut
Additional conifer species were intentionally planted to maintain year-round coverage and maximize winter protection.
Summer Operation
During the hottest months, the containers are positioned over driveways, sidewalks, patios, parking areas, and other impervious surfaces.
These surfaces normally absorb enormous amounts of solar radiation before reradiating heat back into the surrounding air.
The movable trees interrupt this process by:
Blocking direct sunlight
Cooling the air through evapotranspiration
Reducing pavement temperatures
Lowering reflected heat reaching nearby buildings
Even modest reductions in surrounding temperatures can decrease air-conditioning demand while making outdoor spaces significantly more comfortable.
The planters also capture rainfall that would otherwise become runoff, allowing water to infiltrate the soil where it supports plant growth and evaporative cooling.
Winter Operation
As temperatures fall, the same planters are relocated around the home’s foundation and along prevailing wind directions.
Rows of evergreens create effective windbreaks that reduce wind speed before it reaches exterior walls.
Reducing wind exposure decreases convective heat loss from the building envelope, helping the home retain warmth while lowering heating costs.
The large soil volumes inside the containers also function as thermal mass. During sunny winter days, the soil absorbs solar energy and slowly releases heat after sunset, moderating temperature fluctuations around the foundation.
More Than Landscaping
The Birnam Wood Experiment demonstrates that landscaping can become an active component of home energy management rather than simply decoration.
Each planter performs multiple functions simultaneously:
Shades buildings
Insulates against winter winds
Produces food
Stores carbon
Improves biodiversity
Supports pollinators
Retains rainwater
Reduces erosion
Filters air pollutants
Beautifies the property
This multifunctional approach maximizes the return on every square foot of landscape.
Climate Benefits
Trees provide some of the most cost-effective climate solutions available to homeowners.
A well-designed mobile forest can help:
Reduce cooling energy demand
Lower heating costs
Decrease greenhouse gas emissions
Improve local air quality
Reduce urban heat island effects
Capture atmospheric carbon dioxide
Increase climate resilience during heat waves
Reduce pressure on stormwater systems
Because the trees can be repositioned as conditions change, the system remains flexible and can evolve as the landscape matures.
A Living Investment
Unlike many home improvements that slowly depreciate, healthy trees generally become more valuable over time. As they grow, they provide greater shade, stronger wind protection, increased carbon storage, more wildlife habitat, and larger harvests where edible species are included.
The Birnam Wood Experiment illustrates an important principle of climate adaptation: nature can be engineered to work alongside modern technology rather than replacing it. By treating trees as movable infrastructure instead of fixed landscape features, homeowners can create a dynamic, low-cost climate control system that saves money, reduces waste, strengthens local ecosystems, and lowers greenhouse gas emissions—all while bringing a little of Shakespeare’s legendary Birnam Wood to life.
Long-term field observations, remote-sensing data, and new climate-biosphere models now converge on a disturbing conclusion: Earth’s forests are undergoing rapid, nonlinear decline driven by a cascading series of human-induced stressors.
What began in 2001 as a study of visible canopy loss has evolved into documentation of a global systemic collapse. Satellite evidence confirms that large forest regions–including the African tropical moist broadleaf biome–have already shifted from net carbon sinks to net sources in a period of only seven years (Mensah et al. 2025).
These processes are not isolated. They are coupled, mutually reinforcing feedback loops capable of accelerating tree mortality far faster than traditional models predicted.
II. Sampling of Contributing Variables
A. Ozone Pollution: A Major Driver of Global Tree Decline
Pollution remains one of the most significant drivers of global tree decline—and one of the most underestimated.
At the center of this crisis is tropospheric ozone (O₃), a toxic oxidant produced through the atmospheric reactions of combustion byproducts, including nitrogen dioxide (NO₂), volatile organic compounds (VOCs), and methane (CH₄). Unlike the protective ozone layer in the stratosphere, ground-level ozone is a powerful biological toxin that damages vegetation, disrupts ecosystem function, and weakens Earth’s natural carbon storage capacity.
Climate change is increasingly understood not as a single forcing mechanism, but as a complex network of interacting atmospheric, ecological, chemical, and biological feedback loops. While carbon dioxide (CO₂) remains the dominant anthropogenic greenhouse gas, secondary feedback systems are becoming increasingly important in determining the trajectory, intensity, and structure of future warming.
Among these feedbacks, ozone occupies a uniquely important position because it functions simultaneously as:
a greenhouse gas;
a regulator of atmospheric chemistry;
a biological stressor;
and a climate feedback multiplier.
The ozone-driven feedback pathway can be summarized as:
Unlike many climate variables that operate primarily within a single subsystem, ozone directly connects:
atmospheric chemistry,
ecosystem health,
wildfire dynamics,
plant physiology,
atmospheric circulation,
and global carbon cycling.
As a result, ozone amplification mechanisms can accelerate warming indirectly by weakening the very biological systems responsible for removing carbon dioxide from the atmosphere.
Ozone-Induced Vegetation Damage
Ozone enters plant leaves through stomata, where it reacts with plant tissues and generates oxidative stress. This process damages cellular structures, disrupts normal plant metabolism, and reduces the ability of vegetation to capture and store carbon.
Ozone exposure:
damages foliage and suppresses photosynthesis;
reduces stomatal conductance and plant growth;
diminishes drought and heat tolerance;
increases vulnerability to pests, pathogens, and wildfire.
Decades of research demonstrate that ozone exposure can reduce plant growth by 10–40%, depending on species sensitivity, ozone concentration, and duration of exposure. In many cases, ozone exposure does not merely slow growth—it can kill plants outright, either through direct damage to leaves and roots or by weakening their ability to survive additional environmental stressors.
This creates a compounding cycle of ecosystem vulnerability. Ozone-stressed vegetation becomes increasingly susceptible to drought, extreme heat, insects, disease, and fire, accelerating forest decline and undermining the natural systems that sustain human civilization.
Ozone and Declining Global Carbon Uptake
The impacts of ozone pollution extend beyond individual trees. Forests, grasslands, wetlands, and soils have historically absorbed a substantial fraction of human carbon emissions, functioning as critical components of Earth’s climate regulation system.
Increasing ozone exposure threatens this stabilizing mechanism.
As ozone suppresses photosynthesis and damages vegetation:
forest productivity declines;
drought resilience weakens;
carbon storage capacity deteriorates;
ecosystem mortality increases.
Multiple peer-reviewed studies confirm that ozone pollution has significantly reduced net primary productivity (NPP), particularly in sensitive agricultural regions and forest ecosystems. In some ecosystems, productivity losses have been measured at 20–70%, depending on species sensitivity and exposure levels.
More concerning, global observations indicate that forest carbon sinks are under increasing stress, with some regions showing reduced carbon uptake and movement toward carbon neutrality or carbon-source behavior. This transition represents a major threat because it removes one of Earth’s most important mechanisms for moderating atmospheric CO₂ concentrations.
Ozone, Wildfires, and Cascading Climate Feedbacks
Ozone pollution is deeply interconnected with fossil fuel combustion, warming, drought, and wildfire activity.
Fossil fuel combustion increases both CO₂ emissions and ozone precursors. Ozone then damages vegetation, reducing ecosystem resilience and increasing vulnerability to drought, pests, disease, and wildfire. Wildfires release additional CO₂ and generate new ozone precursors, reinforcing the cycle.
All forms of carbon combustion generate ozone precursors, and less efficient combustion processes can produce greater ozone formation per unit of energy released due to incomplete combustion. These interacting processes create a reinforcing system in which atmospheric pollution and climate change amplify one another.
The result is a transition toward a state of compound, cascading instability, where multiple reinforcing feedback mechanisms accelerate ecosystem disruption beyond what would be expected from linear climate responses alone.
Long-Term Field Observations: Pennsylvania Forest Decline
Long-term field observations in Pennsylvania illustrate these broader ecosystem dynamics.
Since 2003, old-growth trees have consistently experienced approximately 40% foliage loss over multi-year intervals, eventually leading to premature mortality. This decline is evident not only in canopy density but also in vertical forest structure, with canopy height declining by approximately 33% over the same period.
These localized observations mirror the broader global pattern of declining forest resilience. Increasing ozone exposure, combined with rising temperatures and other environmental stressors, is contributing to progressive canopy degradation and ecosystem instability.
Ozone as a Climate Multiplier
The greatest danger of ozone pollution is its ability to weaken Earth’s natural climate regulation systems.
Historically, forests and other terrestrial ecosystems removed large quantities of CO₂ from the atmosphere. However, increasing ozone stress threatens this essential function by reducing plant productivity and weakening ecosystem resilience.
As ozone exposure increases:
forests absorb less carbon;
vegetation becomes less resilient to climate extremes;
ecosystem recovery slows;
mortality rates increase;
wildfires increase
and carbon storage capacity declines.
Over time, ecosystems that once acted as powerful carbon sinks may transition toward carbon neutrality and, in severely stressed regions, become net sources of carbon emissions.
Ozone therefore represents a critical climate multiplier: a human-generated pollutant that simultaneously contributes to warming, damages vegetation, reduces carbon uptake, and weakens one of Earth’s most important mechanisms for regulating atmospheric carbon concentrations.
Wildfires are emerging as a major threat to global carbon sequestration capacity. Fire seasons are lengthening, while wildfires are becoming more frequent, widespread, and intense. This represents a global phenomenon, with regions such as Canada and Siberia becoming areas of particular concern due to the scale of their forests, the amount of carbon stored in vegetation and soils, and the potential for large-scale feedback effects.
Healthy forests function as critical carbon sinks by absorbing atmospheric CO₂ through photosynthesis and storing carbon in biomass and soils. However, increasingly severe wildfires can rapidly reverse this process by releasing decades to centuries of stored carbon back into the atmosphere.
The wildfire feedback cycle is accelerating:
Climate Warming → Hotter and Drier Conditions → Increased Vegetation Stress → Larger Wildfires → CO₂ and Methane Emissions → Additional Warming → More Extreme Fire Conditions
Wildfires contribute to climate destabilization through multiple pathways:
Carbon dioxide (CO₂) emissions: Burning forests releases large quantities of stored carbon, reducing the ability of ecosystems to offset human emissions.
Methane (CH₄) emissions: Incomplete combustion produces methane, a highly potent greenhouse gas that further amplifies warming.
Ozone formation: Wildfire emissions release nitrogen oxides (NOₓ) and volatile organic compounds (VOCs), which contribute to the formation of tropospheric ozone. This ozone further damages surviving vegetation and reduces future carbon uptake.
Ecosystem degradation: Severe fires can destroy mature forests, damage soils, eliminate seed sources, and slow or prevent natural regeneration.
Canada and Siberia are especially important because their vast boreal forests store enormous quantities of carbon. As warming accelerates, these ecosystems are increasingly vulnerable to drought, insect outbreaks, permafrost degradation, and extreme fire events. The resulting emissions create a dangerous feedback loop in which forests that historically served as long-term carbon sinks increasingly become sources of atmospheric carbon.
The interaction between wildfire emissions, ozone pollution, methane release, and declining vegetation resilience represents a compound climate feedback system:
As these feedback mechanisms intensify, wildfire activity becomes more than a regional ecological disturbance—it becomes a global factor capable of accelerating carbon-cycle disruption and undermining one of Earth’s most important climate stabilization systems.
C. Water Stress: Climatic Whiplash
Modern forests are increasingly exposed to climatic whiplash—rapid and extreme transitions between opposite water-related stresses. Instead of experiencing gradual seasonal changes, many ecosystems now face abrupt shifts from prolonged drought to intense rainfall, creating physiological instability that trees are poorly adapted to withstand. These alternating extremes disrupt root systems, weaken tree defenses, accelerate disease, and increase mortality.
1. Drought: Hydraulic Failure and Forest Decline
Recent decades have experienced an unprecedented increase in the frequency, duration, and severity of drought events. Rising temperatures intensify drought by increasing evaporation, drying soils, and increasing atmospheric demand for water. Even when annual precipitation remains relatively stable, warmer conditions can create effective drought by causing plants to lose water faster than ecosystems can replenish it.
During prolonged drought, trees experience several cascading stresses:
Hydraulic failure: As soil moisture declines, trees struggle to transport water from roots to leaves through their vascular systems. Extreme water deficits can cause air bubbles (embolism) to form in xylem vessels, interrupting water flow and leading to canopy dieback.
Reduced photosynthesis: Stomata close to conserve water, limiting carbon dioxide uptake and reducing the tree’s ability to produce energy.
Carbon starvation: Continued drought forces trees to consume stored energy reserves for survival, leaving fewer resources for growth, reproduction, and defense.
Increased vulnerability to pests and pathogens: Water-stressed trees produce fewer defensive compounds, allowing insects such as bark beetles and fungal diseases to spread more easily.
Wildfire amplification: Dry vegetation, dead branches, and weakened forests create more available fuel, increasing fire intensity and ecosystem damage.
Drought stress is especially damaging when combined with rising temperatures because heat and water loss reinforce each other. A hotter atmosphere can extract more moisture from vegetation, producing a feedback loop in which stressed forests become increasingly unable to recover.
2. Excess Rain and Acid Rain: Flooding, Nutrient Loss, and Soil Degradation
Climate change is also increasing the occurrence of extreme precipitation events, creating the opposite form of water stress. Intense rainfall can overwhelm soils, saturate root zones, and damage forests through erosion, nutrient loss, and chemical changes.
Excess rainfall—often occurring after drought conditions—creates a form of hydrological shock:
Root oxygen deprivation: Waterlogged soils prevent roots from receiving sufficient oxygen, impairing nutrient uptake and causing root decay.
Soil erosion: Heavy rainfall removes topsoil, organic matter, and essential minerals needed for long-term forest productivity.
Nutrient leaching: Increased precipitation can wash away calcium, magnesium, potassium, and other micronutrients from the soil profile, weakening tree growth and resilience.
Canopy damage: Severe storms, high winds, and saturated branches can cause physical injury, broken limbs, and increased susceptibility to pathogens.
In addition, rainfall can become more chemically damaging when combined with atmospheric pollutants. Acid deposition, produced primarily from sulfur dioxide (SO₂) and nitrogen oxides (NOₓ), alters soil chemistry by lowering pH and disrupting nutrient availability. Acidic precipitation can:
Dissolve essential minerals from soils.
Mobilize toxic metals such as aluminum, which can damage fine roots.
Reduce beneficial microbial activity needed for nutrient cycling.
Impair trees’ ability to absorb water and nutrients.
The interaction between excessive rainfall and acidification creates a compounding stress: water may be abundant, yet the soil environment becomes increasingly hostile to plant survival.
3. The Drought–Flood Cycle: A New Ecological Stress Pattern
The greatest threat is not drought or excessive rainfall alone, but the increasing frequency of rapid transitions between extremes. A forest weakened by drought may not recover when heavy rains arrive because damaged roots, depleted energy reserves, and altered soils reduce its ability to absorb and utilize water.
As climate variability intensifies, forests are increasingly subjected to conditions outside their historical range. The result is a destabilized water cycle in which trees experience simultaneous stress from too little water, too much water, and declining water quality—accelerating canopy loss, ecosystem degradation, and forest mortality.
1. Why Soil May Be the Most Important Piece of the Climate Change Puzzle
Global warming is driven by an increase in thermal energy within Earth’s climate system. This system is composed of interconnected subsystems, including the atmosphere, oceans, land, and biosphere. Because these components interact continuously through complex feedback mechanisms, climate change is not a simple linear process but a dynamic system governed by nonlinear relationships.
Chaos theory highlights the complexity and sensitivity of these interconnected systems, and nowhere is this complexity more evident than in the interactions between soil, the atmosphere, oceans, and living organisms.
What makes soil uniquely important in addressing the climate crisis is that soil is alive. Unlike the atmosphere and oceans, which are primarily composed of inorganic matter and respond mainly through physical and chemical processes, soil is a dynamic biological system containing billions of organisms, including fungi, bacteria, microbes, insects, and plant roots.
These organisms regulate essential Earth-system processes, including:
carbon sequestration;
nutrient cycling;
water storage and infiltration;
plant productivity;
ecosystem resilience;
and atmospheric carbon exchange.
Healthy soil provides one of the most adaptable and powerful natural mechanisms for slowing climate feedback loops. It functions not merely as a physical substrate for plant growth, but as a living carbon reservoir capable of storing enormous quantities of organic carbon.
Soil as a Global Carbon Reservoir
Healthy soils act as major carbon sinks by capturing carbon dioxide (CO₂) through plant growth and transferring carbon into organic matter. Microbial communities and soil organisms then stabilize and store this carbon for extended periods.
However, when soil becomes degraded, this stored carbon is released back into the atmosphere, accelerating climate change.
When soil ecosystems collapse, they can enter a state of desertification—a transformation in which once-productive land loses biological function and becomes increasingly unable to support vegetation.
Desertification represents a critical loss of ecosystem capacity. As soils become barren:
carbon sequestration declines;
moisture retention decreases;
erosion accelerates;
biodiversity collapses;
and land becomes increasingly vulnerable to drought and extreme heat.
The result is a shift from soil functioning as a climate stabilizer to becoming a contributor to climate instability.
Soil Degradation and Desertification
Erosion
Loss of topsoil through deforestation, overgrazing, intensive agriculture, and poor land management removes the most biologically active and carbon-rich layer of soil. This reduces fertility, water retention, and ecosystem productivity.
Loss of Soil Structure
Disturbance from intensive agriculture, deforestation, and chemical degradation reduces soil porosity and infiltration capacity. Compacted soils limit root growth, reduce water absorption, and increase runoff and erosion.
Decreased Carbon Sequestration
The loss of organic matter reduces the soil’s ability to store carbon. As microbial communities decline and soil structure deteriorates, carbon previously locked underground can return to the atmosphere.
Loss of Biodiversity
Healthy soils depend on diverse microbial, fungal, plant, and animal communities. Declining biodiversity weakens nutrient cycling, reduces ecosystem resilience, and limits the ability of soils to recover from climate stress.
Increased Climate Vulnerability
Degraded soils amplify climate extremes by increasing:
drought severity through reduced water retention;
flooding through increased runoff;
heat stress through loss of vegetation cover;
and wildfire risk through increased dryness and vegetation stress.
Saltwater Intrusion and Soil Collapse
Rising seas and changing hydrological patterns are increasing saltwater intrusion into coastal soils. Increased salinity creates multiple stress pathways:
reduced plant growth and impaired nutrient uptake;
degradation of soil structure through chemical disruption;
compaction and poor drainage;
nutrient imbalance affecting plant metabolism;
salt toxicity that damages vegetation and reduces biodiversity.
Once soils become highly saline, restoration is often difficult, expensive, and resource-intensive.
Desertification and Savannization
Desertification transforms fertile ecosystems into increasingly arid and unproductive landscapes. This process reduces vegetation cover, decreases carbon storage, accelerates erosion, and creates additional warming feedbacks.
Savannization represents a major biome transition in which dense forests—particularly tropical forests—shift toward open savanna ecosystems. This transformation can occur when moisture recycling declines and fire feedbacks intensify.
The loss of forests reduces evapotranspiration, decreases regional rainfall generation, and creates conditions that further reinforce ecosystem drying.
2. Insect Collapse: The Hidden Breakdown of Earth’s Biological Infrastructure
Climate change is not only transforming the atmosphere, oceans, and visible landscapes of Earth. It is also disrupting one of the planet’s most important hidden systems: the living biological network beneath and within ecosystems.
Soil and insect communities exist in a highly interconnected relationship. Insects regulate critical ecological processes, including:
decomposition;
nutrient cycling;
carbon storage;
soil aeration;
water movement;
and the physical structure of soil.
As global temperatures rise and extreme weather events intensify, these relationships are being pushed beyond their historical limits.
Soil insects, particularly ectothermic organisms whose body temperatures are controlled by environmental conditions, are highly vulnerable to:
rising temperatures;
drought;
flooding;
habitat destruction;
pesticide exposure;
and ecosystem instability.
At the same time, declining insect populations weaken the biological processes that maintain soil health. As insects disappear, decomposition slows, nutrient cycling is disrupted, and soil structure deteriorates.
The collapse of soil-insect systems represents far more than a biodiversity crisis. It threatens one of Earth’s largest carbon reservoirs and one of humanity’s most important life-support systems.
As subterranean ecosystems deteriorate, the impacts extend upward into:
agricultural productivity;
forest health;
wildfire dynamics;
atmospheric carbon cycling;
food security;
and human health.
The decline of soil biodiversity represents a fundamental disruption of the biological infrastructure that supports planetary stability. As these hidden ecosystems weaken, Earth’s ability to regulate climate and sustain life becomes increasingly compromised.
D. Pests
1. Insects and Worms
Insect collapse, soil invertebrate disruption, and worm invasions are novel climate-linked stressors.
2. Invasive Species
Invasive insects and plants–including ailanthus, emerald ash borer, and Asian longhorn beetle–destabilize forests.
3. Short, Warm Winters
At -17.8 °C: only 5% of emerald ash borer larvae die
At -34 °C: 98% mortality
E. Climate Change Feedback Loops
Warming → drought → tree death → reduced carbon sink → more warming
The evidence presented throughout this paper points to a single overarching conclusion: the global decline of trees is not being driven by one environmental stressor, but by the convergence of many reinforcing stressors acting simultaneously. Ozone pollution, prolonged drought, extreme rainfall, soil degradation, insect collapse, wildfire, invasive pests, and a warming climate are no longer isolated problems. They interact through complex feedback loops that weaken forests faster than they can recover.
Trees evolved under relatively stable climatic conditions. Today’s rapidly changing environment is pushing many species beyond their physiological limits. Chronic ozone exposure reduces photosynthesis and weakens plant defenses. Water stress alternates between prolonged drought and extreme flooding, damaging root systems and disrupting nutrient cycling. Degraded soils lose their ability to store carbon and support healthy microbial communities. Declining insect populations impair decomposition and nutrient recycling, while larger, more frequent wildfires release enormous quantities of carbon dioxide, methane, and ozone precursors back into the atmosphere. Each stressor amplifies the others, producing cascading effects throughout the biosphere.
The consequences extend far beyond the loss of forests themselves. Trees regulate atmospheric carbon dioxide, moderate local and regional climates, recycle water through evapotranspiration, stabilize soils, protect biodiversity, and sustain the ecological processes upon which agriculture and human civilization depend. As forests decline, these essential ecosystem services weaken, increasing the likelihood of additional climate feedbacks that further accelerate environmental change.
Perhaps the most troubling aspect of this process is that forests are not simply victims of climate change—they are also one of Earth’s primary defenses against it. As tree mortality increases, the planet loses one of its largest natural carbon sinks, reducing its capacity to remove carbon dioxide from the atmosphere precisely when that function is needed most. A weakening biosphere becomes less capable of buffering human emissions, allowing warming to accelerate through self-reinforcing feedback mechanisms.
Despite the magnitude of these challenges, the trajectory is not predetermined. Many of the primary drivers of forest decline—including fossil fuel combustion, ozone precursor emissions, habitat destruction, unsustainable land management, and ecosystem fragmentation—are the direct result of human activity. Actions that reduce air pollution, restore soils, protect mature forests, improve watershed management, reduce wildfire risk, conserve biodiversity, and rapidly transition to low-emission energy systems can strengthen ecosystem resilience and slow the progression of these feedback loops.
The future of Earth’s forests will play a central role in determining the future of Earth’s climate. Protecting trees is no longer simply an issue of conservation or biodiversity—it is a prerequisite for maintaining the stability of the global climate system and the ecological foundation upon which human societies depend. Understanding the interconnected nature of these environmental stressors is therefore essential if we are to preserve both the world’s forests and the life-support systems they sustain.
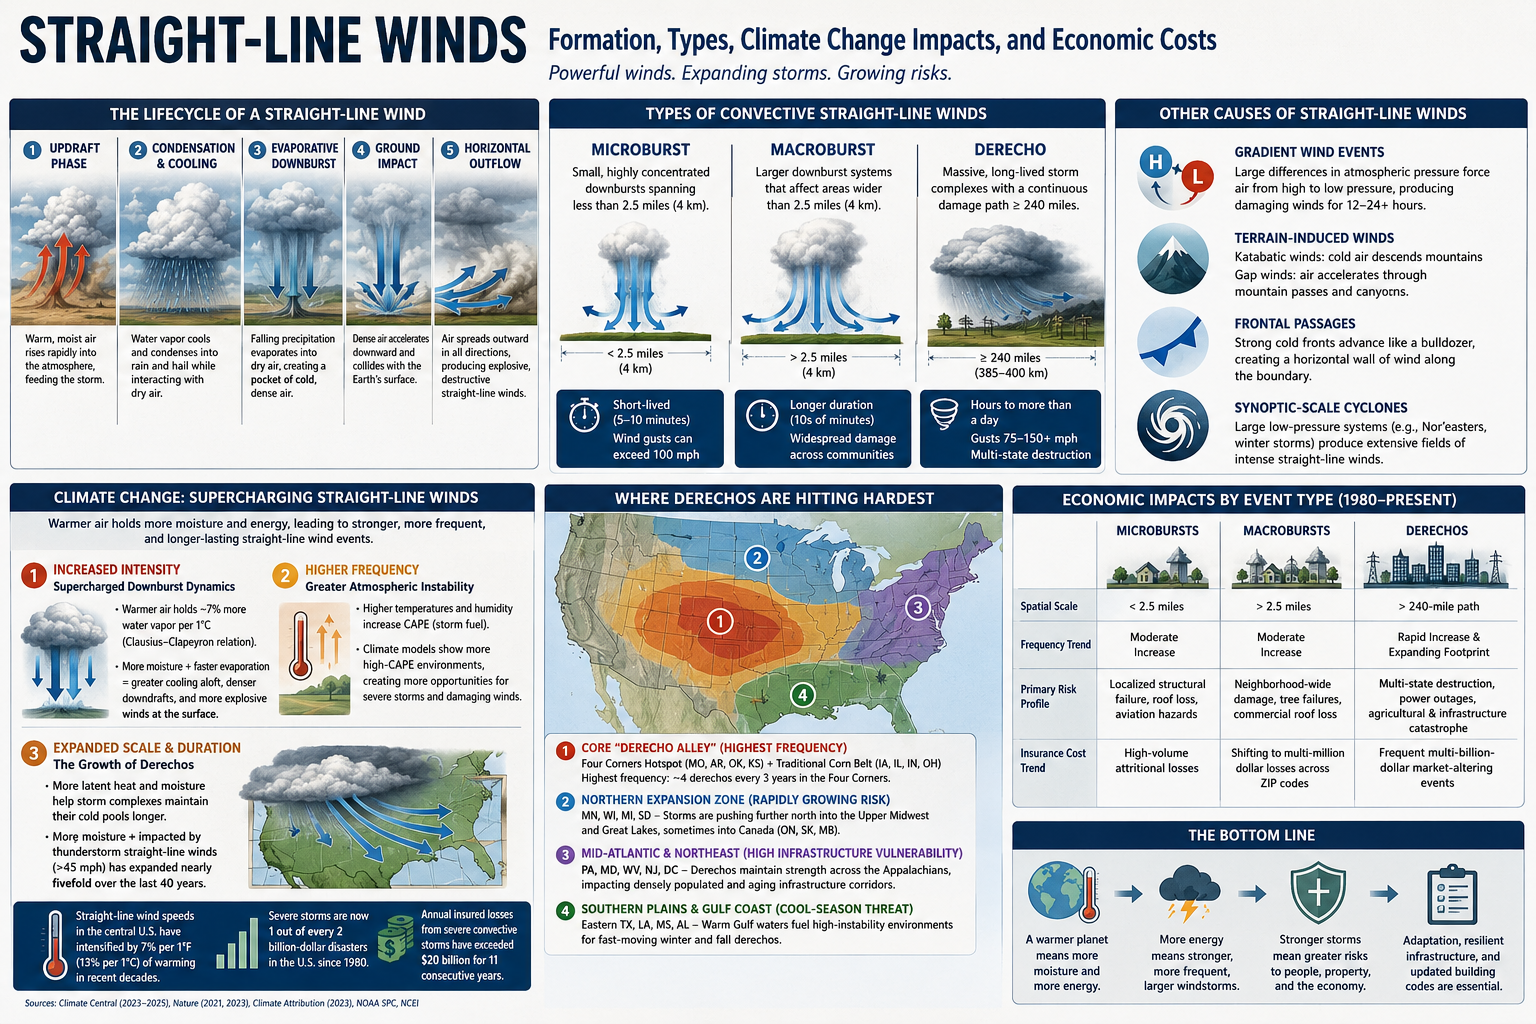
Straight-line winds are among the most destructive weather hazards on Earth, yet they often receive far less public attention than tornadoes and hurricanes. These powerful, non-rotational winds can flatten forests, rip roofs from buildings, topple power lines, and cause widespread infrastructure failures. In many cases, the damage resembles the aftermath of a tornado or even a hurricane.
Unlike tornadoes, which concentrate damage within a rotating vortex, straight-line winds can devastate broad regions simultaneously. Wind speeds frequently exceed 70–100 mph and, in extreme cases, may surpass 140 mph. Because they can strike with little warning and affect large geographic areas, straight-line wind events represent a growing hazard to communities, transportation systems, utilities, and the insurance industry.
Emerging research indicates that climate change is altering the atmospheric ingredients that produce severe convective storms. As the atmosphere warms and stores more energy, straight-line wind events are becoming more frequent, more destructive, and increasingly widespread. These changes are transforming severe convective storms into one of the fastest-growing sources of weather-related economic losses in the United States.
What Are Straight-Line Winds?
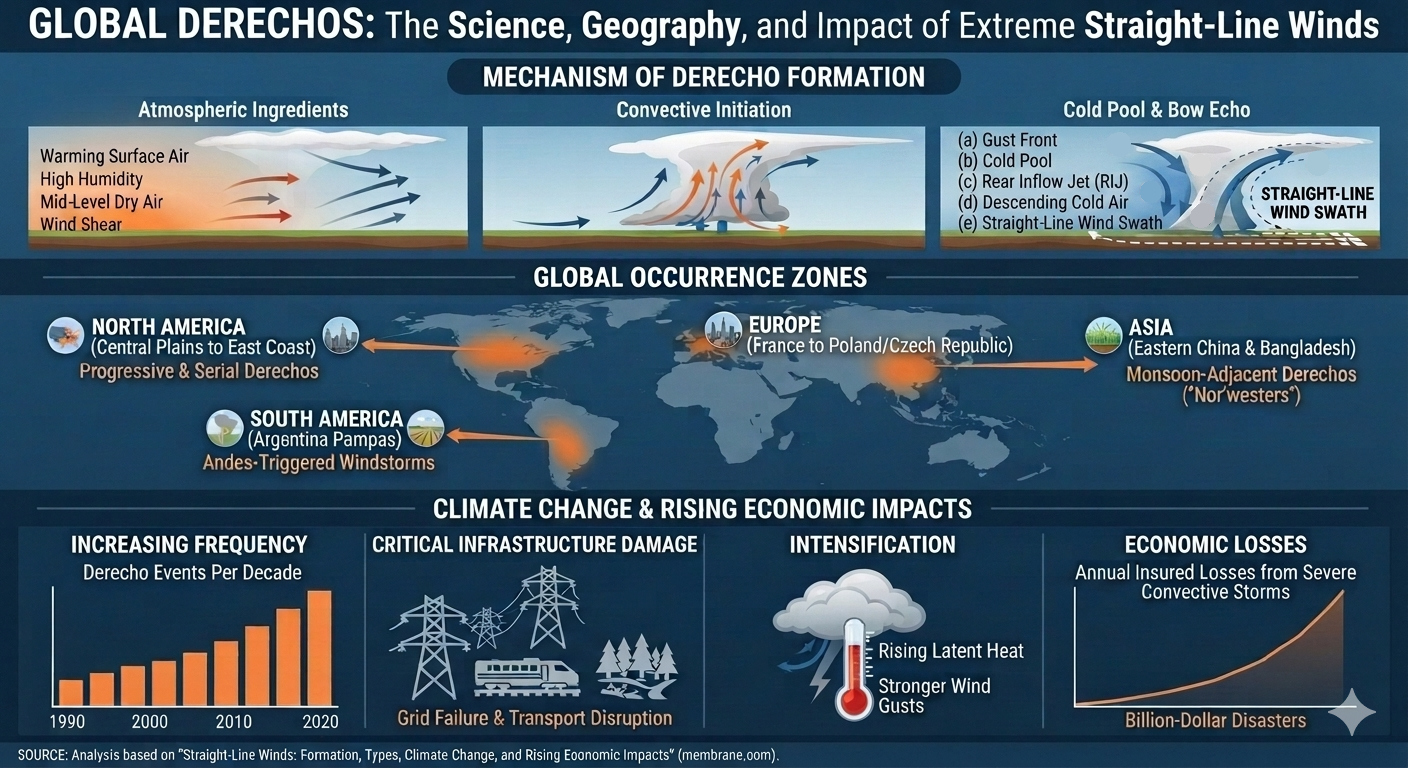
Straight-line winds are powerful horizontal winds that move outward from their source without rotating. They are most commonly produced by the downward plunge and subsequent outward surge of rain-cooled air from severe thunderstorms.
Unlike tornadoes, which draw air inward and rotate violently around a central vortex, straight-line winds push air exclusively outward along the ground. Despite this difference, their destructive potential can rival or even exceed that of weak-to-moderate tornadoes.
The Lifecycle of a Straight-Line Wind Event
1. Updraft Phase
Warm, moist air rises rapidly into the atmosphere, feeding the development of a growing thunderstorm.
2. Condensation and Cooling
As water vapor ascends, it cools and condenses into rain and hail while interacting with surrounding layers of drier air.
3. Evaporative Downburst Formation
Falling precipitation evaporates into dry air aloft. Because evaporation absorbs heat, it creates a large pocket of extremely cold, dense air.
4. Ground Impact
This dense air mass accelerates downward as a powerful downdraft and collides with Earth’s surface.
5. Horizontal Outflow
Upon impact, the descending air can no longer move downward. Instead, it compresses and surges outward in all directions, producing an explosive burst of destructive straight-line winds.
Classification of Convective Straight-Line Wind Events
Meteorologists classify thunderstorm-generated straight-line winds according to their size and duration.
Microbursts
Microbursts are highly concentrated downbursts spanning less than 2.5 miles (4 km). Although typically lasting only five to ten minutes, they can produce sudden wind gusts exceeding 100 mph and are particularly dangerous because of their intensity and lack of warning.
Macrobursts
Macrobursts are larger downburst systems that spread destruction across areas wider than 2.5 miles (4 km) and often persist significantly longer than microbursts.
Derechos
Derechos are massive, long-lived convective storm systems that produce continuous swaths of wind damage extending at least 240–250 miles (385–400 km). By definition, derechos generate sustained winds of at least 58 mph, with gusts commonly ranging between 75 and 150 mph.
Other Causes of Straight-Line Winds
Although convective downbursts are the most common source of straight-line winds, meteorologists classify any non-rotational horizontal wind as a straight-line wind, regardless of its origin.
Gradient Wind Events
These winds arise from large differences in atmospheric pressure. Air naturally flows from areas of high pressure toward low pressure. When powerful pressure systems are positioned close together, the resulting pressure gradient can accelerate air to damaging speeds. Unlike thunderstorm downbursts that last only minutes, gradient wind events can persist for 12 to 24 hours or longer.
Terrain-Induced Winds
Mountain landscapes frequently create severe straight-line winds.
Katabatic Winds: Cold, dense air descends from elevated plateaus or ice sheets under the influence of gravity, accelerating dramatically before spreading across valleys below.
Examples include:
Santa Ana winds in California
Bora winds in southeastern Europe
Gap Winds: Air masses forced through narrow mountain passes and canyons become compressed and accelerated, producing intense horizontal wind speeds.
Frontal Passages
The leading edge of a strong cold front can generate destructive straight-line winds. As dense cold air advances, it acts like an atmospheric bulldozer, forcing warmer air upward and creating a powerful wall of horizontal wind along the frontal boundary.
Synoptic-Scale Extratropical Cyclones
Large non-tropical low-pressure systems, such as Nor’easters and major winter storms, produce extensive fields of intense straight-line winds through tightly packed pressure gradients extending across hundreds of miles.
Climate Change and the Intensification of Straight-Line Winds
Climate change directly influences the atmospheric variables that fuel severe convective storms, causing thunderstorm-generated straight-line winds to become more frequent, intensely destructive, and geographically expanded.
Research synthesized by Climate Central and peer-reviewed studies published in Nature indicates that straight-line wind speeds across portions of the central United States have already intensified by approximately 7% per 1°F (13% per 1°C) of atmospheric warming during recent decades.
Several physical mechanisms are driving these changes.
The fundamental engine behind a straight-line wind event is the evaporative downburst. Climate change amplifies this process in multiple ways.
Higher Atmospheric Moisture Capacity
According to the Clausius-Clapeyron relationship, a warmer atmosphere can hold approximately 7% more water vapor for every 1°C increase in temperature. This additional moisture allows thunderstorms to contain substantially greater amounts of precipitation.
Enhanced Evaporative Cooling
When this larger volume of precipitation falls through relatively dry layers of air, evaporation occurs more rapidly. The evaporation dramatically cools the descending air, making it denser and heavier than its surroundings.
The greater the temperature contrast between the chilled downdraft and the surrounding environment, the faster the air accelerates downward. The result is a more violent impact at the surface and stronger, more destructive straight-line wind speeds.
Severe convective storms require highly unstable atmospheric conditions.
Elevated Convective Available Potential Energy (CAPE)
Warmer temperatures and increased humidity elevate Convective Available Potential Energy (CAPE), a measure of the energy available for thunderstorm development.
More Severe Storm Environments
Advanced climate models consistently project increases in high-CAPE environments under continued greenhouse gas forcing. These environments provide more opportunities for ordinary thunderstorms to intensify into severe systems capable of producing damaging straight-line winds.
3. Expanded Scale and Duration: The Growth of Derechos
Climate change also appears to be altering the longevity and geographic footprint of large convective systems.
Longer-Lived Storm Complexes
A warmer atmosphere contains greater amounts of latent heat and moisture, enabling storm systems to maintain their rain-cooled cold pools for longer periods. Because these cold pools drive storm propagation, straight-line wind events can persist over hundreds of miles.
Fivefold Geographic Expansion
Research summarized by Climate Attribution indicates that the total area affected by thunderstorm-generated straight-line winds exceeding 45 mph has expanded nearly fivefold during the past forty years. Regions farther north and east that historically experienced fewer severe wind events are increasingly experiencing high-intensity derecho systems.
The Severe Convective Storm Crisis
The financial consequences of straight-line winds have fundamentally changed since 1980. Driven by climate change, expanding development patterns, and inflation, severe convective storms have become the most frequent billion-dollar disaster category in the United States.
According to Climate Central, severe storms now account for approximately one out of every two billion-dollar weather disasters recorded since 1980. Annual insured losses from severe convective storms that generally remained below $5 billion during the 1980s have evolved into an eleven-year streak of annual losses exceeding $20 billion.
Comparing Straight-Line Wind Types and Their Economic Impacts
Neighborhood-wide damage and extensive tree failures
Multi-state infrastructure destruction and widespread power outages
Insurance Cost Trend
High-volume attritional losses
Increasing multi-million-dollar localized losses
Frequent multi-billion-dollar catastrophe events
Economic Impacts by Event Type
Microbursts and Macrobursts: The Aggregate Loss Problem
Microbursts and macrobursts generally function as localized “attritional losses” for the insurance industry. Individually, most events do not exceed catastrophe thresholds. However, their increasing frequency means they collectively generate billions of dollars in annual claims.
As residential development has expanded into previously rural areas, localized downbursts increasingly strike populated communities. The financial impact often manifests through:
Roof replacements
Siding damage
Broken windows
Vehicle losses
Fallen tree claims
Localized business interruptions
Although these events rarely dominate national headlines, their cumulative economic impact has become enormous.
Derechos: The Multi-Billion-Dollar Market Shifters
Derechos represent the fastest-growing financial threat among straight-line wind events.
Geographic Expansion
Greater atmospheric moisture allows derecho complexes to maintain their structure over much longer distances. Storms increasingly extend into regions where infrastructure and housing stock were not designed to withstand sustained horizontal winds of 80–110 mph.
Hurricane-Scale Damage
Events such as the 2020 Midwest Derecho, which caused more than $11 billion in damages, demonstrated that a single modern derecho can inflict destruction comparable to that of a major landfalling hurricane.
Consequences frequently include:
Regional power grid failures
Agricultural devastation
Widespread commercial losses
Transportation disruptions
Long-duration business interruptions
Extensive residential destruction
Geographic Shifts in Derecho Risk: Expanding Beyond Traditional Boundaries
The United States Midwest and the Corn Belt are experiencing the most severe impacts and greatest geographic expansion associated with intensifying derechos. Although a climatological “hot zone” for these storms has long existed in the central United States, climate change appears to be altering the environmental conditions that govern their formation and propagation.
Warmer atmospheric temperatures, increased moisture availability, and persistent summer heat domes are creating environments capable of sustaining larger and longer-lived convective systems. As a result, regions that historically experienced relatively infrequent derecho activity are increasingly facing severe straight-line wind events with multi-billion-dollar consequences.
1. The Core “Derecho Alley”: Highest Frequency and Agricultural Exposure
Similar to the nation’s Tornado Alley, a region often referred to as Derecho Alley experiences the highest baseline concentration of derechos in North America, averaging approximately one major event each year.
The Four Corners Hotspot
The area encompassing:
Southwest Missouri
Northwest Arkansas
Northeast Oklahoma
Southeast Kansas
records the highest historical frequency of derechos, averaging roughly four major events every three years.
The Traditional Corn Belt
Immediately east lies the traditional Corn Belt, including:
Iowa
Illinois
Indiana
Ohio
These states possess extensive flat terrain and some of the world’s most productive agricultural land. The lack of significant topographic barriers allows derecho complexes to accelerate and maintain their structure over hundreds of miles with minimal disruption.
The consequences can be enormous. A single derecho may flatten millions of acres of corn and soybeans within hours, producing severe agricultural losses, disrupting supply chains, damaging grain storage and transportation infrastructure, and generating billions of dollars in economic damages.
2. The Northern Expansion Zone: A Rapidly Growing Risk
As atmospheric warming and persistent summer heat increasingly extend farther north, states that once viewed derechos as rare anomalies are experiencing a growing number of severe events.
Impacted States
Minnesota
Wisconsin
Michigan
South Dakota
Emerging Trends
Strengthening high-pressure systems and expanding zones of atmospheric instability are supporting derecho development farther into the Upper Midwest and Great Lakes regions. Some events are now maintaining sufficient intensity to continue into Canada, affecting:
Ontario
Saskatchewan
Manitoba
This northward expansion represents one of the clearest examples of shifting severe weather boundaries in a warming climate.
3. The Mid-Atlantic and Northeast: High Infrastructure Vulnerability
Although derechos occur less frequently in the eastern United States than in the Plains and Midwest, their societal and economic impacts are often disproportionately large.
Impacted States
Pennsylvania
Maryland
West Virginia
New Jersey
Washington, D.C.
Emerging Trends
Historically, the Appalachian Mountains often weakened convective systems moving eastward. However, recent events suggest that increasingly energetic storm complexes are better able to maintain their structural integrity while crossing the mountains.
As a result, damaging straight-line winds are increasingly reaching densely populated metropolitan corridors of the Mid-Atlantic and Northeast.
The consequences include:
Large-scale electrical grid failures
Widespread tree damage
Transportation disruptions
Telecommunications outages
Extensive residential and commercial property losses
Because much of the region’s electrical and transportation infrastructure is decades old and designed for historical wind conditions, vulnerability to major derecho events remains exceptionally high.
4. The Southern Plains and Gulf Coast: The Cool-Season Threat
Approximately 70 percent of all derechos occur during the warm season between May and August. However, a secondary corridor remains active during autumn and winter.
Impacted States
Eastern Texas
Louisiana
Mississippi
Alabama
Emerging Trends
The Gulf of Mexico is supplying increasingly warm and moisture-rich air masses later into the year. These conditions can create highly unstable environments even during winter months, supporting the development of fast-moving cool-season derechos.
Because communities generally associate severe convective storms with spring and summer, winter derechos often arrive with lower public awareness and preparedness, increasing the potential for widespread impacts.
A Global Phenomenon
Although North America experiences some of the world’s most powerful and well-documented derechos, these storms are not unique to the United States. Derecho-like convective systems occur on nearly every continent and are increasingly being recognized in:
Central Europe
Eastern Asia
The subtropical plains of South America
As the global atmosphere continues to warm and store more moisture and energy, researchers are increasingly investigating whether the environmental conditions that support long-lived convective windstorms are becoming more common in regions that historically experienced them only rarely.
The expanding geographic footprint of derechos underscores a central lesson of climate science: severe weather hazards are not remaining stationary. As atmospheric energy increases, the boundaries of extreme events are shifting, exposing new populations, infrastructure, and economic systems to risks that were once considered geographically improbable.
Insurance Industry Responses
Global insured losses from severe convective storms are increasing at an estimated average annual rate of approximately 9%, substantially exceeding the growth rate of losses from other natural catastrophes.
In response, insurers are rapidly restructuring coverage across many regions of the United States.
Traditional policies that once contained flat-dollar wind deductibles are increasingly being replaced by percentage-based wind and hail deductibles ranging from 1% to 5% of a home’s insured value. These changes shift thousands of dollars of immediate disaster costs directly onto homeowners and businesses.
The insurance industry increasingly recognizes straight-line wind events not as isolated weather anomalies but as an emerging systemic risk requiring substantial adjustments in underwriting practices, pricing models, and catastrophe exposure management.
Conclusion: More Energy in the Atmosphere Means More Extreme Winds
Straight-line winds demonstrate a fundamental principle of climate physics: a warmer world is a more energetic world.
As greenhouse gases trap additional heat, the atmosphere stores more moisture and potential energy, creating increasingly favorable conditions for severe convective storms. The result is an environment capable of producing stronger downbursts, more frequent severe thunderstorms, and larger, longer-lived derecho systems.
Climate change does not cause any individual straight-line wind event in isolation. However, it is increasingly altering the environmental ingredients that govern these storms by increasing atmospheric moisture, elevating instability, and supporting more persistent convective systems.
The consequences extend well beyond meteorology. Straight-line winds are becoming a growing challenge for public safety, infrastructure resilience, electrical grid reliability, insurance markets, and building design standards. As the climate system continues to warm, understanding and preparing for these increasingly energetic wind events will become essential for protecting communities and reducing future economic losses.
What are the climate risks where you live?
Many people are surprised to learn that their greatest weather-related risk is often wind damage. Wind and hail damage are among the most common homeowners insurance claims in the United States, accounting for roughly 40% of all property damage claims.
Standard homeowners policies from major insurers generally cover wind damage under dwelling and personal property coverage. These claims can include repairs for roof and shingle damage, siding damage, structural failures, and damage caused by wind-driven debris such as fallen trees.
However, homeowners in high-risk areas—such as coastal regions and “Tornado Alley”—may face separate windstorm deductibles. Unlike a standard fixed deductible (for example, $1,000), these deductibles are often calculated as a percentage of the home’s insured value, typically ranging from 1% to 5%.
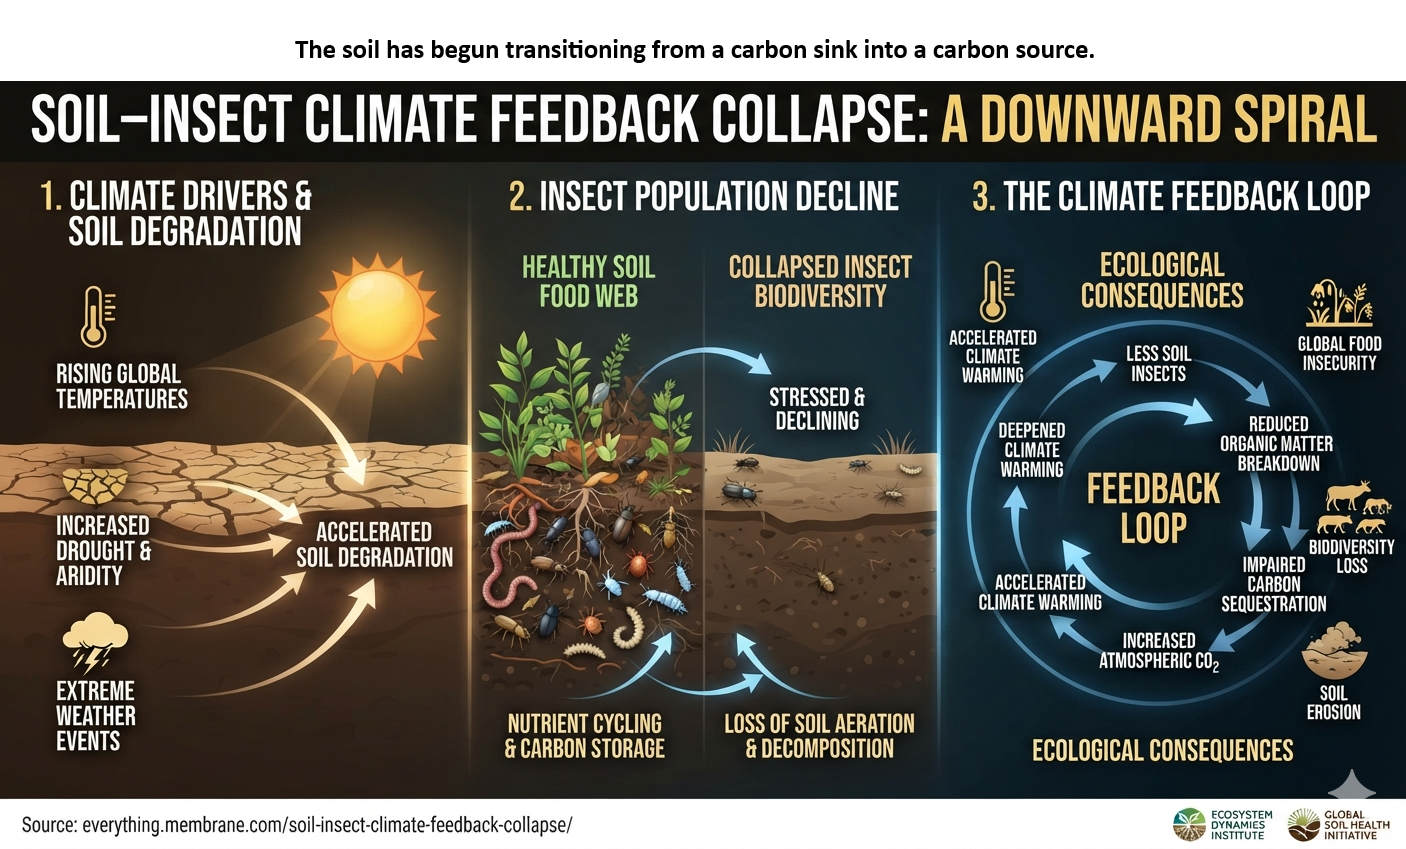
The soil has begun transitioning from a carbon sink into a carbon source.
by Daniel Brouse
Soil–Insect Climate Feedback Collapse: How Climate Change Is Triggering a Downward Spiral in Earth’s Hidden Ecosystems
Introduction: The Collapse Beneath Our Feet
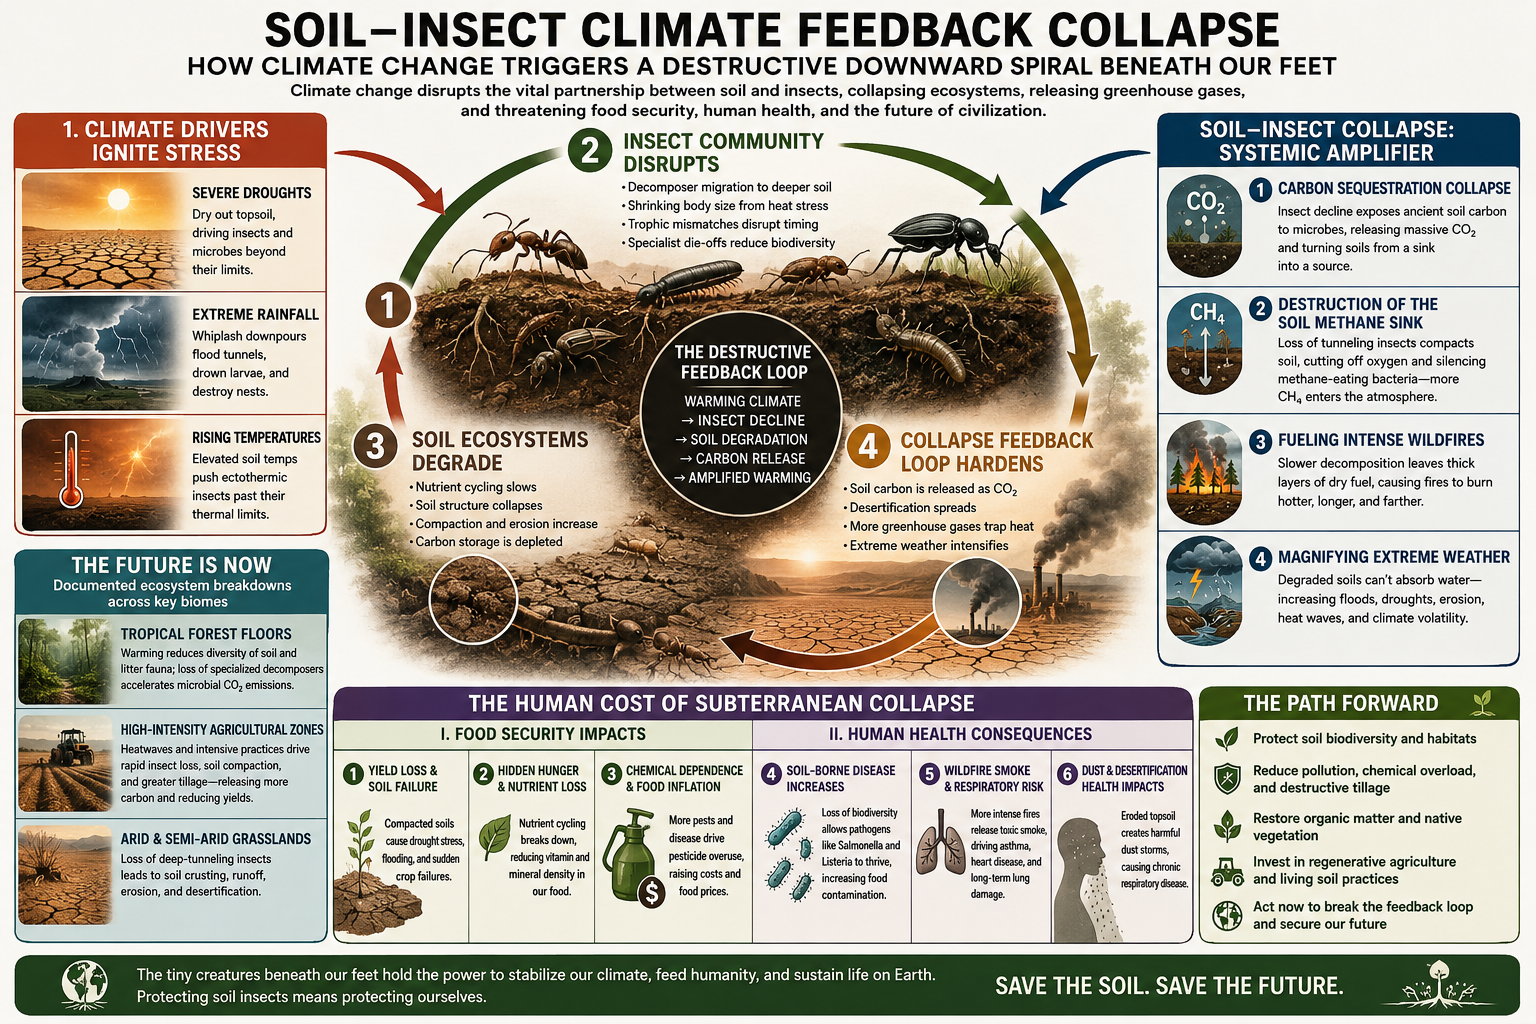
Climate change is not only transforming the atmosphere, oceans, and visible landscapes of Earth; it is also disrupting one of the planet’s most important hidden systems—the living soil ecosystem beneath our feet. Soil and insects exist in a highly interconnected relationship where insects regulate decomposition, nutrient cycling, carbon storage, water movement, and the physical structure of the ground itself.
As global temperatures rise and extreme weather becomes more intense, this relationship is being pushed beyond its natural limits. Soil insects, particularly ectothermic organisms whose body temperatures are controlled by their environment, are highly vulnerable to rising temperatures, drought, flooding, and ecological instability. At the same time, soil itself becomes increasingly degraded as biological processes that maintain its structure and fertility begin to fail.
The collapse of soil-insect systems represents more than a biodiversity crisis. It is a systemic disruption of one of Earth’s largest carbon reservoirs and one of humanity’s most important life-support systems. As subterranean ecosystems deteriorate, the consequences extend upward into agriculture, wildfire behavior, atmospheric processes, food security, and human health.
1. Climate Drivers Ignite Soil-Insect Stress
Climate change acts as the primary trigger for the collapse of the soil-insect system. Rising temperatures, changing precipitation patterns, drought, and extreme rainfall events place intense pressure on organisms that have evolved within relatively stable environmental conditions.
Severe Drought and Soil Drying
Increasing drought conditions dry out the upper layers of soil, eliminating critical habitat for many soil organisms. Moisture-dependent insects and other decomposers experience increased mortality as soils become too dry to support biological activity.
Dry soils also:
Reduce microbial activity.
Increase compaction.
Limit decomposition.
Reduce nutrient availability.
As moisture disappears, many soil insects are forced deeper underground to escape unfavorable surface conditions, leaving the upper soil layers biologically depleted.
Extreme Rainfall and Flooding
Climate change is also increasing the frequency of intense rainfall events. These sudden floods disrupt underground ecosystems by:
Flooding insect tunnels.
Destroying underground nesting structures.
Drowning eggs and larvae.
Removing surface organic material.
The increasing combination of drought and extreme rainfall creates a climate “whiplash” effect, forcing soil organisms to survive rapidly shifting and increasingly hostile environments.
Rising Soil Temperatures
Elevated soil temperatures place ectothermic organisms under direct physiological stress. Because insects rely on environmental temperatures to regulate metabolism, warming can push them beyond their thermal limits.
The consequences include:
Reduced survival.
Disrupted reproduction.
Altered development cycles.
Increased ecological instability.
The result is a progressive breakdown of the underground biological network that supports healthy soils.
2. The Soil Insect Community Disrupts
As climate pressures intensify, soil insect communities begin experiencing widespread ecological disruption. The impacts are not limited to population decline but include changes in behavior, body size, timing, and species composition.
Decomposer Migration
Macrofauna such as ants, beetles, termites, and other large decomposers are essential for processing organic matter and maintaining soil structure.
Under increasing heat and drought stress:
These organisms migrate deeper into the soil.
Surface decomposition declines.
Organic matter remains exposed rather than being incorporated into deeper layers.
The loss of surface-level decomposer activity weakens the entire soil food web.
Shrinking Body Size
Rising temperatures accelerate insect development rates. However, faster growth often results in smaller adult insects.
This reduction in body size decreases:
Physical efficiency.
Reproductive capacity.
Ecosystem function.
Smaller insects are less capable of performing critical roles such as decomposition, soil mixing, and nutrient movement.
Trophic Mismatches
Climate disruption alters the timing relationships between organisms.
Examples include:
Insect emergence occurring before food resources become available.
Reduced synchronization between decomposers and plant litter cycles.
Disruption of predator-prey relationships.
These mismatches weaken ecosystem stability and reduce the ability of soil communities to adapt.
Specialist Die-Offs
Specialized soil insects are among the most vulnerable organisms during rapid environmental change.
Localized extinctions of sensitive species result in:
Reduced biodiversity.
Loss of ecological functions.
Increased dominance of heat-tolerant generalist species.
As biodiversity declines, the soil ecosystem becomes less resilient and more vulnerable to additional climate stress.
3. Soil Ecosystems Degrade
The decline of soil insect communities causes cascading failures throughout the underground ecosystem. Without healthy insect populations, soils lose many of the biological processes required to maintain fertility, structure, and climate regulation.
Halted Nutrient Cycling
Soil insects are fundamental to the breakdown of organic material.
Without macrofauna:
Plant litter decomposition slows.
Nutrients remain trapped in undecomposed material.
Soil fertility declines.
The biological recycling system that sustains terrestrial ecosystems begins to fail.
Structural Collapse
Burrowing insects act as ecosystem engineers by creating tunnels and channels throughout the soil.
These structures provide:
Soil aeration.
Water infiltration pathways.
Root access.
Microbial habitat.
As tunneling organisms disappear:
Soil becomes compacted.
Water absorption decreases.
Surface erosion increases.
The soil loses its ability to function as a living, dynamic system.
Carbon Depletion
Healthy soils represent one of Earth’s largest carbon reservoirs. Soil insects help protect carbon by shredding organic matter and mixing it into deeper layers where it can become stabilized.
When insect communities collapse:
Organic carbon becomes exposed.
Microbial decomposition accelerates.
Carbon storage capacity declines.
The soil has begun transitioning from a carbon sink into a carbon source.
4. The Collapse Feedback Loop Hardens
Once soil degradation begins, the damage feeds back into the climate system, accelerating the original disruption. The loss of soil insects transforms a biological decline into a broader Earth-system feedback mechanism.
Greenhouse Gas Release
As soil structures fail and organic matter becomes exposed, large quantities of stored soil carbon are released into the atmosphere.
Healthy soils function as long-term carbon storage systems by protecting organic matter within complex soil structures. When insect activity declines:
Soil aggregates break down.
Previously protected carbon becomes accessible to microbes.
Decomposition accelerates.
Carbon dioxide emissions increase.
As more carbon enters the atmosphere, additional warming occurs, intensifying the environmental pressures already affecting soil organisms.
Desertification
The combined loss of soil biodiversity and soil structure can transform productive ecosystems into degraded landscapes.
Without healthy insect communities:
Soil loses its ability to retain moisture.
Vegetation declines.
Organic matter inputs decrease.
Erosion accelerates.
The landscape gradually loses its capacity to support biological productivity, creating conditions favorable for permanent desertification.
Amplified Warming
The release of additional greenhouse gases creates a reinforcing climate feedback.
The original disturbance is therefore amplified through the collapse of a critical biological system.
The Future Is Now: Evidence of Active Soil-Insect Collapse
This destructive feedback loop is no longer only a theoretical projection. It is actively documented across multiple ecosystems worldwide. Field experiments, long-term ecological monitoring, and regional surveys reveal visible breakdowns where insect declines directly affect soil stability, carbon cycling, and ecosystem function.
1. Tropical Forest Floors
Tropical ecosystems contain some of the most biologically diverse soil communities on Earth. However, tropical insects often live close to their maximum thermal tolerance, making them particularly vulnerable to even modest increases in temperature.
The Evidence
Controlled whole-profile soil warming experiments in tropical forests have demonstrated:
Significant reductions in soil and leaf-litter fauna diversity.
Declines in soil organism richness.
Greater vulnerability during dry-season warming.
The Feedback
As specialized macro-decomposers such as larger beetles and millipedes decline:
They are replaced by fewer heat-tolerant and aggressive microarthropod species.
Soil food-web complexity decreases.
Microbial activity becomes less regulated.
Without a diverse insect community controlling microbial processes, microbes can accelerate the breakdown of organic matter, increasing carbon dioxide emissions from tropical soils.
2. High-Intensity Agricultural Zones
Agricultural ecosystems are experiencing a compounding crisis as climate stress combines with intensive land management practices.
Major pressures include:
Synthetic chemical use.
Heavy tillage.
Monoculture farming.
Increasing heat extremes.
The Evidence
Long-term ecological monitoring indicates that heavily managed agricultural regions experience accelerating declines in insect abundance and species richness as climate pressures increase.
The Feedback
When croplands experience extreme heat:
Native soil insects decline.
Natural soil aeration decreases.
Soil compaction increases.
Water retention capacity declines.
As biological soil engineers disappear, farmers increasingly rely on mechanical intervention to break apart hardened soils.
However, increased tillage:
Destroys remaining underground habitats.
Accelerates organic carbon exposure.
Increases agricultural greenhouse gas emissions.
This creates a reinforcing cycle:
Climate stress → soil insect loss → soil degradation → increased tillage → further soil ecosystem destruction
3. Arid and Semi-Arid Grasslands
Dryland ecosystems depend heavily on ecosystem-engineering insects such as ants and termites. These organisms regulate water movement, nutrient distribution, and soil structure in some of the planet’s most water-limited environments.
The Evidence
Increasing temperatures and prolonged drought have altered grassland soil communities, causing significant declines in moisture-sensitive soil organisms.
Deep-dwelling insects are increasingly affected as underground moisture disappears.
The Feedback
Without deep-tunneling insects:
Soil loses internal pathways for water movement.
Surface crusts form.
Rainfall infiltration declines.
Vegetation recovery becomes more difficult.
When intense rainfall events occur, degraded soils cannot absorb water effectively.
Instead:
Water runs across the surface.
Severe erosion occurs.
Topsoil is removed.
Plant communities collapse.
The loss of vegetation further reduces organic matter inputs, reinforcing the decline of soil insects and accelerating desertification.
Soil-Insect Collapse as a Systemic Climate Amplifier
The soil-insect collapse feedback does not occur independently. It connects directly with major Earth-system processes involving carbon storage, methane regulation, wildfire intensity, and extreme weather.
The destruction of subterranean biodiversity transforms a microscopic ecological disruption into a planetary-scale climate amplifier.
1. Collapse of Carbon Sequestration
Soils contain roughly three times more carbon than terrestrial vegetation. Soil insects function as biological gatekeepers that determine how carbon is processed and stored.
Disruption
Healthy soils depend on insects to:
Break down organic material.
Mix plant debris into deeper layers.
Create conditions where carbon binds with minerals.
Build stable soil aggregates.
Global environmental changes reduce the feeding and burrowing activity of soil detritivores, weakening this carbon protection system.
The Feedback
Without insects physically incorporating and protecting carbon:
Organic matter becomes exposed.
Oxygen reaches stored carbon.
Microbial decomposition accelerates.
Long-term warming experiments show that stressed soils can begin consuming persistent, centuries-old organic matter, releasing additional carbon dioxide into the atmosphere.
This converts soils from climate stabilizers into climate amplifiers.
2. Destruction of the Soil Methane Sink
Upland soils represent a major global methane sink because they contain methane-consuming microorganisms called methanotrophs.
Disruption
Methanotroph activity depends on proper soil gas exchange.
This balance is maintained by:
Soil structure.
Oxygen movement.
Insect-created tunnels and macropores.
When heat and drought drive tunneling insects away:
Soil compacts.
Underground airflow decreases.
Methane-consuming microbial communities become impaired.
The Feedback
As the methane sink weakens:
Less methane is removed from the atmosphere.
More CH₄ accumulates.
Atmospheric warming increases.
The soil shifts from actively filtering methane toward becoming a weaker climate-regulating system.
3. Fueling More Intense Wildfires
The collapse of soil decomposer communities fundamentally changes the physical characteristics of forests, grasslands, and other terrestrial ecosystems. When insects responsible for breaking down organic material decline, landscapes accumulate larger quantities of dry, undecomposed biomass.
Disruption
Healthy populations of millipedes, woodlice, beetles, and other macro-insects rapidly process fallen leaves, dead plant material, and organic debris.
When these decomposers decline:
Leaf litter decomposition slows.
Dead vegetation accumulates on the surface.
Organic material remains exposed to drying conditions.
Forest floors and grasslands become increasingly fuel-loaded.
The result is the transformation of biologically active landscapes into increasingly combustible environments.
The Feedback
When climate-driven wildfires ignite these ecosystems:
Fires spread more rapidly.
Burning temperatures increase.
Larger areas are consumed.
More carbon is released into the atmosphere.
Intense fires also damage the remaining plant-soil-microbe relationships that allow ecosystems to recover.
Healthy soils and their insect communities function as a natural climate buffer. Soil organisms help regulate water movement, maintain moisture storage, and reduce the severity of environmental extremes.
When this biological infrastructure collapses, landscapes lose their ability to absorb climate shocks.
Disruption
Without insect-driven bioturbation—the natural mixing and restructuring of soil—the upper layers of soil become increasingly compacted and degraded.
The consequences include:
Reduced soil porosity.
Lower water infiltration.
Increased surface crust formation.
Reduced moisture retention.
The soil becomes hardened and less capable of functioning as a living water-management system.
The Feedback
When extreme rainfall events occur:
Water cannot penetrate degraded soils.
Surface runoff increases.
Flash flooding intensifies.
Mudslides and erosion become more severe.
Topsoil is lost.
The landscape loses its ability to store water, increasing drought stress after storms and creating conditions that intensify future heat waves.
The cycle becomes:
Soil degradation → reduced water storage → stronger drought impacts → greater heat stress → further ecosystem decline
The Human Cost of Subterranean Collapse
The effects of soil-insect collapse extend directly into human systems. Because human civilization depends on productive soils for agriculture, the degradation of underground ecosystems represents a direct threat to food security, economic stability, and public health.
Humans depend on healthy soils for approximately 95% of the food consumed globally. As soil biological systems decline, the consequences move from ecological disruption into human survival systems.
I. Food Security Impacts
1. Declining Crop Yields and Structural Soil Failure
As temperatures rise and insect communities decline, agricultural soils lose critical biological functions.
The Mechanism
When fields lose tunneling macrofauna:
Soil becomes compacted.
Water infiltration decreases.
Plant-accessible water storage declines.
During drought:
Crops experience water stress more rapidly.
Roots cannot access deeper moisture reserves.
During extreme rainfall:
Hardened soils prevent water absorption.
Fields experience increased flooding.
Crops become vulnerable to sudden failure.
The same degraded soil becomes vulnerable to both drought and flooding, creating increasingly unstable agricultural conditions.
2. Hidden Hunger and Nutrient Decline
Food production depends not only on crop quantity but also on nutritional quality.
The relationship between insects, microbes, and plants maintains the movement of essential nutrients through ecosystems.
The Mechanism
Soil insects:
Break down organic material.
Create smaller biological fragments.
Support microbial conversion of nutrients into plant-available forms.
These processes influence the availability of minerals such as:
Crops grown in degraded soils may experience reduced nutrient density, increasing the risk of “hidden hunger”—micronutrient deficiencies that impair human development and immune function.
3. Increasing Chemical Dependence and Food Inflation
As native insect diversity collapses, agricultural ecosystems become increasingly vulnerable to pests and disease.
The Mechanism
The loss of beneficial insects removes important ecological controls over:
Crop pests.
Soil pathogens.
Root-damaging organisms.
To maintain production:
Farmers increase pesticide use.
Synthetic inputs become more necessary.
Production costs rise.
The Impact
Greater chemical dependence contributes to:
Higher agricultural expenses.
Increased food prices.
Greater chemical runoff into freshwater systems.
Additional stress on vulnerable communities.
The agricultural system becomes trapped in a cycle of ecological decline and increasing dependence on external inputs.
II. Human Health Consequences
4. Increased Soil-Borne Disease and Opportunistic Pathogens
A diverse soil ecosystem acts as a biological defense system by limiting the expansion of opportunistic pathogens.
The Mechanism
High biodiversity helps suppress harmful organisms, including pathogens such as:
Salmonella enterica
Listeria monocytogenes
When soil biodiversity declines:
Ecological competition decreases.
Opportunistic organisms gain advantages.
Agricultural contamination risks increase.
The Impact
As soil ecosystems become increasingly disrupted:
Food safety risks rise.
Fresh produce contamination becomes more difficult to control.
Human exposure to soil-associated pathogens may increase.
5. Respiratory Disease and Toxic Wildfire Smoke
The soil-insect feedback loop connects directly to human respiratory health through increased wildfire intensity.
The Mechanism
When insect decomposers decline:
Dead vegetation accumulates.
Forest and grassland surfaces become fuel-loaded.
Fires burn with greater intensity.
These severe fires release:
Fine particulate matter (PM2.5).
Carbon compounds.
Volatile organic compounds.
The Impact
Smoke exposure can contribute to:
Increased asthma attacks.
Cardiovascular stress.
Respiratory illness.
Long-term health consequences.
As wildfire seasons intensify, the loss of soil biodiversity becomes connected to increasingly widespread air-quality threats.
6. Chronic Dust Exposure and Desertification Health Impacts
The final stage of soil collapse occurs when degraded landscapes lose their ability to maintain stable vegetation and soil structure.
The Mechanism
When insect populations decline:
Soil loses biological cohesion.
Root systems weaken.
Topsoil becomes vulnerable to erosion.
Wind can then transport large quantities of fine soil particles across broad regions.
The Impact
Chronic exposure to dust can increase risks of:
Respiratory irritation.
Chronic lung disease.
Silica-related health problems.
Reduced air quality across downwind communities.
The degradation of soil ecosystems therefore creates direct human health consequences far beyond the original affected landscape.
End Synthesis: The Soil-Insect Connection as a Climate Feedback System
The soil-insect relationship represents one of Earth’s most important biological feedback systems. Although insects are small organisms, their collective influence extends across planetary-scale processes involving carbon storage, water regulation, atmospheric chemistry, agriculture, and human health.
Climate change destabilizes this relationship by pushing soil organisms beyond their ecological limits. As insect communities decline, soils lose their ability to function as living ecosystems. Nutrient cycling slows, carbon storage weakens, water regulation declines, and landscapes become increasingly vulnerable to drought, flooding, wildfire, and erosion.
The resulting feedback loop transforms a biological disruption into a climate amplifier:
A warming climate damages insects. Declining insects damage soils. Damaged soils release carbon and lose resilience. Carbon release and ecosystem degradation accelerate climate instability.
The collapse occurring beneath the surface is therefore not separate from global climate change—it is part of the same interconnected Earth-system response.
Protecting soil biodiversity is not only an effort to preserve insects. It is an essential component of protecting carbon storage, food production, ecosystem stability, and human civilization itself.
The future of climate stability depends not only on what happens in the atmosphere above us, but also on whether the living world beneath our feet continues to function.
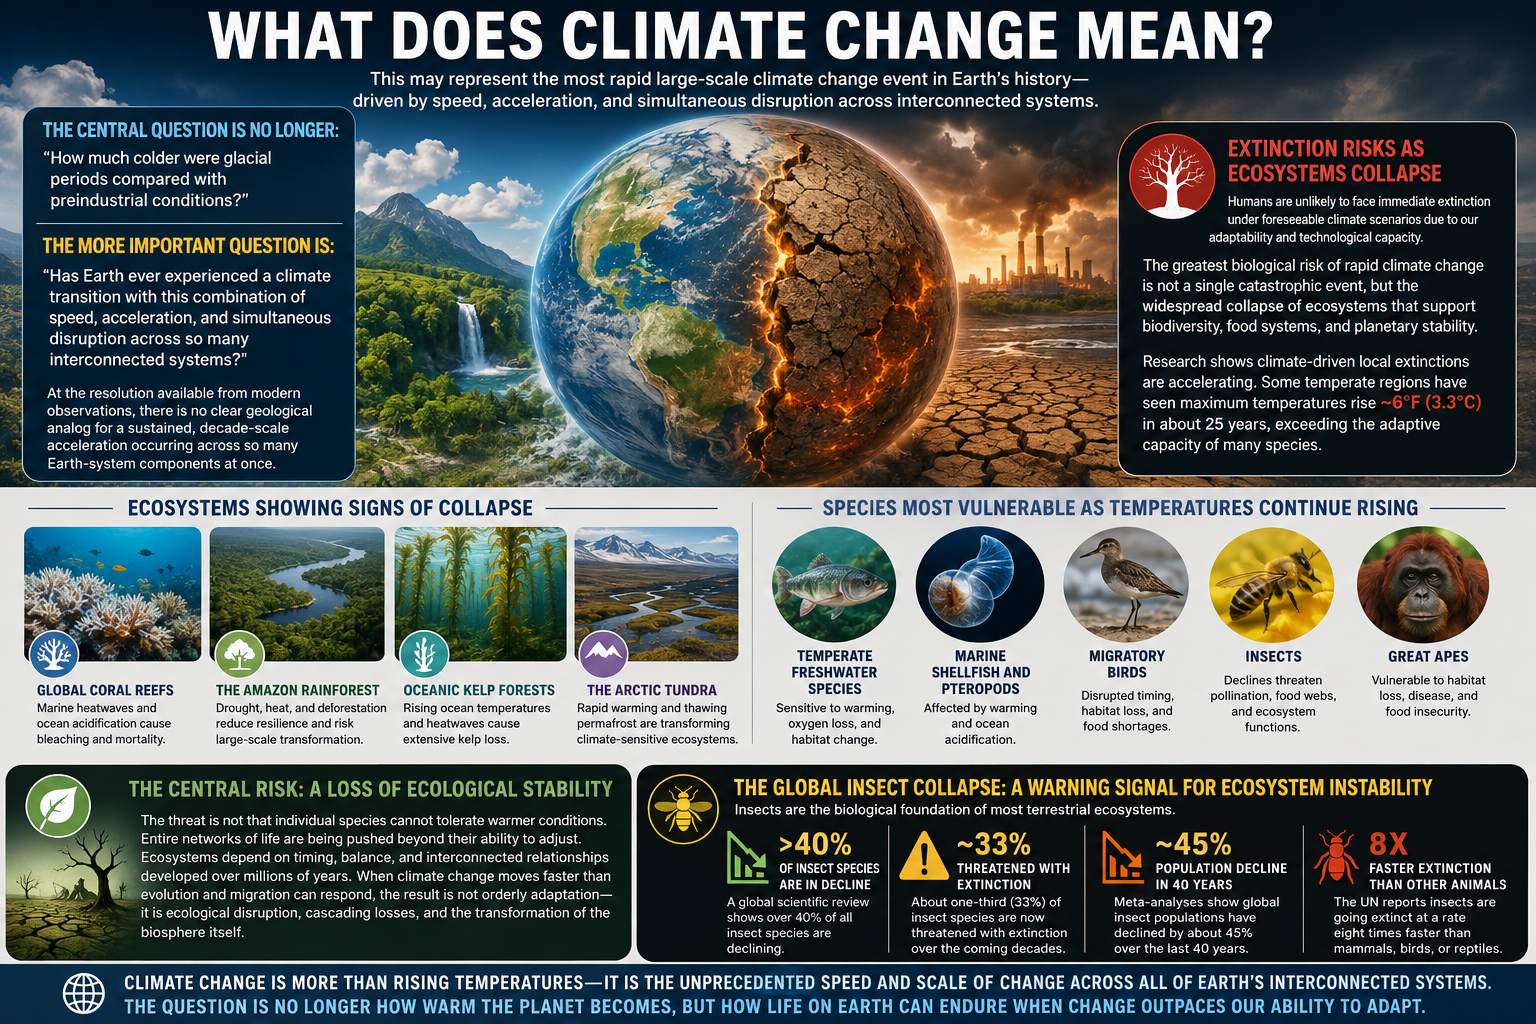
Q:“Has Earth ever experienced a climate change with this combination of speed, acceleration, and simultaneous disruption across Earth?”
There is no comparison in the geological record. The present is revealing a system changing at a rate that may be outside the range experienced throughout human civilization and perhaps for millions of years.
Q: “What Are the Immediate Impacts?
A: More extreme weather.
Severe weather is becoming more frequent, more intense, and more persistent, with extreme events lasting longer and affecting larger areas.
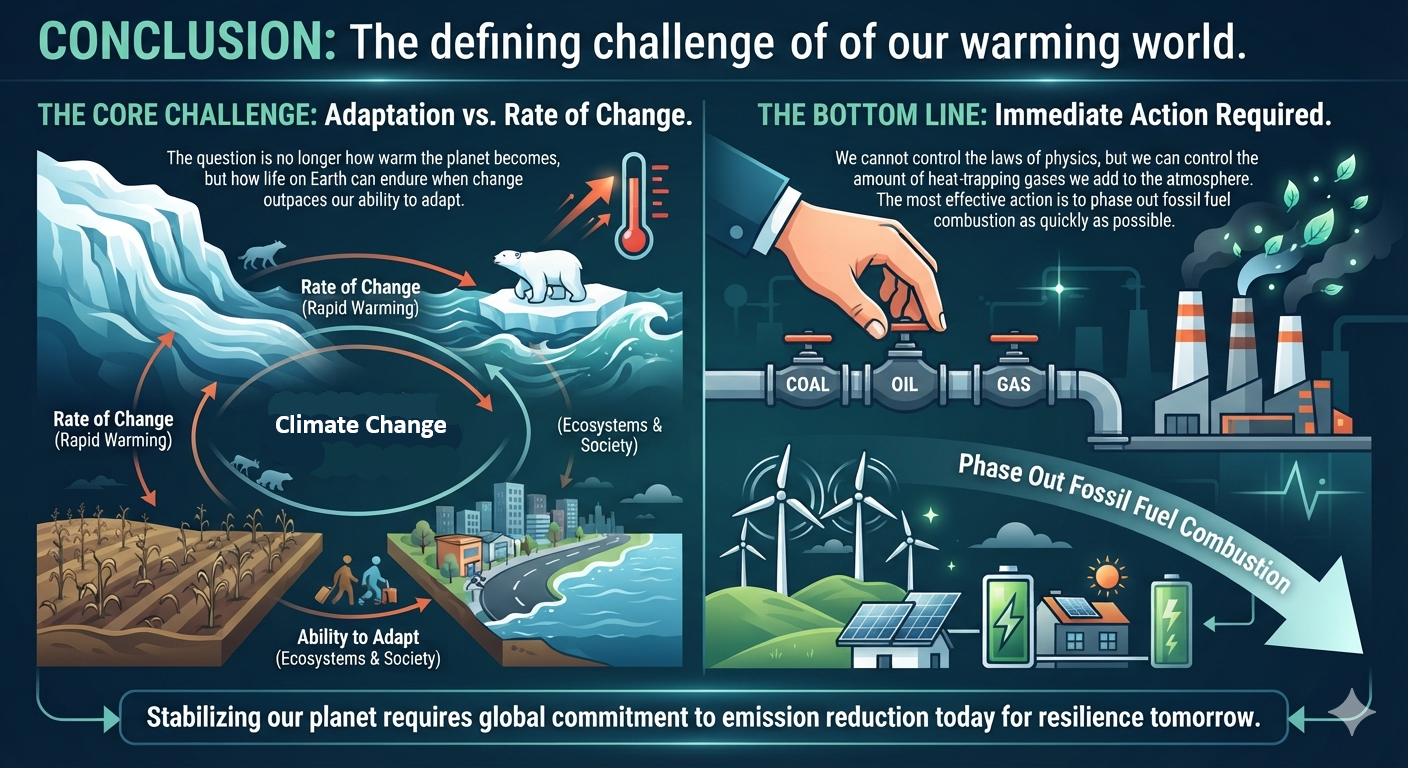
Bottom line: We cannot control the laws of physics, but we can control the amount of heat-trapping gases we add to the atmosphere. The most effective action is to phase out fossil fuel combustion as quickly as possible.
Q: What Causes Climate Change?
A: Human activities.
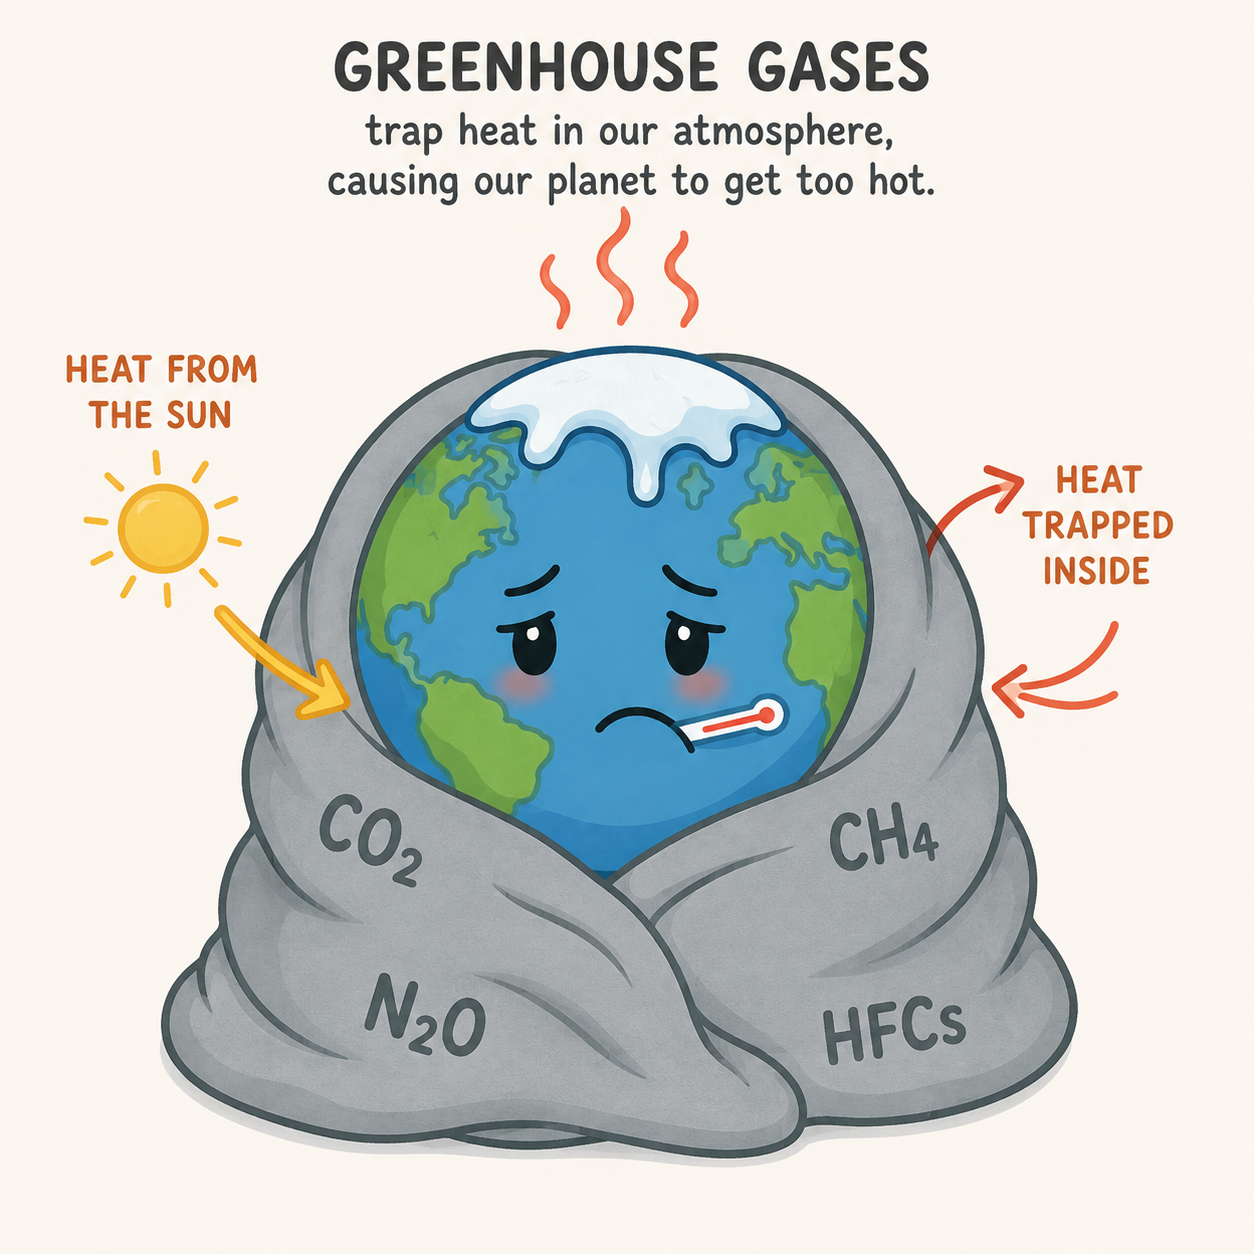
The primary driver of modern global warming is the increase in greenhouse gases released through human activities, especially the burning of fossil fuels. Carbon dioxide (CO2) and other greenhouse gases act like an insulating layer in the atmosphere, absorbing and re-emitting infrared radiation. This slows the loss of heat from Earth to space, creating an energy imbalance that causes the planet to warm.
Q: What Is Climate Change?
A: Climate change is energy transfer.
The phrase “global warming” is often misunderstood. While it correctly describes rising average temperatures, it does not tell the whole story. The real issue is the rapid buildup and movement of extra heat energy throughout Earth’s climate system.
Global warming is the beginning of climate change—not the end of it.
When greenhouse gases trap additional heat, that energy does not simply make the air warmer. It is continually transformed into other forms of energy, including:
Kinetic energy: Stronger winds and more powerful storms.
Gravitational potential energy: Greater vertical motion in the atmosphere and heavier rainfall.
Latent heat: More energy available to fuel hurricanes and atmospheric rivers.
Radiant energy: Increased trapping of infrared heat that amplifies warming.
Chemical energy: Wildfires and other processes that release additional greenhouse gases.
Electrical energy: More lightning in highly energetic thunderstorms.
More than 90% of this excess heat is absorbed by the oceans, not the atmosphere. The oceans act like a giant heat reservoir, storing energy and releasing it slowly over time. Because of this thermal inertia, the climate can continue changing even if emissions begin to decline.
By 2025, global temperatures had exceeded the long-recognized 1.5°C (2.7°F) warming threshold. To many people, an increase of 1.5°C may sound small. In Earth’s climate system, it is not.
Small increases in average temperature can produce much larger changes in temperature differences, air pressure, and atmospheric moisture. These changes alter weather patterns, intensify storms, increase heavy rainfall, and make many extreme events more severe.
What we are witnessing are not simply isolated weather events. They are increasingly extreme energy events occurring within an interconnected Earth system.
To understand climate change, it helps to think not only in terms of degrees of warming, but also in terms of joules of energy and how that energy moves through the atmosphere, oceans, ice, and living ecosystems.
Q: How Fast Is the Climate Changing?
A: The climate appears to be changing at an exceptionally rapid pace—faster than at any time in human history and possibly faster than at any time in the past several million years.
Many past climate transitions unfolded over centuries, thousands of years, or longer. The modern climate system is experiencing simultaneous changes across the atmosphere, oceans, cryosphere, and biosphere over time scales measured in decades.
Climate change is often measured in degrees, but degrees alone cannot describe the full magnitude of the transformation now underway. The defining feature of the modern climate system is not simply that Earth is warmer than it was in the past, but that multiple components of the Earth system are changing simultaneously at rates that challenge the ability of natural systems, ecosystems, and human societies to adapt.
Historical climate records remain essential for understanding how the planet responds to changes in energy balance. However, the current climate trajectory represents a fundamentally different challenge: a rapidly accelerating transition occurring across the atmosphere, oceans, cryosphere, and biosphere within decades rather than centuries or millennia. The question is no longer only how much the climate has changed, but how quickly the rate of change itself is increasing and how those changes interact through a highly connected planetary system.
The past reveals what climate systems can do.
The present is revealing a system changing at a rate that may be outside the range experienced throughout human civilization and perhaps for millions of years.
Beyond Temperature: What Climate Change Really Means
Climate change is often framed around a simple comparison:
How much colder were ice ages than the climate before the Industrial Revolution?
While historical temperature comparisons remain scientifically important, they no longer capture the most significant feature of modern climate change.
The more important question today is:
Has Earth ever experienced a climate transition with this combination of speed, acceleration, and simultaneous disruption across so many interconnected systems?
Based on modern observations, there is no clear geological example of a sustained, decade-scale acceleration occurring simultaneously across numerous components of the Earth system. Rising temperatures are occurring alongside accelerating changes in oceans, ice sheets, ecosystems, atmospheric moisture, and extreme weather patterns. It is this convergence of rapid changes—not temperature alone—that defines the modern climate era. This may represent the most rapid large-scale climate change event in Earth’s history, based on the rate and simultaneous disruption now being observed across multiple interconnected Earth systems.
The Growing Risk of Ecosystem Collapse
Humans are unlikely to face immediate extinction under foreseeable climate scenarios. Our species possesses technological capabilities, global communication networks, and a remarkable ability to adapt to changing conditions.
Many other species, however, do not have those advantages.
The greatest biological danger posed by rapid climate change is not a single catastrophic event. It is the gradual breakdown of ecosystems that support biodiversity, food production, and the stability of the biosphere itself.
Research increasingly shows that climate-driven local extinctions are accelerating. Some temperate regions have experienced unexpectedly high biodiversity losses associated with rapidly increasing temperature extremes. In certain areas, maximum temperatures have risen by approximately 6°F (3.3°C) in only about 25 years, creating environmental conditions that exceed the ability of many species to adapt or migrate.
Ecosystems Already Showing Signs of Stress
Several major ecosystems are exhibiting characteristics consistent with ecological disruption and increasing instability:
Global Coral Reefs: Marine heatwaves and ocean acidification are causing repeated mass bleaching events and widespread mortality.
The Amazon Rainforest: Increasing drought, heat, and deforestation are reducing resilience and raising concerns about large-scale ecosystem transformation.
Oceanic Kelp Forests: Rising ocean temperatures and marine heatwaves are causing extensive losses of kelp ecosystems that support diverse marine life.
The Arctic Tundra: Rapid warming, thawing permafrost, and shifting vegetation are fundamentally altering one of Earth’s most climate-sensitive regions.
Species Most Vulnerable to Continued Warming
Some groups of organisms appear particularly vulnerable because they occupy narrow ecological niches or depend on highly synchronized environmental conditions.
Among the most at-risk are:
Temperate freshwater species
Marine shellfish and pteropods
Migratory birds
Insects
Great apes
The loss of these organisms can have consequences far beyond individual extinctions because each species is connected to larger ecological networks.
The Real Threat: Losing Ecological Stability
The defining danger of rapid climate change is not simply that individual species cannot survive warmer temperatures.
The larger threat is that entire networks of life are being pushed beyond their capacity to adjust.
Ecosystems depend on timing, balance, and intricate relationships that evolved over millions of years. Plants flower at specific times to coincide with pollinators. Predators and prey maintain dynamic balances. Migratory species depend on seasonal cues that have remained relatively stable throughout human history.
When climate change occurs faster than evolution, migration, and adaptation can respond, ecosystems do not smoothly transition to new conditions. Instead, they experience disruption, cascading losses, and fundamental reorganization.
The result is not merely a warmer planet. It is the transformation of the biosphere itself.
The Global Insect Collapse: An Early Warning Signal
One of the clearest indicators of accelerating ecological disruption is the worldwide decline of insect populations.
Insects form the biological foundation of most terrestrial ecosystems. They pollinate crops and wild plants, decompose organic material, recycle nutrients, and provide food for countless birds, fish, amphibians, reptiles, and mammals.
Scientific studies paint a concerning picture:
More than 40% of known insect species are experiencing population declines.
Approximately one-third of insect species are considered threatened with extinction over the coming decades.
Long-term analyses suggest that global insect abundance has fallen by roughly 45% over the past 40 years.
The United Nations has reported that insects are disappearing at rates estimated to be eight times faster than mammals, birds, or reptiles.
Because insects support so many ecological processes, their decline serves as an early warning signal of broader ecosystem instability. Reduced pollination, disrupted food webs, and diminished nutrient cycling can trigger cascading effects that extend throughout the biosphere.
Climate Change Is About More Than Degrees
Climate change is often discussed in terms of global average temperature—1°C, 2°C, or 3°C of warming. But the defining characteristic of the modern climate system is not simply how warm the planet becomes.
It is the unprecedented pace of change and the simultaneous disruption occurring across interconnected physical and biological systems.
The central question of climate change is therefore no longer:
“How different is today’s temperature from the past?”
The more consequential question is:
“How do ecosystems and societies respond when multiple Earth systems begin changing faster than they can adapt?”
The answer to that question may determine not only the future of individual species, but the stability of the biosphere upon which human civilization ultimately depends.
Conclusion
The question is no longer how warm the planet becomes, but how life on Earth can endure when change outpaces our ability to adapt.
Bottom line: We cannot control the laws of physics, but we can control the amount of heat-trapping gases we add to the atmosphere. The most effective action is to phase out fossil fuel combustion as quickly as possible.
Feedback Loops → Tipping Points → Acceleration → Domino Effect Feedback loops amplify climate change and can push interconnected Earth systems past critical tipping points. As tipping points are crossed, they can trigger additional feedback loops and destabilize other climate systems. This cascading “Domino Effect” compresses timescales, accelerates change, and increases the risk of rapid, nonlinear climate transformations.
Climate change is often framed around a simple comparison:
How much colder were ice ages than the climate before the Industrial Revolution?
While historical temperature comparisons remain scientifically important, they no longer capture the most significant feature of modern climate change.
The more important question today is:
Has Earth ever experienced a climate transition with this combination of speed, acceleration, and simultaneous disruption across so many interconnected systems?
Based on modern observations, there is no clear geological example of a sustained, decade-scale acceleration occurring simultaneously across numerous components of the Earth system. Rising temperatures are occurring alongside accelerating changes in oceans, ice sheets, ecosystems, atmospheric moisture, and extreme weather patterns. It is this convergence of rapid changes—not temperature alone—that defines the modern climate era. This may represent the most rapid large-scale climate change event in Earth’s history, based on the rate and simultaneous disruption now being observed across multiple interconnected Earth systems.
The Growing Risk of Ecosystem Collapse
Humans are unlikely to face immediate extinction under foreseeable climate scenarios. Our species possesses technological capabilities, global communication networks, and a remarkable ability to adapt to changing conditions.
Many other species, however, do not have those advantages.
The greatest biological danger posed by rapid climate change is not a single catastrophic event. It is the gradual breakdown of ecosystems that support biodiversity, food production, and the stability of the biosphere itself.
Research increasingly shows that climate-driven local extinctions are accelerating. Some temperate regions have experienced unexpectedly high biodiversity losses associated with rapidly increasing temperature extremes. In certain areas, maximum temperatures have risen by approximately 6°F (3.3°C) in only about 25 years, creating environmental conditions that exceed the ability of many species to adapt or migrate.
Ecosystems Already Showing Signs of Stress
Several major ecosystems are exhibiting characteristics consistent with ecological disruption and increasing instability:
Global Coral Reefs: Marine heatwaves and ocean acidification are causing repeated mass bleaching events and widespread mortality.
The Amazon Rainforest: Increasing drought, heat, and deforestation are reducing resilience and raising concerns about large-scale ecosystem transformation.
Oceanic Kelp Forests: Rising ocean temperatures and marine heatwaves are causing extensive losses of kelp ecosystems that support diverse marine life.
The Arctic Tundra: Rapid warming, thawing permafrost, and shifting vegetation are fundamentally altering one of Earth’s most climate-sensitive regions.
Species Most Vulnerable to Continued Warming
Some groups of organisms appear particularly vulnerable because they occupy narrow ecological niches or depend on highly synchronized environmental conditions.
Among the most at-risk are:
Temperate freshwater species
Marine shellfish and pteropods
Migratory birds
Insects
Great apes
The loss of these organisms can have consequences far beyond individual extinctions because each species is connected to larger ecological networks.
The Real Threat: Losing Ecological Stability
The defining danger of rapid climate change is not simply that individual species cannot survive warmer temperatures.
The larger threat is that entire networks of life are being pushed beyond their capacity to adjust.
Ecosystems depend on timing, balance, and intricate relationships that evolved over millions of years. Plants flower at specific times to coincide with pollinators. Predators and prey maintain dynamic balances. Migratory species depend on seasonal cues that have remained relatively stable throughout human history.
When climate change occurs faster than evolution, migration, and adaptation can respond, ecosystems do not smoothly transition to new conditions. Instead, they experience disruption, cascading losses, and fundamental reorganization.
The result is not merely a warmer planet. It is the transformation of the biosphere itself.
The Global Insect Collapse: An Early Warning Signal
One of the clearest indicators of accelerating ecological disruption is the worldwide decline of insect populations.
Insects form the biological foundation of most terrestrial ecosystems. They pollinate crops and wild plants, decompose organic material, recycle nutrients, and provide food for countless birds, fish, amphibians, reptiles, and mammals.
Scientific studies paint a concerning picture:
More than 40% of known insect species are experiencing population declines.
Approximately one-third of insect species are considered threatened with extinction over the coming decades.
Long-term analyses suggest that global insect abundance has fallen by roughly 45% over the past 40 years.
The United Nations has reported that insects are disappearing at rates estimated to be eight times faster than mammals, birds, or reptiles.
Because insects support so many ecological processes, their decline serves as an early warning signal of broader ecosystem instability. Reduced pollination, disrupted food webs, and diminished nutrient cycling can trigger cascading effects that extend throughout the biosphere.
Climate Change Is About More Than Degrees
Climate change is often discussed in terms of global average temperature—1°C, 2°C, or 3°C of warming. But the defining characteristic of the modern climate system is not simply how warm the planet becomes.
It is the unprecedented pace of change and the simultaneous disruption occurring across interconnected physical and biological systems.
The central question of climate change is therefore no longer:
“How different is today’s temperature from the past?”
The more consequential question is:
“How do ecosystems and societies respond when multiple Earth systems begin changing faster than they can adapt?”
The answer to that question may determine not only the future of individual species, but the stability of the biosphere upon which human civilization ultimately depends.
Conclusion
The question is no longer how warm the planet becomes, but how life on Earth can endure when change outpaces our ability to adapt.
Bottom line: We cannot control the laws of physics, but we can control the amount of heat-trapping gases we add to the atmosphere. The most effective action is to phase out fossil fuel combustion as quickly as possible.
Global warming is often communicated through changes in average surface air temperature. While useful, this framing understates the fundamental driver of climate change: the accumulation and redistribution of excess thermal energy throughout the Earth system. Because more than 90% of anthropogenic excess heat is stored in the oceans, surface temperature alone provides only a partial representation of the climate system’s changing energy balance. We argue that conceptual illustrations of climate change should therefore be interpreted as probability distributions of total climate-system energy rather than simple temperature distributions. As Earth’s energy imbalance increases, the statistical distribution of climate outcomes evolves beyond a simple rightward shift. The distribution becomes increasingly skewed, with a broader and heavier upper tail corresponding to more frequent, more intense, and longer-duration extreme events. Simultaneously, individual hazards increasingly interact through nonlinear feedback coupling, producing compound and cascading extremes. These changes reflect the redistribution of excess thermal energy through atmospheric and oceanic processes rather than isolated changes in weather. Understanding climate change as an evolving probability distribution governed by Earth’s energy imbalance provides a more comprehensive framework for interpreting modern climate extremes.
1. Introduction
Climate change is frequently illustrated using a bell-shaped probability distribution in which warming shifts the distribution toward higher temperatures, increasing the likelihood of extreme heat events. Although this visualization effectively introduces the concept of changing probabilities, it risks oversimplifying the underlying physics.
The Earth’s climate is fundamentally governed by its energy balance. Anthropogenic greenhouse gases reduce outgoing longwave radiation, producing a persistent planetary energy imbalance. Most of this excess energy is not retained in the atmosphere but absorbed by the oceans, which currently store more than 90% of the additional heat accumulating in the climate system (von Schuckmann et al., 2023; IPCC, 2021).
Consequently, a conceptual continuum extending from lower to higher thermal energy more accurately represents climate-system evolution than one depicting air temperature alone. The atmosphere, oceans, cryosphere, biosphere, and land surface collectively exchange this stored energy through complex interactions that manifest as increasingly energetic weather events.
2. Earth’s Energy Imbalance as the Primary Climate Variable
Surface air temperature is an important diagnostic variable but represents only a small fraction of the total energy accumulating within the Earth system.
Recent observations indicate that the planetary energy imbalance has increased substantially over the satellite era (Loeb et al., 2021). Excess energy is partitioned approximately as follows:
Reservoir
Approximate Fraction of Excess Heat
Oceans
>90%
Land
~5%
Ice Melt
~3%
Atmosphere
~1%
Because the oceans dominate planetary heat storage, climate evolution is fundamentally an energetic process rather than merely an atmospheric warming process.
The horizontal axis in conceptual probability diagrams should therefore be interpreted as representing increasing Earth-system thermal energy, encompassing ocean heat content, atmospheric moisture, latent heat, and the energy available to drive weather systems.
3. Evolution of the Probability Distribution
Traditional illustrations depict warming primarily as a rightward shift of a normal distribution.
However, observations increasingly indicate that the distribution itself is evolving.
Rather than simply translating toward warmer conditions, the upper tail is becoming:
longer,
broader,
heavier,
increasingly asymmetric.
Statistically, this reflects increasing positive skewness and changes in higher-order moments of the climate distribution.
The consequence is that events formerly located far within the statistical tail now occur substantially more often than predicted by historical climatology.
This evolution is consistent with attribution studies demonstrating rapidly increasing probabilities for extreme heat, heavy precipitation, marine heatwaves, and compound climate events (IPCC, 2021).
4. From Rare Extremes to Persistent Extremes
A critical consequence of distributional change is that climate extremes are no longer simply more intense.
They also persist longer.
Persistent blocking highs and heat domes illustrate this transition.
Recent heat events across North America and Europe have demonstrated that elevated temperatures sustained over many consecutive days produce disproportionately greater impacts than isolated hot days.
Long-duration heat increases:
cumulative physiological stress,
nighttime heat exposure,
agricultural losses,
wildfire potential,
electrical demand,
ecosystem mortality.
The probability distribution therefore evolves not only along the intensity axis but also along the temporal dimension.
Duration has become an equally important component of climate risk.
5. Probability Distributions Represent Climate Outcomes, Not Individual Weather Variables
The conceptual bell curve should not be interpreted as describing only hot versus cold weather.
Rather, it represents a simplified probability density distribution of climate outcomes.
The horizontal axis encompasses the full spectrum of possible climate states, while the vertical axis represents their relative probability of occurrence.
Individual manifestations include:
heat waves,
atmospheric rivers,
tropical cyclones,
drought,
severe thunderstorms,
flooding,
wildfire weather,
marine heatwaves,
compound events.
Each reflects a different pathway through which excess thermal energy is redistributed throughout the coupled Earth system.
6. Feedback Coupling and Increasing System Connectivity
Perhaps the most important characteristic of the modern climate system is not simply increasing extremes but increasing interdependence among extremes.
Historically, many weather hazards could be treated as relatively independent processes.
As planetary energy accumulates, however, nonlinear interactions become increasingly common.
Warmer oceans provide additional latent heat to tropical cyclones.
Persistent blocking strengthens heat domes.
Elevated instability increases severe convection and lightning.
Drought increases wildfire probability.
Wildfires increase atmospheric aerosols and carbon emissions.
Ice loss reduces albedo, increasing additional heat absorption.
These interactions represent examples of feedback coupling, whereby one climate process amplifies another through interconnected physical mechanisms.
Rather than isolated hazards, modern climate extremes increasingly function as components of a dynamically coupled energetic system.
7. Earth’s Energy Redistribution
The planetary energy imbalance itself cannot be directly perceived.
Its consequences, however, are observable through increasingly energetic transfers of heat within the climate system.
These transfers manifest as:
stronger atmospheric rivers,
larger heat domes,
heavier precipitation,
more intense tropical cyclones,
stronger thunderstorms,
increased lightning,
more persistent drought,
expanded wildfire activity.
Each represents a different mechanism by which excess thermal energy is redistributed throughout the atmosphere-ocean system.
Viewed collectively, these events provide tangible evidence of an increasingly energetic climate.
8. Implications for Climate Communication
Public discussion frequently emphasizes average warming.
While scientifically accurate, averages obscure the statistical transformation occurring within climate variability.
The central message is therefore not simply that the planet is becoming warmer.
Rather, the probability distribution governing climate outcomes is itself evolving.
Extreme events once considered exceptionally rare now occur with increasing frequency, persist for longer durations, and produce substantially greater societal, ecological, and economic impacts.
Communicating climate change through the lens of Earth’s changing probability distribution provides a more complete understanding of modern climate dynamics than average temperature alone.
9. Conclusion
The defining characteristic of contemporary climate change is not simply rising global mean temperature, but the accumulation and redistribution of excess thermal energy throughout the coupled Earth system. Because the oceans absorb the overwhelming majority of this excess heat, Earth’s energy imbalance provides a more physically meaningful framework for understanding climate evolution than atmospheric temperature alone.
As this energy imbalance grows, the probability distribution of climate outcomes undergoes a fundamental transformation. The distribution does not merely shift toward warmer conditions; it becomes increasingly asymmetric, with a broader and heavier upper tail reflecting more frequent, more intense, and more persistent extreme events. At the same time, individual hazards are becoming progressively interconnected through nonlinear feedback coupling, allowing one extreme to amplify another across atmospheric, oceanic, terrestrial, and cryospheric systems.
Heat domes, atmospheric rivers, severe thunderstorms, tropical cyclones, droughts, floods, and wildfires should therefore be viewed not as isolated phenomena, but as diverse expressions of the same underlying energetic imbalance. Each represents a pathway through which excess thermal energy is redistributed across the Earth system. Interpreting climate change through this probabilistic and energetic framework provides a more comprehensive understanding of why extreme events are accelerating, why compound hazards are becoming increasingly common, and why climate impacts are intensifying faster than changes in global mean temperature alone would suggest.
Footnotes
Earth’s Energy Imbalance (EEI) is defined as the difference between incoming absorbed solar radiation and outgoing longwave radiation at the top of the atmosphere. A positive imbalance indicates continued accumulation of heat within the climate system.
Ocean heat content is widely regarded as the most robust measure of long-term planetary warming because it integrates the vast majority of excess thermal energy stored in the climate system.
In statistical terms, a “heavier right tail” denotes an increased probability of extreme positive departures relative to a normal distribution. In climate science, this reflects a greater likelihood of unusually intense events than would be expected under historical climatic conditions.
Feedback coupling refers to the interaction of two or more climate processes in which one process modifies another, producing amplification or attenuation. Positive feedback coupling can generate compound and cascading extremes that exceed the impacts of individual hazards.
Intergovernmental Panel on Climate Change (IPCC). (2021). Climate Change 2021: The Physical Science Basis. Cambridge University Press.
Loeb, N. G., et al. (2021). Satellite and ocean data reveal marked increase in Earth’s heating rate. Geophysical Research Letters, 48(8), e2021GL093047.
Rohde, R. A., & Hausfather, Z. (2020). The Berkeley Earth land/ocean temperature record. Earth System Science Data, 12, 3469–3479.
Trenberth, K. E., Fasullo, J. T., & Balmaseda, M. A. (2014). Earth’s energy imbalance. Journal of Climate, 27(9), 3129–3144.
von Schuckmann, K., et al. (2023). Heat stored in the Earth system 1960–2020: Where does the energy go? Earth System Science Data, 15, 1675–1709.
World Meteorological Organization (2024). State of the Global Climate 2024. Geneva: WMO.
The original purpose of Solutions to the Fossil Fuel Economy and the Myths Accelerating Climate and Economic Collapse was to focus on practical solutions rather than assigning blame. Since its publication, however, many readers have interpreted that emphasis as minimizing the responsibility of fossil fuel companies. This addendum clarifies that both interpretations can be true simultaneously.
I began my career as an economist specializing in risk management before turning my attention to humanity’s largest systemic risk—climate change. My work spans economics, systems science, statistics, and climate physics. Together with physicist Sidd Mukherjee, I co-originated the Nonlinear Acceleration Hypothesis, a framework describing how interacting physical, ecological, health, and socioeconomic feedbacks can accelerate climate impacts beyond traditional linear projections.
My work has consistently argued that climate change is both a physical and an economic problem. It cannot be understood through atmospheric science alone, nor through economics alone. Rather, it emerges from the interaction of nonlinear Earth-system processes and human decision-making.
Shared Responsibility Does Not Eliminate Corporate Accountability
Fossil fuel consumption is fundamentally a supply-and-demand system. Producers cannot exist without consumers, and consumers cannot purchase what is not supplied. Responsibility therefore exists on multiple levels.
Recognizing consumer responsibility does not absolve fossil fuel companies of their own responsibilities.
Oil and gas companies have exercised enormous influence through lobbying, political advocacy, public relations campaigns, strategic communications, and efforts to delay or weaken climate policy. Those actions deserve careful scrutiny and, where appropriate, legal accountability.
At the same time, it is equally inaccurate to argue that consumers possess no agency whatsoever. While choices are often constrained by infrastructure, income, geography, and available technology, millions of individuals, businesses, and governments have successfully reduced fossil fuel dependence through efficiency improvements, electrification, renewable energy adoption, and changes in consumption patterns.
The issue is therefore not one of assigning exclusive blame to either producers or consumers. Climate change is the product of interacting economic incentives, political institutions, technological development, consumer behavior, and physical climate feedbacks.
Understanding that complexity is essential if society intends to solve the problem rather than merely redistribute blame.
Corporate Accountability
My work has also extensively examined legal and economic mechanisms for holding fossil fuel companies accountable, including:
climate litigation,
consumer protection law,
human rights frameworks,
carbon pricing and taxation,
restitution,
treble-damage recovery, and
broader climate liability frameworks.
Those topics are discussed in detail throughout the following papers, which complement the original economics article rather than contradict it.
The Fossil Fuel Industry
Oil and gas companies unquestionably bear significant responsibility for the climate crisis. Decades of internal research, lobbying, public relations campaigns, political influence, and efforts to delay emissions reductions have been extensively documented. Protecting market share and shareholder value frequently took precedence over communicating known climate risks or accelerating the transition to lower-carbon energy sources.
Those actions deserve public scrutiny and, where appropriate, legal accountability.
However, acknowledging corporate misconduct does not eliminate the role of consumer demand. Energy markets function through supply and demand. Producers extract, refine, and distribute fossil fuels because governments, businesses, and consumers continue to purchase them across transportation, electricity generation, manufacturing, agriculture, aviation, shipping, and residential heating.
This is not a moral judgment; it is an economic reality.
Consumers often operate within real constraints. Infrastructure, housing, public transportation, income, local utility policies, and technology availability all influence individual choices. Some households possess far greater flexibility than others. Nevertheless, constrained choice is not the same as no choice. Millions of households and businesses have reduced fossil fuel consumption through energy efficiency, electrification, renewable energy, improved building design, vehicle selection, and changes in consumption patterns. Each reduction weakens demand at the margin.
Likewise, governments influence both supply and demand through regulation, taxation, subsidies, infrastructure investments, and public procurement. Climate policy therefore operates across every level of society rather than through a single actor.
The climate crisis emerged from interacting physical, economic, technological, and political systems. Effective solutions require addressing each component simultaneously.
Existing Work on Corporate Accountability
Contrary to claims that emphasizing consumer responsibility somehow absolves fossil fuel producers, much of my work focuses specifically on legal and economic accountability for corporate misconduct.
The following papers examine those issues in detail.
Climate Change and Accountability
Climate Change and Accountability: Legal Challenges, Consumer Rights, and Human Rights in the Fight Against Fossil Fuels
This paper examines the legal foundations for climate litigation, including consumer fraud, public nuisance, deceptive marketing, human rights claims, restitution, and the application of legal principles similar to those successfully employed against the tobacco industry.
The Economics of Climate Change
Climate change is fundamentally different from most economic shocks.
Traditional recessions eventually recover. Financial crises stabilize. Commodity shortages resolve. Climate change does not naturally return to equilibrium within human timescales because excess greenhouse gases and accumulated ocean heat continue influencing the climate system for decades to centuries.
As University of Cape Town researcher Christopher Trisos observed:
“For people, other species, ecosystems, and the world we live in, we’ve entered the Age of Loss and Damage, but we’re just at the start.”
Likewise, following the record-breaking Northern Hemisphere summer of 2023, United Nations Secretary-General António Guterres warned:
“Climate breakdown has begun.”
These statements reflect a growing recognition that climate damages are no longer primarily future risks—they have become ongoing economic realities.
The Age of Loss and Damage
Climate economics must therefore evolve beyond traditional Integrated Assessment Models (IAMs), many of which assume smooth, gradual damage functions that underestimate systemic risk.
My work argues that climate damages arise from interacting nonlinear feedbacks operating simultaneously across physical, ecological, health, financial, insurance, agricultural, infrastructure, and geopolitical systems.
Understanding those interactions requires integrating:
economics,
systems science,
statistics,
atmospheric physics,
ecology,
public health, and
risk management.
The resulting framework is consistent with the Nonlinear Acceleration Hypothesis, which recognizes that climate impacts increasingly reinforce one another through cascading feedback loops rather than simple linear cause-and-effect relationships.
Accounting for Climate Damages
One objective of climate economics is not merely estimating annual losses, but accounting for the full societal burden imposed by delayed mitigation and continued emissions.
Quantifying the Climate Tax
Quantifying the Climate Tax: The Full Ledger of Harm
This paper estimates the annual economic burden currently imposed by climate change on American households.
The analysis concludes that the direct annual climate burden already approaches $6,000 per person, while the broader long-term burden—including infrastructure degradation, ecosystem loss, health impacts, insurance instability, productivity losses, and deferred damages imposed on future generations—is substantially larger.
Climate change is therefore functioning as an invisible tax already embedded throughout the economy.
The Legal Foundation for Treble Damages
American law has long recognized that ordinary compensation is insufficient when misconduct is deliberate, deceptive, or socially destructive.
Treble damages appear throughout U.S. law, including:
Sherman Act antitrust litigation,
RICO actions,
False Claims Act enforcement, and
numerous state consumer protection statutes.
Their purpose extends beyond compensation. They deter future misconduct while recognizing that direct damages frequently underestimate total societal harm.
A comparable framework may be appropriate when evaluating climate-related damages if plaintiffs establish that institutions knowingly delayed mitigation while externalizing foreseeable risks onto the public.
Justice, Restitution, and Climate Liability
Applying a justice framework to climate economics raises three related questions:
Did organizations knowingly externalize foreseeable climate damages?
Have those damages fallen disproportionately upon vulnerable populations and future generations?
Should legal remedies reflect deterrence as well as compensation?
These questions extend beyond economics into ethics, law, and public policy, but they are increasingly becoming central to climate litigation worldwide.
The Cost of Inaction
The companion paper,
The Full Economic Burden: An Ensemble-Based Probabilistic Framework
develops an ensemble-based probabilistic framework for estimating the long-term economic consequences of accelerating climate change.
Under the median ensemble projection, annual U.S. climate-related economic losses increase nearly tenfold, rising from approximately $2.1 trillion in 2025 to $19.5 trillion by 2050 (constant 2025 dollars).
Rather than projecting a steady increase in damages, the analysis demonstrates how interacting physical, ecological, health, financial, and socioeconomic feedbacks can transform climate change into an accelerating systemic economic burden.
Under the median ensemble scenario, cumulative U.S. climate-related losses between 2025 and 2050 approach $200 trillion (constant 2025 dollars).
These projections illustrate a central conclusion of the Nonlinear Acceleration Hypothesis: delayed responses, thermal inertia, interacting feedbacks, and tipping cascades can produce economic impacts that grow substantially faster than traditional linear or quadratic damage models anticipate.
Conclusion
Climate responsibility should never be framed as an either-or proposition.
Corporations that knowingly delayed climate action should be held accountable through transparent governance, appropriate regulation, and where justified, legal remedies.
Governments bear responsibility for designing policies that correctly price externalities, accelerate innovation, and remove barriers to decarbonization.
Businesses bear responsibility for reducing emissions throughout their operations and supply chains.
Consumers also retain agency through the choices they make within the constraints they face.
Climate change emerged from the interaction of all of these systems. Lasting solutions will require accountability and action across all of them.
Macro-Welfare Frameworks vs. Economic Justice Valuation in the United States
Daniel Brouse and Sidd Mukherjee
I. Introduction
A. Research Problem
Climate change imposes large and growing costs on the United States, yet there is still no centralized national ledger that captures the full burden in a unified way. Conventional economic indicators—especially GDP, insured losses, and direct disaster tallies—systematically undercount the real cost of climate disruption because they omit or minimize non-market harms such as premature mortality, reduced life expectancy, chronic illness, degraded quality of life, ecological destabilization, and the unequal distribution of climate damages across vulnerable populations.
A narrow GDP-centered framework also fails to capture a second dimension of climate cost: accountability. A large share of today’s climate burden is not simply the product of random weather volatility. It is the cumulative result of delayed mitigation, externalized damages, underpriced emissions, regulatory failure, and in some cases decades of deception regarding the risks of fossil-fuel dependence. That means climate accounting must confront not only what climate change is costing the economy, but also what it should cost under a framework of social justice and deterrence.
B. Thesis Statement
Evaluating the 2025 U.S. cost of climate change requires moving beyond direct disaster losses and beyond GDP-centered accounting. Using a dual-lens approach, it compares:
a Macroeconomic and Welfare Framework, which estimates the 2025 U.S. climate burden at approximately $2.06 trillion, or about $6,050 per person, and
an Economic and Social Justice Framework, which applies a treble-damages logic to climate-linked economic harms and yields a 2025 burden of approximately $6.0 trillion, or about $17,600 per person.
The core claim is that traditional economic metrics substantially understate the true societal burden of climate change. Climate damages should be understood not only as macroeconomic drag and welfare erosion, but also as a form of externalized injury with distributive, ethical, and potentially punitive dimensions.
C. Scope of the Study
This study focuses on the United States in calendar year 2025. Per-capita values are based on a U.S. population baseline of approximately 340 million residents. The analysis is national rather than state-specific and is intended as a high-level accounting framework rather than a final litigation damages model.
II. Methodology 1: The Macroeconomic and Welfare Framework
A. Conceptual Architecture
The first framework combines two components:
Economic burden: the direct and indirect market-facing costs imposed by climate change in 2025; and
Climate welfare burden: the non-market human costs associated with mortality, life-expectancy loss, morbidity, and degraded quality of life.
For 2025, the study uses the following central values:
$1.50T + $0.56T = $2.06T
On a per-capita basis:
$2.06T / 340M = $6,059 ≈ $6,050 per person
This can also be expressed as:
$4,400 + $1,650 = $6,050
where:
$4,400 per person is the estimated economic burden, and
$1,650 per person is the estimated climate welfare burden.
B. The Economic Burden Baseline: $1.5 Trillion ($4,400 per Capita)
The economic burden baseline is designed to capture the direct and indirect market-facing cost of climate change in the United States in 2025. It includes seven broad categories of loss.
1. Direct disaster damages
This category includes physical destruction from hurricanes, inland flooding, wildfires, convective storms, drought-related losses, heat-related infrastructure damage, and other extreme-weather events. It covers residential, commercial, public-sector, insured, and uninsured losses.
2. Real estate and insurance destabilization
Climate change is increasingly priced into property markets and insurance markets through higher premiums, policy nonrenewals, shrinking insurability, reserve stress, and geographic repricing of risk. These effects act as a quasi-tax on households, businesses, and municipalities even in years without a single catastrophic event.
3. Healthcare and health-insurance costs
Heat stress, wildfire smoke, respiratory disease, cardiovascular strain, injuries, mental-health burdens, and other climate-related medical effects increase both direct healthcare spending and insurance costs. These costs are counted here only insofar as they represent market expenditures rather than welfare losses already captured separately in the climate welfare framework.
4. Climate-driven inflation and household cost pressure
Climate shocks increase the price of food, electricity, water, transportation, and household essentials through crop disruption, supply-chain interruption, infrastructure stress, and energy-demand spikes. These effects function as a hidden climate tax on households and are treated as part of the economic burden.
5. Tourism and recreation losses
Climate volatility disrupts beach economies, ski industries, lake and river recreation, outdoor events, park visitation, and seasonal tourism revenue. The direct revenue loss belongs in the economic burden, while the lost enjoyment and diminished lived experience belong more naturally in the welfare framework.
6. Public finance and fiscal burden
Federal, state, and local governments increasingly absorb climate costs through disaster relief, infrastructure repair, emergency response, insurance backstops, and climate-related borrowing. These expenditures represent real public resource costs even when financed through debt.
7. Productivity losses
Heat stress, smoke exposure, flooding, power outages, transportation interruption, and business downtime reduce labor productivity and economic output. These losses are among the most undercounted but economically significant climate costs.
Taken together, these categories produce a 2025 U.S. economic burden estimate of approximately $1.5 trillion.
On a per-capita basis:
$1.50T / 340M = $4,412 ≈ $4,400 per person
This figure is intended as an integrated estimate of the market-facing annual climate burden imposed on the United States in 2025.
C. The Climate Welfare Accounting Framework (CWAF): $560 Billion ($1,650 per Capita)
The second component of Framework 1 is the Climate Welfare Accounting Framework (CWAF), which measures the direct erosion of human well-being from climate change. CWAF is designed to capture losses that do not appear clearly in GDP or conventional market accounts, including premature mortality, reduced life expectancy, chronic morbidity, and diminished quality of life.
1. CWAF structure
CWAF is organized around three pillars:
Pillar A: Mortality valuation
Pillar B: Life-expectancy loss
Pillar C: Morbidity and quality-of-life loss
The raw component identity is:
CWAF(raw) = A + B + C
Using the central estimates in this framework:
A = $375B
B = $80B
C = $180B
So the raw component sum is:
$375B + $80B + $180B = $635B
However, because mortality, life-year loss, and morbidity estimates can overlap at the margins even after careful structuring, the framework applies a conservative overlap adjustment and presents a central CWAF estimate of approximately $560 billion rather than the full raw sum of $635 billion.
Thus:
CWAF raw central estimate = $635B
CWAF adjusted central estimate ≈ $560B
On a per-capita basis:
$560B / 340M = $1,647 ≈ $1,650 per person
2. Pillar A: Mortality valuation
Pillar A estimates the welfare cost of climate-attributable premature mortality using the Value of a Statistical Life (VSL) framework used in federal regulatory analysis.
The stylized formula is:
A = D × VSL
where:
D = estimated climate-attributable premature deaths in 2025
VSL = value of a statistical life
Pillar A is treated as a contemporaneous willingness-to-pay valuation of mortality risk, not as a decomposition of life-years. Because Pillar A values mortality using a contemporaneous VSL, discounting is primarily relevant to Pillar B and to any portion of Pillar C that reflects future streams of lost healthy life rather than same-year welfare loss.
3. Pillar B: Life-expectancy loss
Pillar B captures the welfare loss associated with reductions in healthy life expectancy caused by heat exposure, smoke exposure, chronic disease burdens, and other climate-linked pathways that may not appear as immediate mortality events in a single-year accounting frame.
The stylized formula is:
B = Σ(LYᵢ × VSLY)
where:
LYᵢ = climate-attributable life-years lost for group i
VSLY = value of a statistical life-year
Pillar B is constructed as a non-overlapping residual welfare component and is not derived by mechanically decomposing Pillar A’s VSL estimate into life-years. Instead, it captures life-expectancy and health losses not already subsumed within the mortality valuation framework used in Pillar A. Put differently, Pillar A (VSL-based mortality valuation) captures the welfare equivalent of premature mortality as a contemporaneous risk realization, while Pillar B is calibrated to exclude mortality already captured in Pillar A and instead reflects residual life-expectancy and morbidity effects not subsumed by VSL valuation.
4. Pillar C: Morbidity and quality-of-life loss
Pillar C estimates the welfare cost of climate-driven morbidity, including heat-related illness, smoke-related respiratory burdens, mental-health stress, chronic disease aggravation, and other forms of degraded physical and psychological well-being.
The stylized formula is:
C = Σ(Qᵢ × Vᵢ)
where:
Qᵢ = quantity of climate-attributable morbidity burden for condition i
Vᵢ = monetized welfare value associated with that burden
This pillar can be operationalized using QALY, DALY, or related health-welfare valuation methods.
D. Summary of Framework 1
The Macroeconomic and Welfare Framework yields the following 2025 estimate:
$1.50T + $0.56T = $2.06T
Per capita:
$2.06T / 340M = $6,059 ≈ $6,050 per person
For a family of four:
4 × $6,050 = $24,200
Framework 1 therefore estimates that climate change imposed a 2025 macro-welfare burden of roughly $2.06 trillion on the United States, equivalent to about $6,050 per person or $24,200 for a family of four.
III. Methodology 2: The Economic and Social Justice Framework
A. Conceptual Architecture
Framework 2 asks a different question. Instead of measuring only the annual economic and welfare burden of climate change, it asks what the ledger would look like if climate damages were valued through a justice and deterrence lens, analogous to legal doctrines that multiply proven damages in response to willful misconduct, fraud, or socially destructive externalization of harm.
This framework begins with the same $1.5 trillion economic damage baseline used in Framework 1, but applies a treble-damages logic to those economic damages only.
Let:
E = Economic Climate Damages = $1.5T
Then the justice framework is:
Justice Cost = E + 3E = 4E
Substituting the 2025 baseline:
$1.5T + 3($1.5T) = $6.0T
Equivalently:
4 × $1.5T = $6.0T
On a per-capita basis:
$6.0T / 340M = $17,647 ≈ $17,600 per person
For a family of four:
4 × $17,600 = $70,400
Why the treble multiplier is applied only to the $1.5T economic burden
The treble-damages multiplier is applied only to the market-facing economic damage ledger ($1.5T), not to the CWAF welfare component ($560B). This choice is intentional. The justice framework is designed as a liability-style multiplier on economic damages—that is, on direct and indirect market harms such as property destruction, insurance destabilization, healthcare spending, public fiscal outlays, productivity loss, and climate-driven price pressures. By contrast, the CWAF already monetizes non-market welfare harms such as mortality risk, life-expectancy degradation, and morbidity-related quality-of-life loss. Trebling those welfare values would risk both conceptual double counting and an analytically awkward punitive replication of already-imputed welfare losses. Accordingly, Framework 2 should be understood as a justice-weighted escalation of the economic climate ledger, not as a trebling of the entire macro-welfare burden.
This framework is therefore not presented as a conventional welfare-economics estimate. It is a normative legal-economic framework designed to reflect accountability, deterrence, and the uneven distribution of climate harm.
B. The Legal Foundation of Treble Damages
Treble damages are a long-established feature of U.S. law in contexts where ordinary compensation is considered inadequate to deter or punish egregious misconduct. They appear most prominently in:
Antitrust law, including the Sherman Act
Civil racketeering actions, including RICO-based claims
False Claims Act enforcement, where fraud against the public fisc can trigger multiplied damages
The logic of treble damages is not merely compensatory. It is also punitive and deterrent. Trebling recognizes that some harms are imposed through conduct sufficiently reckless, deceptive, or socially damaging that ordinary compensation fails to capture either the full social cost or the need for institutional deterrence.
C. Application to Climate Justice
The justice framework applies this legal logic to climate damages on the theory that a substantial share of modern climate costs reflects not only physical climate change, but also delayed mitigation, historic externalization of damages, and sustained campaigns of misinformation or obstruction that prolonged fossil-fuel dependence and delayed adaptation.
Three considerations motivate the treble-damages approach:
1. Willful misconduct and delayed action
If major emitters or institutions knowingly delayed action while externalizing foreseeable climate harms onto the public, then a purely compensatory accounting of damages may understate the true social cost of that conduct.
2. Unequal distribution of harm
Climate damages are not evenly distributed. Lower-income households, communities of color, medically vulnerable populations, outdoor workers, and disaster-prone regions often bear disproportionate burdens. A justice framework therefore recognizes that climate losses are not merely aggregate economic losses but also distributional injuries.
3. Deterrence and accountability
A damages framework that merely reimburses a fraction of direct losses may fail to deter future misconduct. A justice-oriented framework treats climate damages as the basis for a larger accountability regime aimed at shifting incentives, strengthening disclosure, and pricing the cost of willful inaction.
IV. Comparative Analysis
A. Aggregate Results
The two frameworks produce sharply different valuations of the 2025 U.S. climate burden.
Metric
Framework 1: Macro-Welfare
Framework 2: Justice
Economic burden baseline
$1.50 trillion
$1.50 trillion
Welfare burden (CWAF)
$0.56 trillion
—
Treble-damages penalty on economic burden
—
$4.50 trillion
Total national cost
$2.06 trillion
$6.00 trillion
Cost per capita
$6,050
$17,600
Cost for family of four
$24,200
$70,400
Framework 1 estimates the full annual burden of climate change on the economy and on human welfare. Framework 2 estimates the justice-weighted accountability cost of climate harm if society chose to treat delayed mitigation and externalized damages as punishable economic injury.
B. Analytical Differences Between the Frameworks
1. Audience and institutional use
Framework 1 is primarily relevant to:
fiscal policy analysts
macroeconomists
central banks
public-health planners
federal agencies conducting benefit-cost analysis
Framework 2 is more relevant to:
litigators
state attorneys general
municipal plaintiffs
tort scholars
climate-justice advocates
2. Philosophical foundation
Framework 1 measures systemic drag, welfare erosion, and hidden social cost. It asks: What is climate change costing the country in real economic and human terms right now?
Framework 2 measures culpability, deterrence, and social restitution. It asks: What would climate damages look like if society priced not only the injury itself, but also the institutional misconduct that helped produce and intensify it?
3. Risk allocation
Framework 1 reveals the extent to which climate change already functions as a hidden national tax on households, businesses, and governments. Framework 2 goes further by reallocating that burden conceptually back toward those who knowingly profited while imposing climate costs on others.
V. Policy, Legal, and Economic Implications
A. Macroeconomic Policy
The first implication is that GDP alone is no longer an adequate climate accounting tool. A country can rebuild after a flood, spend more on medical care, or borrow more for disaster relief, and those expenditures may still appear as positive economic activity in national accounts even as the underlying social condition worsens.
Incorporating macro-welfare climate accounting into federal analysis would improve:
Office of Management and Budget benefit-cost analysis
federal adaptation planning
public-health prioritization
insurance and housing policy
long-run fiscal projections
A climate burden of roughly $2.06 trillion in 2025, or about $6,050 per person, implies that climate change already functions as a material macroeconomic drag on the United States.
B. Climate Litigation and Tort Reform
The second implication is legal. The justice framework provides a conceptual bridge between aggregate climate economics and climate liability. If climate damages are increasingly litigated through state, municipal, and public-nuisance actions, a framework that translates economic harm into a deterrence-oriented damages structure may become increasingly relevant.
This does not mean courts should automatically adopt a 3x multiplier in climate litigation. Rather, it suggests that climate damages can be conceptualized not merely as diffuse acts of nature, but as partly socialized harms linked to historic patterns of concealment, delay, and cost externalization.
C. Socioeconomic Equity
A third implication concerns equity. If the annual climate burden is framed as $17,600 per person under a justice-based model, the economics of adaptation, resilience spending, green infrastructure, household subsidies, and climate restitution look very different. The scale of the burden implies that aggressive decarbonization and resilience investment may be economically justified not merely as environmental policy, but as partial relief from a large and regressive climate tax.
VI. Limitations
Several limitations should be acknowledged.
A. Framework 1 limitations
The macro-welfare framework is a synthetic accounting model rather than a single-source official estimate. Its economic burden baseline aggregates multiple categories of loss that are themselves subject to uncertainty, overlap, and incomplete attribution. The CWAF component similarly relies on bounded welfare estimates rather than a single fully observed national health ledger.
B. Framework 2 limitations
The justice framework is explicitly normative. It is not a standard welfare-economic estimate and should not be confused with a measured national-income loss. Its treble-damages logic is best understood as a legal-economic thought experiment grounded in deterrence and accountability rather than as a conventional national-accounts statistic.
C. Attribution limitations
Not every harmful event in 2025 can be cleanly attributed to climate change, and climate-health pathways remain unevenly measured across disease categories, geographies, and populations. As with all climate-damages accounting, results depend partly on attribution choices, valuation assumptions, and the treatment of overlap among categories.
VII. Conclusion
A. Restatement of Main Findings
This study develops a dual accounting of the 2025 U.S. climate burden.
Under the Macroeconomic and Welfare Framework, climate change imposed an estimated burden of:
$1.50T + $0.56T = $2.06T
equivalent to roughly:
$2.06T / 340M = $6,059 ≈ $6,050 per person
or:
4 × $6,050 = $24,200 for a family of four
Under the Economic and Social Justice Framework, applying a treble-damages logic to the $1.5 trillion economic burden yields:
$1.5T + 3($1.5T) = $6.0T
equivalent to roughly:
$6.0T / 340M = $17,647 ≈ $17,600 per person
or:
4 × $17,600 = $70,400 for a family of four
B. Final Synthesis
Climate change now functions in the United States as both an immediate economic tax and a profound social injustice. The first framework measures what the country is losing in output, health, welfare, and resilience. The second asks what those losses would look like if climate harm were treated not merely as misfortune, but as a large-scale social injury intensified by delayed action, externalized damages, and institutional failure.
The gap between $2.06 trillion and $6.0 trillion is therefore not a contradiction. It reflects two different but complementary questions:
What is climate change costing the United States right now?
What should climate damages cost if accountability and deterrence are taken seriously?
C. Future Research Directions
Future work should extend this framework in at least four directions:
State-level and metropolitan climate-tax estimates, especially for high-risk regions facing acute insurance, flood, heat, or wildfire stress
Sector-specific justice multipliers, particularly for fossil-fuel litigation and public-finance exposure
Improved climate-health attribution models, especially for smoke exposure, heat mortality, chronic disease aggravation, and infectious disease pathways
Dynamic multi-year climate ledgers that track the compounding interaction of direct disaster losses, welfare erosion, and legal liability over time
Appendix A. Summary Tables
A1. Framework 1: Macro-Welfare Burden
Component
Aggregate Cost
Per Capita
Economic burden baseline
$1.50 trillion
$4,400
Climate Welfare Accounting Framework (CWAF)
$0.56 trillion
$1,650
Total Framework 1 burden
$2.06 trillion
$6,050
A2. CWAF Raw Component Structure
CWAF Pillar
Low
Central
High
Mortality cost
$225B
$375B
$562.5B
Life expectancy loss cost
$40B
$80B
$140B
Morbidity / quality-of-life cost
$100B
$180B
$280B
Total welfare cost (raw component sum)
$365B
$635B
$982.5B
Note: The raw central sum of $635B is conservatively adjusted downward in the CWAF headline estimate to approximately $560B to account for overlap risk across mortality, life-year loss, and morbidity channels.
U.S. Environmental Protection Agency. (2010). Guidelines for Preparing Economic Analyses. National Center for Environmental Economics, U.S. EPA, Washington, DC. Available at: EPA Guidelines for Preparing Economic Analyses
Social cost of carbon, climate damages, and climate-economy valuation
Interagency Working Group on the Social Cost of Greenhouse Gases, United States Government. (2021). Technical Support Document: Social Cost of Carbon, Methane, and Nitrous Oxide Interim Estimates under Executive Order 13990. Washington, DC. Available at: Interagency Working Group Technical Support Document
Rennert, K., Errickson, F., Prest, B. C., Rennels, L., Newell, R. G., Pizer, W., Kingdon, C., Wingenroth, J., Cooke, R., Parthum, B., Smith, D., Cromar, K., Diaz, D., Moore, F. C., Müller, U. K., Mendelsohn, R., Anthoff, D., Rose, S., & Waldhoff, S. (2022). “Comprehensive evidence implies a higher social cost of CO₂.” Nature, 610, 687–692.
Carleton, T. A., Jina, A., Delgado, M. T., Greenstone, M., Houser, T., Hsiang, S., Hultgren, A., Jisu, K., McCusker, K., Nath, I., Rising, J., Rode, A., Seo, H. K., Viaene, A., Yuan, J., & Zhang, A. T. (2022). “Valuing the global mortality consequences of climate change accounting for adaptation costs and benefits.” The Quarterly Journal of Economics, 137(4), 2037–2105.
U.S. climate impacts, health burden, and national assessment context
U.S. Global Change Research Program. (2023). Fifth National Climate Assessment. Washington, DC: U.S. Global Change Research Program. Available at: https://nca2023.globalchange.gov/
Romanello, M., Di Napoli, C., Green, C., Kennard, H., Lampard, P., Scamman, D., Walawender, M., Ali, Z., et al. (2024). “The 2024 report of the Lancet Countdown on health and climate change: facing record-breaking threats from delayed action.” The Lancet. (Use the final journal citation details/DOI exactly as published in the version you relied on.)
This paper estimates the long-run evolution of U.S. climate-related economic burdens and finds strong evidence of nonlinear acceleration. Using a reconstructed baseline in the late 19th century and an integrated 2025 estimate of approximately $1.5 trillion annually in climate-attributable economic losses, we estimate that the effective doubling time of climate-related economic burden has compressed from ~115 years (circa 1890) to ~8 years in the present regime. We project forward under continued compression dynamics to 2030 and 2040, showing that costs may enter multi-trillion-dollar annual regimes within the next two decades if current nonlinear amplification persists.
1. Economic Burden Definition
The total climate-linked economic burden is defined as:
Climate-linked economic burden in the United States exhibits a nonlinear acceleration regime characterized by a ~14× compression in doubling times since 1890, shifting from century-scale dynamics to decade-scale systemic amplification.
10. Conclusion
The United States climate-linked economic burden has transitioned from a low-coupling hazard system in the late 19th century to a highly nonlinear, inflation-amplified economic stress system in the 21st century. Using a 2025 estimate of $1.5 trillion annually, we find that doubling times have compressed from ~115 years to ~8 years, implying a ~14× acceleration in the growth rate of climate-attributable damages. Under continued compression, annual burdens may reach $7–12 trillion by 2040.