bookmark_borderA Coupled Framework for Compression of Climate Impact Doubling Times

Climate Jerk in Socio-Ecological Systems

By Daniel Brouse and Sidd Mukherjee

Abstract

Conventional climate-risk analysis often treats impacts as the downstream consequence of physical hazard
intensification alone. In this framing, rising losses, displacement, mortality, infrastructure disruption,
and systemic instability are interpreted primarily as a function of increasing temperature, precipitation
extremes, sea-level rise, or other physical forcing variables. While useful, that approach increasingly fails
to explain the observed acceleration of climate damages in the real world, where losses are shaped not only
by changing hazards, but by the interaction of hazards with exposure, governance capacity, adaptation limits,
and broader socio-economic fragility.

This paper proposes a revised socio-ecological framework for climate impact dynamics:

D(t) = H(t)E(t) − P(t) + S(t)

where:

  • D(t) represents realized climate damages or disruption
  • H(t) is hazard forcing
  • E(t) is exposure
  • P(t) is protection, governance, and adaptation capacity
  • S(t) is socio-economic stress amplification

We argue that climate impacts should be understood not as the output of a stationary hazard-loss relationship,
but as the emergent behavior of a non-stationary coupled system whose internal interactions increasingly amplify
the effects of physical climate forcing.

Within this framework, the relevant measure is not merely the rate of warming or the trend in a single physical
variable, but the compression of effective doubling times for climate impact indicators. We show
that a wide range of impact metrics—including insured losses, flood damages, infrastructure failures,
agricultural disruptions, heat mortality, displacement, and adaptation costs—can be interpreted as manifestations
of an accelerating effective growth constant generated by the coupling of H, E, P, and
S. Under this interpretation, the characteristic doubling time of major climate impacts appears to have
contracted from roughly century-scale behavior in the late nineteenth and early twentieth centuries to
decadal-scale behavior in the contemporary era.

We define this compression in effective timescales as a form of climate jerk: the acceleration
of the acceleration of realized climate damages within a socio-ecological system. Climate jerk is not a purely
meteorological quantity. It is the emergent signature of a civilization encountering intensifying hazards with
increasing exposure, uneven protection, and mounting systemic stress. This framework helps explain why climate
impacts now appear to accelerate faster than hazard-only models would predict, and why adaptation strategies that
focus narrowly on physical climate variables may systematically underestimate future risk.

1. Introduction

Climate change is often described through the language of physical forcing: rising temperatures, increasing
atmospheric moisture, shifting precipitation patterns, stronger heat extremes, sea-level rise, and intensifying
hydrologic and ecological disruption. These changes are real and well-established. Yet the most socially relevant
outcomes of climate change—flood losses, infrastructure failures, heat mortality, wildfire destruction, crop
losses, migration, insurance withdrawal, public-health crises, and governance strain—do not arise from hazard
forcing alone. They emerge from the interaction of physical hazards with where people live, how wealth and
infrastructure are distributed, how resilient institutions are, and how much stress a society can absorb before
nonlinear breakdown begins.

The prevailing hazard-centric framing tends to assume that damages are some relatively stable function of physical
forcing. In its simplest form, this can be represented as a loss function tied directly to hazard magnitude or to
a small set of physical indicators. That approach is increasingly inadequate. The observed growth of climate
damages over the past several decades cannot be fully understood without accounting for the rapid expansion of
exposed assets, the concentration of populations in high-risk geographies, the uneven performance of adaptation
and governance systems, and the feedback loops through which repeated shocks degrade social and economic
resilience.

A coastal flood in 1920 and a coastal flood of comparable meteorological character in 2025 do not produce
equivalent outcomes. The latter strikes a vastly larger and more interconnected system of homes, roads,
hospitals, ports, grids, insurance structures, supply chains, and politically stressed communities. Similarly,
a heat wave or wildfire event today unfolds in a world of denser urbanization, tighter agricultural margins,
aging infrastructure, more expensive real estate, higher debt burdens, and increasingly polarized governance
environments. The same physical perturbation therefore generates a larger and often more persistent social impact.

This paper proposes that climate damages should be modeled as the output of a coupled socio-ecological
system
rather than as a simple hazard response function. We define realized climate damages or disruption
D(t) as:

D(t) = H(t)E(t) − P(t) + S(t)

where:

  • H(t) = hazard forcing, including the frequency, intensity, persistence, and spatial extent of physical climate extremes
  • E(t) = exposure, including the distribution of people, infrastructure, agriculture, insured value, and economic assets in hazard-prone environments
  • P(t) = protection, governance, and adaptation capacity, including physical defenses, institutional competence, emergency response, social safety nets, and long-term planning
  • S(t) = socio-economic stress amplification, including fragility induced by inequality, debt, migration pressures, insurance retreat, infrastructure interdependence, public-health strain, political dysfunction, and cascading failures

The purpose of this formulation is not to claim that these terms are fully separable or universally measurable in
a single closed form. Rather, it is to establish a more realistic conceptual and analytical framework for
understanding why climate impacts are accelerating faster than hazard-only approaches imply.

The central claim of this paper is that the most important observable signature of this coupled system is the
compression of effective doubling times in climate impact indicators. A system whose losses double
every century behaves very differently from one whose losses double every decade. Even if the physical climate
signal evolves more gradually, the socio-ecological damage signal can accelerate much faster because the system
itself is changing: exposure grows, adaptation saturates, and stress amplification compounds each shock. The
result is a shortening of the effective timescale of damage growth.

We refer to this shortening—and the underlying increase in the rate of increase—as climate jerk.
In mechanics, jerk is the derivative of acceleration with respect to time. In climate socio-ecological systems,
climate jerk refers to the increasing acceleration of realized impacts as hazards, exposure, governance limits,
and systemic fragility interact. It is a way of naming the phenomenon in which the climate damage function itself
becomes more nonlinear over time.

The framework developed here does not replace physical climate science. Rather, it extends it into the domain
where climate change is actually experienced: not only in degrees Celsius, but in destroyed infrastructure,
uninsurable neighborhoods, repeated crop failures, overwhelmed emergency systems, migration pressure, and
cascading economic instability. If the aim of climate analysis is to understand the future trajectory of
real-world damages, then the hazard must be studied together with the system it strikes.

2. From Hazard-Centric Models to Coupled Damage Dynamics

2.1 The limitation of hazard-only framing

Traditional climate-impact discussions often begin from a hazard function of the form:

D(t) ≈ f(H(t))

D(t) ∝ H(t)

Such formulations are not inherently wrong. In many narrow contexts, hazard magnitude is indeed the dominant
explanatory variable. But as a general framework for long-horizon climate damages, it is incomplete because it
assumes that the relationship between hazard and impact is sufficiently stable to be described primarily through
physical forcing.

In reality, the same hazard can produce radically different outcomes depending on exposure and social conditions.
A floodplain with sparse settlement and minimal capital stock is not equivalent to a floodplain dense with
suburban development, industrial infrastructure, electrical substations, data centers, hospitals, and
transportation corridors. Nor is a society with strong public-health systems, ample fiscal reserves, and robust
evacuation capacity equivalent to one with weakened institutions, unaffordable insurance, and high preexisting
stress.

Thus, hazard-only models tend to understate the degree to which impacts can accelerate even if the underlying
climate forcing evolves more smoothly. The hazard may be the trigger, but the realized damage is produced by the
coupled system the hazard encounters.

2.2 The coupled socio-ecological formulation

We therefore define realized climate damages as:

D(t) = H(t)E(t) − P(t) + S(t)

This equation is best interpreted as a framework equation rather than a final calibrated model. It formalizes four intuitions:

  1. Hazard alone does not create damage; hazard must strike something.
    The term H(t)E(t) captures the multiplicative effect of physical extremes acting upon exposed
    populations, infrastructure, and assets.
  2. Protection and adaptation can suppress realized damage.
    The term P(t) represents all forms of buffering capacity: seawalls, drainage, building codes,
    early warning systems, evacuation logistics, crop switching, grid hardening, public-health systems, insurance
    mechanisms, and competent governance.
  3. Socio-economic stress can amplify damage independently of hazard magnitude.
    The term S(t) represents the extent to which existing fragility turns a severe event into a
    systemic crisis. A flood striking a financially stressed municipality, an uninsured household sector, or an
    already overloaded emergency system can generate much larger downstream disruption than the hazard alone would imply.
  4. The system is non-stationary.
    None of these terms is constant. Hazards intensify, exposure grows and relocates, protection improves unevenly
    and may saturate, and social stress can accumulate through repeated shocks. The relationship between forcing and
    damages is therefore not fixed.

3. The Four Components of the Framework

3.1 Hazard forcing: H(t)

H(t) represents the physical climate hazard environment. This includes, but is not limited to:

  • extreme precipitation intensity and persistence
  • flood frequency and compound flood risk
  • heat extremes and humidity stress
  • wildfire-conducive heat, drought, and wind regimes
  • drought persistence and agricultural water stress
  • tropical cyclone rainfall, storm surge, and wind damage potential
  • sea-level rise and tidal inundation
  • ecological destabilization affecting disease vectors, food systems, and fire regimes

In a warming world, H(t) is not simply a linear trend in average temperature. It is a changing
hazard field characterized by intensifying tails, altered persistence, compounding events, and growing background
conditions that make extremes more destructive.

3.2 Exposure: E(t)

E(t) represents the amount and distribution of people, infrastructure, assets, and economic activity located in harm’s way. Exposure includes:

  • population growth in coastal, fluvial, and wildland-urban interface zones
  • concentration of high-value property and infrastructure in risk-prone areas
  • growth of insured value and replacement costs
  • supply-chain dependence on vulnerable transport and logistics nodes
  • agricultural exposure to heat, drought, or flood-sensitive regions
  • urban heat exposure due to dense built environments

Exposure matters because climate losses are not driven solely by stronger hazards; they are also driven by the
increasing value and complexity of what those hazards strike.

3.3 Protection and governance: P(t)

P(t) represents the ability of societies to reduce or absorb impacts. It includes:

  • engineered defenses and resilient infrastructure
  • land-use planning and retreat from high-risk areas
  • emergency response and disaster preparedness
  • public-health capacity
  • insurance and financial backstops
  • social safety nets
  • institutional competence and long-term governance

P(t) can delay or reduce damages, but it does not necessarily scale in proportion to
H(t) and E(t). In many jurisdictions, adaptation is underfunded, politically
delayed, or structurally incapable of matching the speed of risk accumulation.

3.4 Socio-economic stress amplification: S(t)

S(t) is the term most often omitted from conventional climate-impact analysis. It captures the degree to which underlying social and economic fragility magnifies the consequences of hazard events. Examples include:

  • insurance withdrawal and rising underinsurance
  • household debt and inability to recover after repeated shocks
  • strained municipal finances
  • political dysfunction and delayed response
  • health-system overload during heat or smoke events
  • labor disruptions, supply-chain breakdowns, and cascading infrastructure failure
  • displacement, migration pressure, and social conflict
  • compounding disasters that strike before recovery from prior events is complete

S(t) is not merely a residual. It is a dynamic amplifier. A society repeatedly struck by
expensive disasters may become more fragile over time, which means later events produce disproportionately larger
damage even if hazard growth is modest.

4. Climate Jerk: The Compression of Impact Timescales

4.1 Why doubling time matters

If climate damages were growing at a constant proportional rate, we could write:

D(t) = D0ekt

Td = ln(2) / k

But the socio-ecological system described above implies that the effective growth rate k is
itself changing through time. Hazard forcing intensifies, exposure accumulates, protection struggles to keep pace,
and stress amplification rises. The relevant quantity is therefore the effective growth constant:

keff(t) = d/dt ln D(t)

Td(t) = ln(2) / keff(t)

The central empirical question is not simply whether climate damages are increasing. It is whether the
characteristic timescale of their increase is shrinking.

4.2 Defining climate jerk

In classical mechanics, jerk is the time derivative of acceleration. Translating that intuition into climate
socio-ecological dynamics, we define climate jerk as the tendency for the acceleration of
realized climate damages to increase over time because the system generating those damages is becoming more
strongly coupled and more fragile.

In practical terms, climate jerk is visible when:

  • major impact indicators begin doubling faster than they did in prior eras
  • damages rise faster than physical hazard trends alone would suggest
  • repeated shocks produce larger secondary and tertiary losses
  • the lag between hazard intensification and social disruption shortens
  • adaptation capacity falls progressively behind the combined growth of hazard, exposure, and stress

Climate jerk is therefore not a claim that every climate variable follows a smooth higher-order derivative. It is
a systems-level descriptor of accelerating impact dynamics.

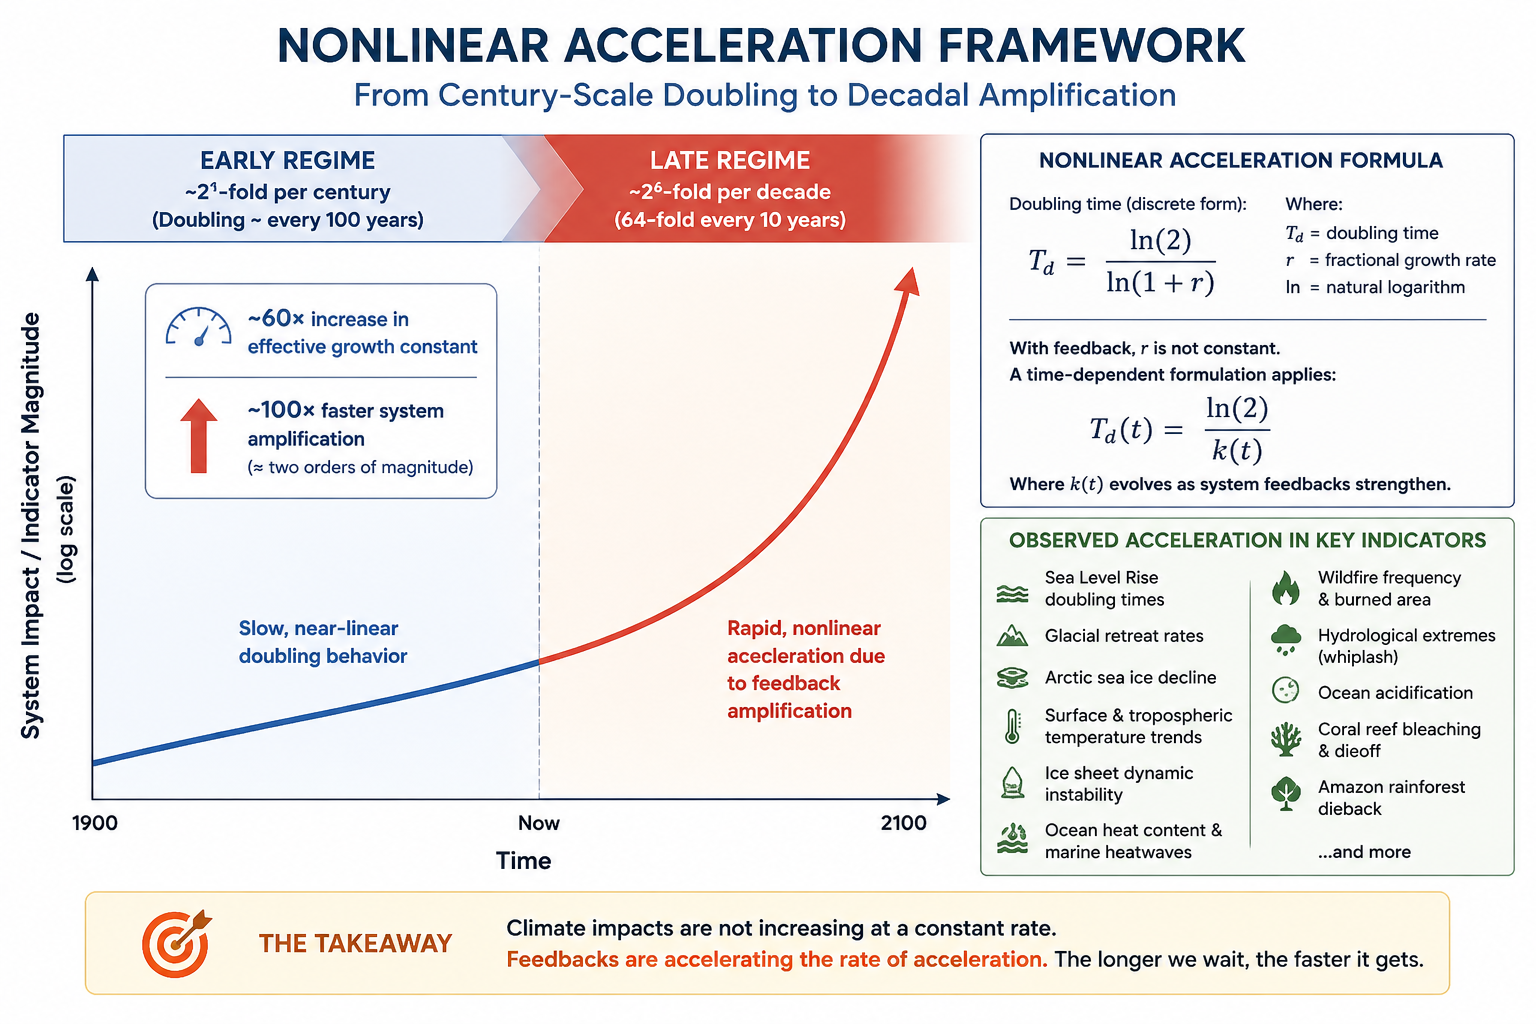
5. Compression of Climate Impact Doubling Times Since 1890

5.1 A historical interpretation

Under the coupled framework, the long-run history of climate damages can be understood as a sequence of regimes:

Regime I: Low-coupling industrial climate risk (late 19th century to mid-20th century)

Hazards were increasing more slowly, exposed capital stocks were smaller, urban systems were less dense, and
although governance was often weak, the absolute scale of climate-linked losses relative to total societal
complexity was lower. Effective doubling times for aggregate climate damages were likely on the order of a century.

Regime II: Great acceleration and expanding exposure (mid-20th century to late 20th century)

Rapid urbanization, suburbanization, industrial growth, coastal development, and asset concentration increased
exposure dramatically. Hazards intensified in a warming world, but damages rose faster than hazards because the
target system grew denser and more expensive. Effective doubling times shortened substantially.

Regime III: Nonlinear coupled disruption (late 20th century to present)

In the contemporary era, exposure is deeply concentrated, infrastructure is highly interdependent, insured and
uninsured losses are enormous, adaptation is uneven, and repeated shocks feed social and economic fragility. The
result is a further compression in effective doubling times, with many impact indicators now behaving on decadal
rather than multi-decadal or century-scale horizons.

5.2 Approximate compression estimates

A conceptual reconstruction consistent with the coupled-system interpretation is:

Period Character of system Approximate effective doubling time of major climate-impact indicators
1890–1950 weakly coupled hazard-exposure system 100–120 years
1950–1990 accelerating exposure and hazard interaction 40–60 years
1990–2010 strongly coupled damage growth 20–30 years
2010–present nonlinear socio-ecological amplification regime 8–15 years

This implies that the effective doubling time of climate impact indicators has compressed by roughly
an order of magnitude since the late nineteenth century.

If the characteristic impact doubling time was approximately 110 years in the early industrial period and is now
on the order of 10–12 years, then the compression factor is approximately:

110 / 11 ≈ 10

This is the core result of the framework:

The characteristic doubling time of climate impact indicators has compressed by roughly 10× since 1890.

6. Why the Compression Occurs

6.1 Hazard forcing is striking a larger target

The term H(t)E(t) makes clear that damage growth is not proportional to hazard growth alone.
Even if hazard forcing were rising “only” steadily, the multiplication by rapidly expanding exposure would
accelerate realized losses.

6.2 Protection does not scale linearly with risk

Protection and adaptation do matter, but they often scale too slowly. Infrastructure upgrades, governance reform,
managed retreat, insurance restructuring, and social resilience investments are expensive, politically difficult,
and slow to implement. As a result, P(t) often grows more slowly than the combined growth of
H(t), E(t), and S(t).

6.3 Stress amplification turns disasters into systemic crises

The rise of S(t) explains why losses can accelerate faster than the hazard itself. When repeated
events weaken fiscal capacity, drive insurance retreat, deepen inequality, or overload emergency systems, the
system becomes more damage-sensitive. This means that each new event lands on a more fragile base.

6.4 Repeated shocks reduce recovery time

One of the defining features of the present regime is that new shocks increasingly arrive before recovery from
previous shocks is complete. This creates overlap between disasters, transforming what once would have been
isolated losses into rolling crises. In such a system, adaptation capacity is not merely insufficient; it is
continuously eroded by the cadence of events.

7. Implications for Climate Risk Assessment

7.1 Hazard-only projections may systematically understate future damages

If impact projections are anchored primarily to hazard trends, they may fail to capture the additional
acceleration generated by rising exposure and socio-economic fragility. This can lead to persistent
underestimation of flood losses, wildfire costs, heat mortality, migration pressures, and infrastructure
disruption.

7.2 Adaptation must be evaluated as a dynamic race, not a static buffer

In a coupled system, adaptation is not a one-time adjustment. It is an ongoing contest between the growth of
H(t)E(t) + S(t) and the ability of P(t) to keep pace. If protection lags, the
system can transition into a regime where damages accelerate despite nominal adaptation spending.

7.3 Insurance and finance become climate sensors

Insurance withdrawal, premium escalation, municipal credit stress, and repeated reconstruction costs are not
peripheral phenomena. They are indicators that S(t) is rising and that the socio-economic system
is amplifying climate damages faster than conventional models anticipate.

7.4 Climate policy must target the whole damage function

Mitigation remains essential because it constrains H(t) at the source. But adaptation policy must
also reduce exposure and fragility directly: retreat from high-risk zones, resilient infrastructure, public-health
strengthening, emergency governance, and economic systems capable of absorbing repeated shocks.

8. Methodological Implications

The framework presented here is intentionally synthetic. It is designed to reorganize how climate impacts are
interpreted rather than to claim a single universal calibrated model. Its value lies in the fact that it aligns
the analytical unit with the observed phenomenon. The object of concern is not hazard in isolation, but
realized socio-ecological damage.

Future work should therefore focus on:

  1. constructing empirical proxies for H(t), E(t), P(t), and S(t) across regions and sectors
  2. testing whether climate-loss indicators exhibit systematic shortening of effective doubling times
  3. identifying thresholds where protection saturation causes abrupt upward shifts in damage trajectories
  4. integrating climate-jerk metrics into adaptation planning, insurance modeling, and fiscal risk analysis
  5. evaluating whether certain regions are entering high-S(t) regimes where socio-economic fragility dominates hazard growth as the driver of realized losses

This framework is compatible with formal econometric, catastrophe-modeling, and systems-dynamics approaches. It
is not intended to replace them, but to provide a more realistic conceptual architecture for their integration.

9. Discussion

The language of climate change has long been dominated by warming trajectories, emissions scenarios, and physical
thresholds. Those remain indispensable. Yet the lived reality of climate change is increasingly a reality of
damage acceleration: faster-rising losses, faster-rising recovery costs, faster-rising insurance
stress, faster-rising displacement, and faster-rising governance overload.

A hazard-centric perspective struggles to explain why the social damage function can steepen so dramatically in
advance of any single “catastrophic” physical threshold. The coupled framework developed here explains that
steepening as the emergent product of hazard intensification, expanding exposure, lagging protection, and rising
socio-economic stress. The result is not simply more damage, but a compression in the timescale of damage
growth
.

This is why climate change can feel discontinuous even when some physical trends remain gradual. The discontinuity
lies not only in the hazard, but in the system it encounters. As the socio-ecological architecture of modern
civilization becomes more concentrated, more interconnected, more indebted, and more politically strained, the
same increment of physical warming can produce disproportionately larger social consequences.

The concept of climate jerk offers a language for that transition. It identifies the shift from a world in which
climate damages rise slowly enough to be treated as background risk, to a world in which damages accelerate
quickly enough to destabilize the institutions, markets, and governance systems meant to manage them.

10. Conclusion

Climate damages should no longer be modeled primarily as a direct and stable function of physical hazard forcing.
They are better understood as the emergent output of a non-stationary socio-ecological system:

D(t) = H(t)E(t) − P(t) + S(t)

In this framework, hazards matter enormously, but they do not act alone. They act upon a civilization
characterized by rapidly changing exposure, uneven adaptation, and mounting socio-economic fragility. The
resulting damage dynamics are nonlinear and increasingly compressed in time.

The key observable consequence is a shortening of the effective doubling times of climate impact indicators—from
roughly century-scale behavior in the late nineteenth and early twentieth centuries to decadal-scale behavior in
the present era. This order-of-magnitude contraction in impact timescales is the signature of what we call
climate jerk: the acceleration of the acceleration of realized climate damages in a coupled
socio-ecological system.

Recognizing climate jerk matters because it changes the policy problem. The challenge is not merely to reduce
emissions or to defend against isolated hazards. It is to manage a rapidly accelerating damage system in which
physical climate forcing, exposure, adaptation limits, and social fragility interact. In that system, delay is
not neutral. Delay allows the timescale of impacts to compress further, making future adaptation more expensive,
more difficult, and in some cases structurally impossible.

Suggested Figures

Figure 1.

Conceptual diagram of the coupled framework

D(t) = H(t)E(t) − P(t) + S(t)

with arrows showing hazard forcing and exposure multiplying damages, protection damping them, and socio-economic
stress amplifying them.

Figure 2.

Compression of effective doubling times for climate impact indicators, 1890–present

A curve or stepped bar chart showing the shift from ~100–120 years to ~8–15 years.

Figure 3.

Hazard-only model vs. coupled socio-ecological model

  • Panel A: D(t) ≈ f(H)
  • Panel B: D(t) = H(t)E(t) − P(t) + S(t) with nonlinear acceleration

Figure 4.

Climate jerk schematic

A graph showing hazard growth, impact growth, and the rising effective growth constant
keff(t), highlighting the shrinking doubling time
Td(t).

Short Author Summary

We argue that climate damages are not determined by hazards alone. They arise from the interaction of physical
extremes with exposure, adaptation capacity, and social fragility. Using the framework
D(t) = H(t)E(t) − P(t) + S(t), we show how the effective doubling time of climate impacts can
compress from century-scale behavior to decadal-scale behavior. We describe this shortening of impact timescales
as climate jerk: the increasing acceleration of realized climate damages in a coupled
socio-ecological system.
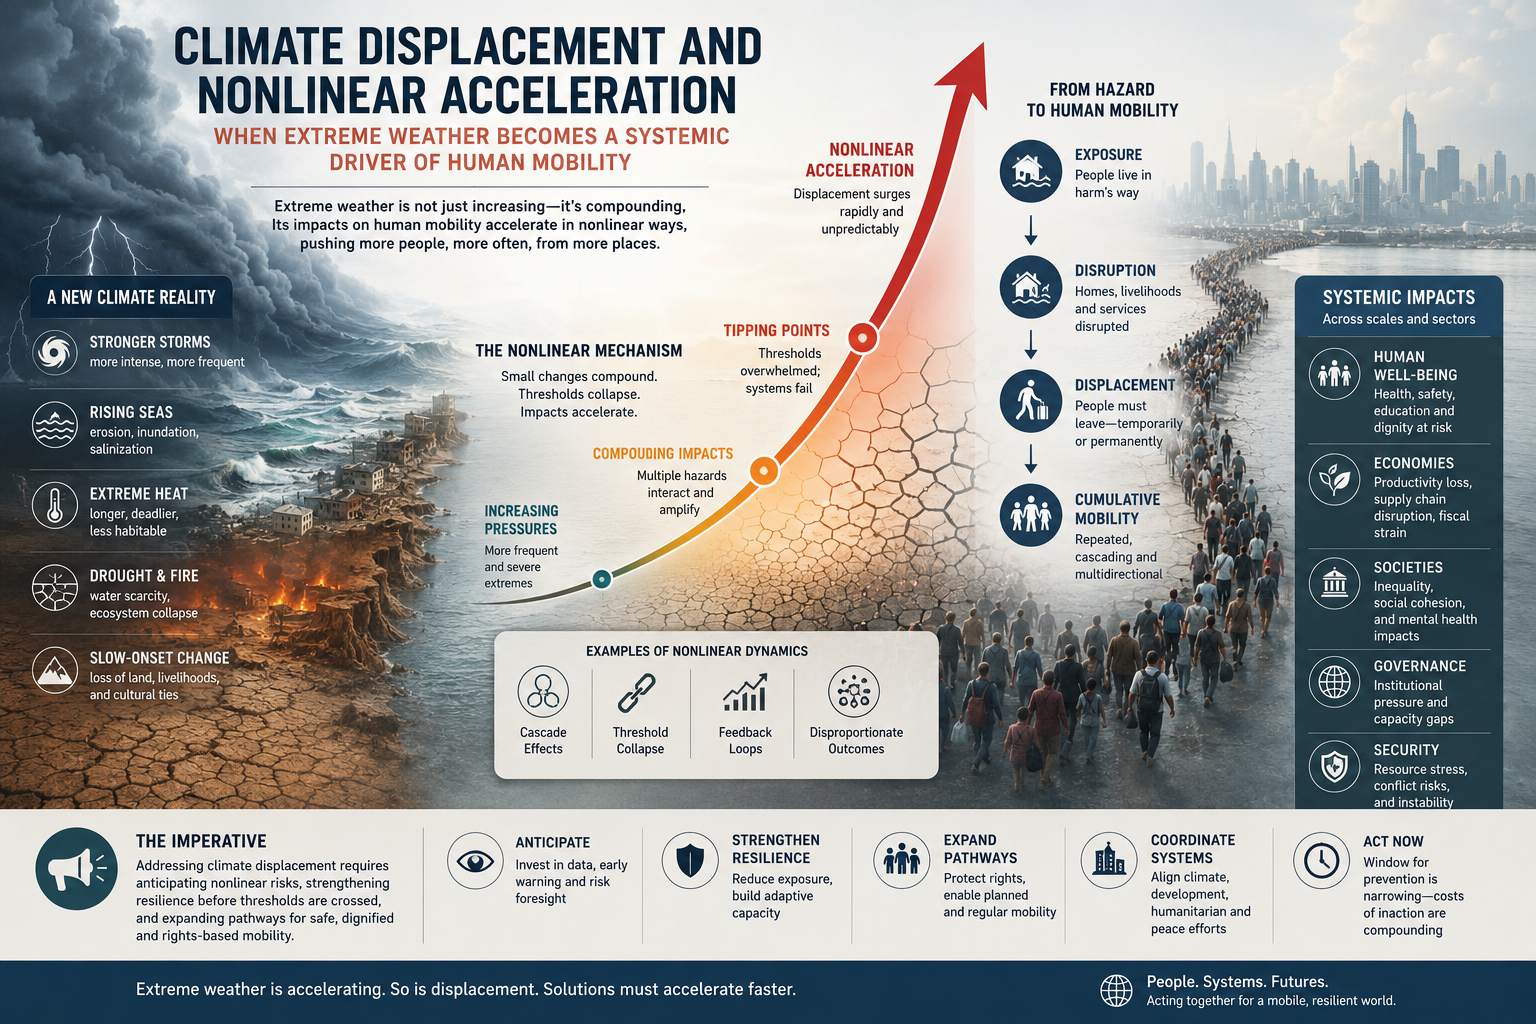
bookmark_borderClimate Displacement and Nonlinear Acceleration: When Extreme Weather Becomes a Systemic Driver of Human Mobility

By Daniel Brouse and Sidd Mukherjee

Abstract

Climate displacement is often framed as a humanitarian consequence of storms, floods, droughts, wildfires, and sea-level rise. That framing is correct but incomplete. The deeper problem is that climate displacement is increasingly emerging from a nonlinear Earth system in which multiple climate hazards are intensifying simultaneously and interacting with preexisting social, political, economic, and infrastructural vulnerabilities.

Recent displacement data suggest that the world may be entering a new phase of climate-driven mobility. According to the Internal Displacement Monitoring Centre (IDMC), 13.6 million people were living in internal displacement because of disasters at the end of 2025, up sharply from roughly 9.9 million at the end of 2024. At the same time, 82.2 million people worldwide were living away from their home communities because of conflict, violence, or disasters, the second-highest figure ever recorded. These numbers do not merely reflect isolated weather events. They reflect a world in which climatic shocks are becoming more frequent, more intense, and increasingly entangled with food insecurity, weak infrastructure, repeated recovery failures, and declining social resilience.

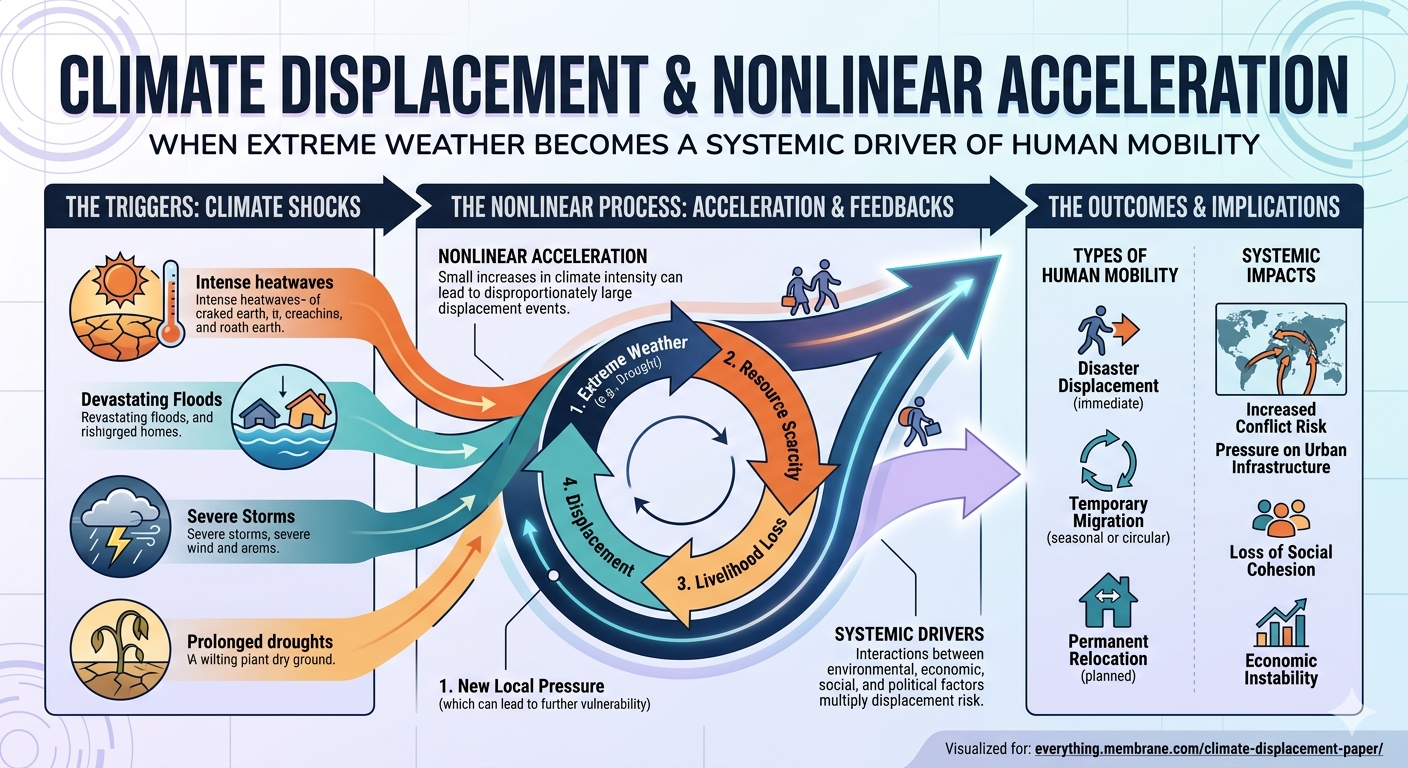
This paper argues that climate displacement should be understood not as a linear byproduct of warming, but as a nonlinear acceleration problem. As the climate system warms, extreme events do not simply increase in number; they increasingly interact across sectors and timescales. Drought is followed by flood. Heat is followed by crop failure. Wildfire is followed by erosion and debris flows. Sea-level rise magnifies storm surge. Water scarcity amplifies political instability. The result is not a single hazard but a cascade of hazards capable of overwhelming adaptation systems and forcing repeated human movement. In that sense, displacement is one of the clearest social indicators that climate change is no longer acting as a distant environmental stressor. It is becoming a systemic destabilizer.

1. Introduction: Displacement as a Climate-System Signal

Most climate discussions still treat displacement as a downstream consequence of weather disasters. A cyclone strikes, homes are destroyed, and people flee. A flood submerges cropland, and communities relocate. A drought persists, livelihoods collapse, and migration follows.

That sequence is real, but it understates the scale of what is now occurring.

Displacement is increasingly best understood as a systems-level indicator. It measures not only the physical impact of a storm, flood, drought, wildfire, or heatwave, but also the failure of social and ecological buffers that once absorbed those shocks. When households are forced to move, it means a threshold has been crossed: infrastructure failed, livelihoods failed, food systems failed, water systems failed, governance failed, or some combination of the above failed at once.

The 2026 Global Report on Internal Displacement provides a stark snapshot of this process. By the end of 2025, 82.2 million people were living in internal displacement across 104 countries and territories. Of those, 68.6 million were displaced by conflict and violence and 13.6 million by disasters. The global total remained near historic highs, while the stock of people displaced by disasters rose sharply. Meanwhile, IDMC recorded 65.8 million internal displacements during 2025, including disaster- and conflict-related movements, underscoring the scale of repeated uprooting in a single year.

The central question is not simply how many people are displaced by climate-related disasters in a given year. The more important question is whether the underlying drivers of displacement are themselves accelerating nonlinearly.

2. The Data: A Sharp Rise in Disaster Displacement

According to IDMC, nearly 13.6 million people were still living in internal displacement at the end of 2025 because of disasters, compared with roughly 9.9 million at the end of 2024. That is an increase of about 3.7 million people in a single year, or approximately 37–38 percent.

This matters for two reasons.

First, it suggests that the consequences of disasters are becoming more persistent. Many people are not simply evacuating and returning home after a storm. They are remaining displaced for longer periods because homes, farmland, water systems, roads, and local economies are not recovering quickly enough.

Second, it highlights the difference between flows and stocks in displacement analysis. IDMC distinguishes between:

  • internal displacements: the number of forced movements recorded during a year, including repeated movements by the same person; and
  • internally displaced people (IDPs): the number of people still living in displacement at a given point in time, usually at the end of the year.

This distinction is crucial in a nonlinear climate context. A single extreme event can trigger a large flow of short-term displacements, but a system under sustained stress generates something more dangerous: a rising stock of people who remain uprooted because return, recovery, and resettlement become progressively harder.

That is the deeper warning embedded in the recent numbers.

3. From Linear Hazard to Nonlinear Displacement

A linear view of climate displacement assumes a relatively simple chain of causation:

warming → more extreme weather → more damage → more displacement

But the real system increasingly looks more like this:

warming → hydrologic intensification → drought/flood volatility → crop loss + infrastructure damage + water insecurity + economic stress + conflict risk → repeated displacement → prolonged displacement → social destabilization

In other words, displacement is not driven by one variable. It emerges from coupled feedbacks.

3.1 Hydrologic whiplash

One of the clearest nonlinear pathways is hydrologic whiplash—the growing tendency for regions to swing rapidly between drought and flood. A warmer atmosphere increases evaporation, drying soils and intensifying drought. At the same time, warmer air holds more water vapor, increasing the likelihood of extreme rainfall when storms do occur. The result is not simply “more drought” or “more flooding,” but a destabilizing oscillation between the two.

For vulnerable populations, this matters enormously. Drought can destroy crops, livestock, and local water supplies. Flooding can then destroy the roads, bridges, homes, sanitation systems, and clinics needed for recovery. The second disaster lands before recovery from the first is complete. Communities are not merely hit harder; they are hit before they have time to recover. That is a nonlinear displacement engine.

3.2 Repeated displacement

Climate displacement is often not a one-time movement. A household may flee a floodplain, return months later, then flee again during the next storm season, then relocate after drought destroys agricultural income, then move again after conflict or price shocks intensify. The same family can be counted multiple times in annual displacement flows, but the deeper reality is repeated social dislocation.

Repeated displacement erodes savings, fragments families, interrupts schooling, worsens health outcomes, and depletes community resilience. Over time, it converts temporary mobility into chronic instability.

3.3 Coupled climate-conflict systems

Climate displacement and conflict displacement are not cleanly separable in the real world. Drought can weaken agriculture. Flooding can destroy infrastructure. Food insecurity and water stress can intensify social instability. In fragile settings, those pressures can contribute to violence and forced movement. The categories may differ administratively; the systems do not.

4. Nonlinear Acceleration and Threshold Behavior

The central argument of this paper is that climate displacement is increasingly governed by threshold behavior rather than smooth linear change.

A household can often absorb one bad harvest.
A town can sometimes recover from one flood.
A region may survive one year of drought.

But nonlinear systems change character when repeated shocks arrive faster than recovery can occur. Once adaptation capacity is exceeded, the response is no longer incremental. It becomes discontinuous.

A few examples illustrate this threshold logic:

  • Water threshold: A city or agricultural basin can function under water stress up to a point. Once aquifers collapse, reservoirs fail, or snowpack loss undermines irrigation, displacement risk rises abruptly rather than gradually.
  • Food threshold: Households can absorb modest food-price increases or crop losses. But once food insecurity becomes chronic, migration becomes a survival strategy.
  • Infrastructure threshold: A road washed out once is a repair problem. Roads, bridges, ports, and power systems repeatedly damaged by extreme weather become a regional collapse problem.
  • Livelihood threshold: Smallholder farmers can survive a poor season. They cannot survive repeated crop failures, rising heat stress, declining water availability, and fertilizer or fuel price shocks indefinitely.

The importance of thresholds is that they help explain why displacement can rise sharply even if average warming appears gradual. The forcing may be smooth; the social response is not.

5. Doubling-Time Compression in Climate Displacement

Based on the currently cited modern displacement record, climate/disaster displacement appears to be entering a phase of rapid compression in effective doubling times.

Using the year-end stock of people displaced by disasters:

  • 2024: ~9.9 million
  • 2025: 13.6 million

The one-year growth factor is:

g = 13.6 / 9.9 ≈ 1.374

The implied doubling time is:

T_d = ln(2) / ln(13.6 / 9.9)

Substituting the observed values:

T_d ≈ 0.6931 / 0.3178 ≈ 2.18 years

In other words, the latest year-over-year increase implies an effective doubling time of roughly 2.2 years.

This does not mean climate displacement will literally double every 2.2 years in a stable exponential fashion. One year does not establish a long-run law of motion. But it does signal that displacement may be entering a regime in which recovery times are being compressed faster than adaptation systems can respond.

That distinction matters. The significance of the calculation is not that it proves a permanent exponential trend. The significance is that it reveals how quickly displacement pressure can rise once multiple hazards, infrastructure losses, and repeated recovery failures begin interacting in the same period.

In a linear system, displacement might rise gradually as climate hazards intensify. In a nonlinear system, displacement can remain manageable for a time and then surge when thresholds are crossed. The recent IDMC numbers suggest the latter risk is becoming more plausible.

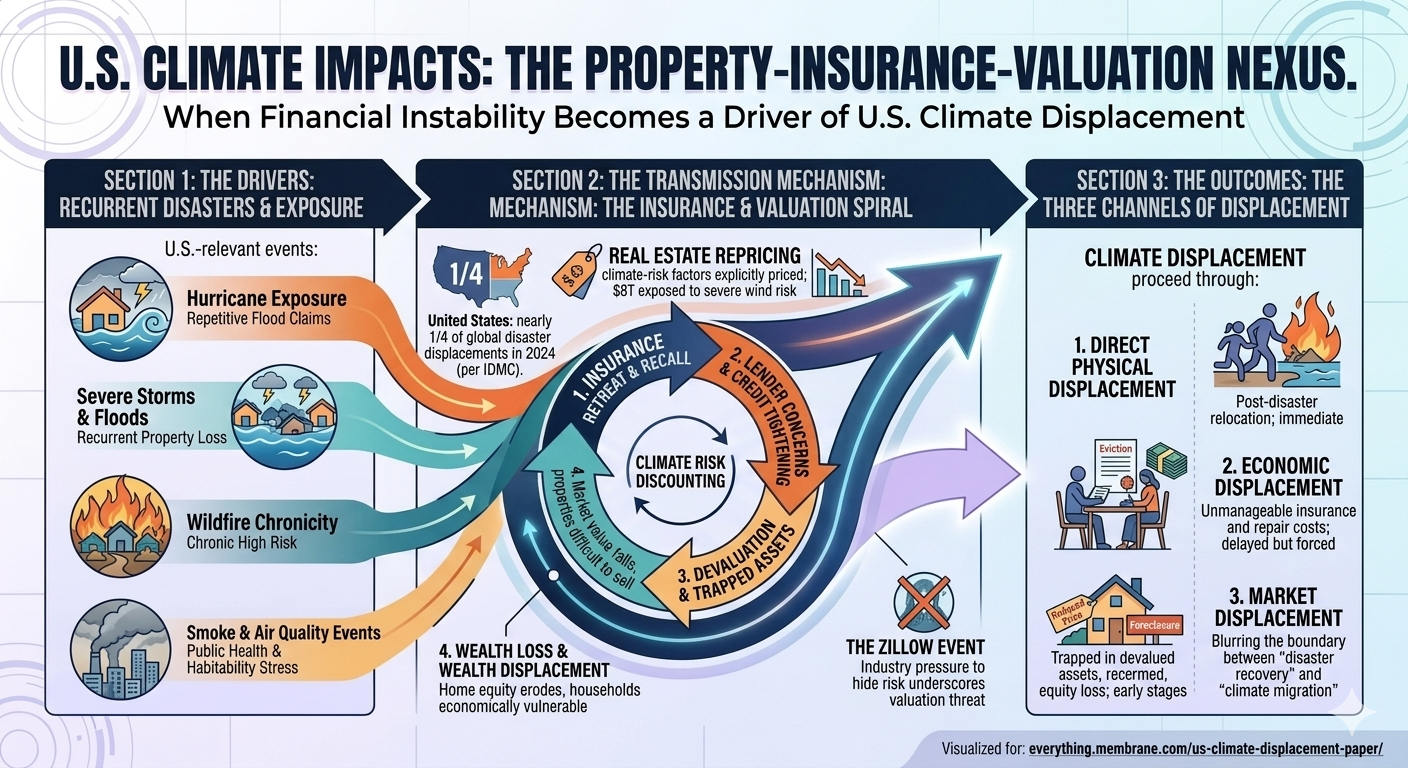
6. U.S. Impacts: Property Loss, Real Estate Values, and Insurance Stress

Climate displacement is often framed as a problem of distant coastlines, small island states, or conflict-prone regions in the Global South. That framing is increasingly obsolete. Climate displacement is already affecting the United States through property loss, real estate repricing, insurance instability, and internal migration pressures.

6.1 Property loss and recurrent disaster exposure

The United States has experienced repeated waves of large-scale disaster displacement from hurricanes, floods, wildfires, severe storms, and smoke-related emergencies. IDMC reported that the United States accounted for nearly one-quarter of all disaster displacements globally in 2024, driven by severe floods and storms.

What matters economically is not only the immediate property damage, but the way repeated exposure changes the viability of living in certain regions. Once homes flood multiple times, or wildfire risk becomes chronic, the relevant question is no longer just repair cost. It becomes whether the property remains insurable, financeable, and marketable.

6.2 Real estate repricing and climate-risk discounting

Climate risk is increasingly being priced into housing markets, though unevenly and often belatedly. Realtor.com analysis cited by Axios found that nearly 20 percent of U.S. homes—worth about $8 trillion—face severe or extreme hurricane wind risk, illustrating the scale of housing-market exposure.

Private climate-risk firms such as First Street have argued that rising insurance costs and underpriced climate risk could drive substantial housing-value losses over coming decades. The controversy surrounding Zillow’s 2025 removal of embedded climate-risk scores from property listings is revealing. Zillow had integrated climate-risk data for floods, wildfire, wind, heat, and air quality, but removed those ratings after industry complaints that they were hurting sales. The episode matters because it shows that climate risk is not only a physical threat but a valuation threat. Once buyers, lenders, and insurers begin to price hazard exposure more explicitly, some properties will lose value not because they are uninhabitable today, but because the market increasingly recognizes that they may become financially fragile tomorrow.

6.3 Insurance retreat as a displacement mechanism

Insurance may become one of the most important near-term transmission mechanisms linking climate change to displacement in the United States. A home does not need to be destroyed to become effectively displaced from the market. If premiums become unaffordable, deductibles become unmanageable, or insurers withdraw from a region entirely, households can be forced to move even before a catastrophic event occurs.

This creates a new category of climate displacement: financial displacement driven by insurability collapse.

In that sense, climate displacement in the United States may increasingly proceed through three channels:

  1. direct physical displacement after storms, fires, floods, or heat-related infrastructure failures;
  2. economic displacement as repeated damage, maintenance costs, and insurance premiums overwhelm household budgets; and
  3. market displacement as property values fall and homeowners become trapped in devalued or difficult-to-sell assets.

These dynamics blur the boundary between “disaster recovery” and “climate migration.” A family may still occupy the same home today while already experiencing the early stages of displacement through rising insurance costs, declining home equity, and a shrinking set of exit options.

7. Mental Health, Social Stress, and Climate Policy Feedbacks

Climate displacement is not only a housing or migration problem. It is also a mental-health and socio-economic destabilization problem with direct implications for climate politics and public policy.

Extreme weather exposure, chronic climate disruption, and perceived governmental inaction are increasingly associated with post-traumatic stress disorder (PTSD), depression, anxiety, grief, chronic stress, and climate-related distress. The psychological burden is not limited to those who lose homes outright. It extends to people living under repeated evacuation orders, communities facing chronic smoke or heat exposure, farmers confronting repeated crop losses, and households watching insurance premiums, utility bills, and rebuilding costs climb year after year.

7.1 Trauma after extreme events

Disaster research has long shown elevated rates of PTSD, depression, and anxiety following hurricanes, floods, wildfires, and prolonged displacement. Climate change amplifies this burden by increasing the frequency of events and by reducing the time available for psychological recovery between them. A household displaced once by a flood may eventually recover. A household displaced by a flood, then smoke, then heat, then another flood enters a very different mental-health regime.

The cumulative burden matters because trauma is not merely an individual health outcome. It affects work capacity, school performance, family stability, substance use, physical health, and community cohesion.

7.2 Chronic disruption and “pre-traumatic” stress

Climate-related mental-health impacts are not limited to post-disaster trauma. Chronic exposure to climate risk can generate persistent anxiety even before a disaster occurs. People living in high-risk regions may experience what is increasingly described as anticipatory or pre-traumatic stress: the psychological strain of knowing that another wildfire season, another hurricane, or another flood is coming, while also suspecting that public institutions are unprepared to protect them.

This can produce a form of climate dread with economic teeth. Families delay investment. Young adults reconsider where to live or whether to have children. Retirees reassess whether fixed incomes can survive escalating insurance and utility costs. Farmers and small businesses become less willing to invest in long-lived assets. In that sense, mental-health stress feeds back into economic behavior and local resilience.

7.3 Perceived governmental inaction and policy instability

Perceived governmental inaction is itself a destabilizing variable. When people repeatedly experience disasters, property loss, insurance shocks, or displacement while seeing little meaningful adaptation, planning, or support, trust in institutions erodes. That erosion can produce several policy effects at once:

  • political polarization, as climate impacts become refracted through grievance and distrust;
  • policy whiplash, as short-term emergency spending substitutes for long-term adaptation planning;
  • maladaptation, where communities rebuild into high-risk zones because retreat, relocation, and buyout programs remain politically or financially inaccessible;
  • social fragmentation, as households with resources leave while lower-income residents remain exposed to escalating risk.

These are not side effects. They are part of the climate-displacement system itself. A society experiencing repeated disasters without credible adaptation pathways may become less capable of implementing coherent climate policy precisely because the social stress of climate disruption is eroding the institutional capacity required to respond.

8. Climate Displacement as an Indicator of Systemic Instability

Climate displacement should therefore be viewed not merely as a humanitarian outcome but as a diagnostic signal of Earth-system destabilization interacting with human vulnerability.

In the same way that ocean heat content reveals accumulating thermal energy in the climate system, displacement reveals accumulating social stress in human systems. It tells us that environmental shocks are no longer being absorbed locally. They are crossing thresholds and reorganizing human geography.

Seen this way, displacement is one of the clearest real-world indicators that climate change is moving beyond “environmental change” and into civilizational risk.

When millions of people are forced to move because water disappears, crops fail, coasts flood, storms intensify, and recovery systems collapse, the issue is no longer whether the climate is changing. The issue is whether the political, economic, and humanitarian systems built for the twentieth century can withstand the pace and nonlinearity of twenty-first century climate disruption.

9. Conclusion

The latest displacement data should not be read as isolated humanitarian statistics. They should be read as evidence that climate change is increasingly acting through nonlinear social pathways.

The rise in disaster-related internal displacement from roughly 9.9 million to 13.6 million in a single year does not, by itself, prove a permanent exponential trajectory. But it does imply an effective short-term doubling time of about 2.2 years, a warning that climate displacement may be entering a phase of rapid compression in recovery times and rising systemic instability.

In a linear world, displacement would rise gradually as hazards gradually intensified.

In the world we are actually entering, climate forcing interacts with thresholds, feedbacks, and repeated shocks. Drought is followed by flood. Recovery is interrupted by the next disaster. Conflict overlays crop failure. Property values fall as risk becomes visible. Insurance costs become a displacement mechanism of their own. Trauma, anxiety, and distrust weaken the very institutions needed to adapt.

Climate displacement is therefore not merely one consequence of warming. It is one of the clearest manifestations of nonlinear acceleration in the human dimensions of climate change.

The real question is no longer whether climate change will displace people. It already is.

The real question is how many social, economic, and political thresholds will be crossed before the world recognizes that displacement is not a side story to climate change.

It is one of its central outcomes.

References

1. Climate displacement, internal displacement, and disaster mobility

Internal Displacement Monitoring Centre. (2025). Global report on internal displacement 2025 (GRID 2025). Geneva, Switzerland: IDMC. https://www.internal-displacement.org/global-report/grid2025/

Internal Displacement Monitoring Centre. (2026). 2026 global report on internal displacement (GRID 2026). Geneva, Switzerland: IDMC. https://www.internal-displacement.org/publications/2026-global-report-on-internal-displacement-grid/

Internal Displacement Monitoring Centre. (2026). Global report on internal displacement 2026 overview and data portal. https://www.internal-displacement.org/global-report/grid2026/

Internal Displacement Monitoring Centre. (n.d.). Global report on internal displacement (annual series). https://www.internal-displacement.org/global-report/

Internal Displacement Monitoring Centre. (2026). Global report on internal displacement 2026 [PDF]. https://api.internal-displacement.org/sites/default/files/2026-05/IDMC-GRID-2026-Global-Report-on-Internal-Displacement.pdf

United Nations High Commissioner for Refugees. (2026, June 11). UNHCR says fewer people displaced worldwide in 2025 but long-term refugee crisis persists. Reuters. https://www.reuters.com/world/unhcr-says-fewer-people-displaced-worldwide-2025-long-term-refugee-crisis-2026-06-11/

Pietrostefani, E., Mason, M., Iradukunda, R., Tran-Jones, H., Loktieva, I., & Rowe, F. (2025). Dynamic estimates of displacement in disaster regions: A policy-driven framework triangulating data. arXiv. https://arxiv.org/abs/2511.01955

Idzalika, R., Muztahid, M. R., & Prasojo, R. E. (2026). Context-aware displacement estimation from mobile phone data: A methodological framework. arXiv. https://arxiv.org/abs/2604.21457


2. Climate migration, human mobility, and climate vulnerability framing

Intergovernmental Panel on Climate Change. (2022). Climate change 2022: Impacts, adaptation and vulnerability. Contribution of Working Group II to the Sixth Assessment Report of the Intergovernmental Panel on Climate Change. Cambridge University Press.

Intergovernmental Panel on Climate Change. (2021). Climate change 2021: The physical science basis. Contribution of Working Group I to the Sixth Assessment Report of the Intergovernmental Panel on Climate Change. Cambridge University Press.

World Bank. (2021). Groundswell Part 2: Acting on internal climate migration. Washington, DC: World Bank.

Black, R., Bennett, S. R. G., Thomas, S. M., & Beddington, J. R. (2011). Migration as adaptation. Nature, 478(7370), 447–449.

McLeman, R. A. (2014). Climate and human migration: Past experiences, future challenges. Cambridge University Press.

Adger, W. N., de Campos, R. S., Siddiqui, T., et al. (2020). Migration, displacement and mobility. In Climate change 2022: Impacts, adaptation and vulnerability (IPCC WGII chapter).


3. Nonlinear acceleration, compound climate extremes, and hydrologic whiplash

Chun, K. P., Octavianti, T., Papacharalampous, G., Tyralis, H., Sutanto, S. J., Terskii, P., Mazzoglio, P., Treppiedi, D., Rivera, J., Dogulu, N., Olusola, A., Dieppois, B., Dembélé, M., Moulds, S., Li, C., Morales-Marin, L. A., Macdonald, N., Amoussou, T. O., Yonaba, R., Obahoundje, S., Hannah, D. M., Chidepudi, S. K. R., & Hamududu, B. (2024). Unravelling compound risks of hydrological extremes in a changing climate: Typology, methods and futures. arXiv. https://arxiv.org/abs/2409.19003

Green, J., Haigh, I. D., Quinn, N., Neal, J., Wahl, T., Wood, M., Eilander, D., de Ruiter, M., Ward, P., & Camus, P. (2024). A comprehensive review of coastal compound flooding literature. arXiv. https://arxiv.org/abs/2404.01321

Kleidon, A. (2024). Droughts in Germany—Why global climate change amplifies hydrological extremes. arXiv. https://arxiv.org/abs/2403.16551

Murphy-Barltrop, C. J. R., Richards, J., Poschlod, B., Sasse, A., & Zscheischler, J. (2026). Exploring climate change effects on concurrent floods and concurrent droughts via statistical deep learning. arXiv. https://arxiv.org/abs/2604.21647

He, Y., et al. (2026, June 17). Rising temperatures may increase flood risk through river “whiplash,” study finds. The Guardian. https://www.theguardian.com/environment/2026/jun/17/rising-temperatures-may-increase-flood-risk-through-river-whiplash-study-finds

Zscheischler, J., Westra, S., van den Hurk, B. J. J. M., et al. (2018). Future climate risk from compound events. Nature Climate Change, 8, 469–477.

Ridder, N. N., Ukkola, A. M., Pitman, A. J., et al. (2022). Increased occurrence of high-impact compound events under climate change. Nature Climate Change, 12, 600–606.

Swain, D. L., et al. (2018). Increasing precipitation volatility in a warming climate. Nature Climate Change, 8, 427–433.

Touma, D., Stevenson, S., Camargo, S. J., Horton, D. E., & Diffenbaugh, N. S. (2022). Climate change increases risk of extreme rainfall following drought. Science Advances, 8(32), eabn6301.


4. Climate displacement as nonlinear acceleration / doubling-time compression

Brouse, D., & Mukherjee, S. (2026). Climate displacement and nonlinear acceleration: When extreme weather becomes a systemic driver of human mobility. [Working paper / manuscript].

Brouse, D., & Mukherjee, S. (2026). Emergent climate dynamics: The nonlinear acceleration of climate impacts. [Manuscript].

Brouse, D., & Mukherjee, S. (2026). A unified energetics framework for nonlinear climate acceleration. [Manuscript].

Brouse, D., & Mukherjee, S. (2025). Runaway climate feedbacks and systemic collapse. [Manuscript].


5. U.S. property loss, housing-market repricing, and insurance retreat

Bernstein, A., Gustafson, M. T., & Lewis, R. (2019). Disaster on the horizon: The price effect of sea level rise. Journal of Financial Economics, 134(2), 253–272.

Bakkensen, L. A., & Barrage, L. (2021). Flood risk beliefs and coastal home price dynamics. Review of Financial Studies, 34(10), 1–41.
(Use whichever final journal version you have access to; there are several closely related working-paper/journal versions in this literature.)

Keys, B. J., Mulder, P., & Vissing-Jorgensen, A. (2024). Climate risk and the U.S. housing market. Annual Review of Financial Economics / working paper literature as applicable.

Keenan, J. M., Hill, T., & Gumber, A. (2018). Climate gentrification: From theory to empiricism in Miami-Dade County, Florida. Environmental Research Letters, 13(5), 054001.

First Street Foundation. (2025). Climate risk, mortgage exposure, and U.S. property vulnerability [Risk analysis / research releases]. New York, NY: First Street Foundation.
(Use the specific First Street report or white paper you cite.)

Realtor.com. (2025). Climate-risk exposure in U.S. housing markets [Market analysis / research brief].
(Use the specific report behind the $8 trillion severe or extreme hurricane wind exposure figure if you cite that number.)

Axios. (2025, October 7). Where U.S. homes face the most severe and extreme climate risk. https://www.axios.com/2025/10/07/climate-risk-housing-market-real-estate

The Guardian. (2025, December 1). Zillow deletes climate risk data from listings after complaints it harms sales. https://www.theguardian.com/environment/2025/dec/01/zillow-removes-climate-risk-data-home-listings

The Verge. (2025). Zillow property listings no longer show risk of fires, floods, and storms. https://www.theverge.com/news/834715/zillow-removes-flood-fire-risk-scores-home-listings

Wall Street Journal. (2025). The climate-disaster scores that could make or break your home sale.
(Add exact author/date if you want strict APA completeness.)

Washington Post. (2025, December 9). Hurricanes and wildfires influence homebuyers, if only for a minute.
(Add author if available in your final bibliography draft.)


6. Insurance stress, retreat, and financial displacement

Kousky, C. (2019). The role of natural disaster insurance in recovery and risk reduction. Annual Review of Resource Economics, 11, 399–418.

Kousky, C., & Shabman, L. (2016). Flood risk and property values: Examining the role of flood insurance. Natural Hazards Review, 17(3).

Botzen, W. J. W., Deschenes, O., & Sanders, M. (2019). The economic impacts of natural disasters: A review of models and empirical studies. Review of Environmental Economics and Policy, 13(2), 167–188.

Kunreuther, H., & Michel-Kerjan, E. (2011). At war with the weather: Managing large-scale risks in a new era of catastrophes. Cambridge, MA: MIT Press.

First Street Foundation. (2025). Climate risk and insurance affordability in U.S. housing markets.
(Insert the exact report title you use if citing insurer retreat or affordability estimates.)


7. Mental health, PTSD, anxiety, and climate-related distress

Berry, H. L., Bowen, K., & Kjellstrom, T. (2010). Climate change and mental health: A causal pathways framework. International Journal of Public Health, 55(2), 123–132.

Clayton, S., Manning, C., Krygsman, K., & Speiser, M. (2017). Mental health and our changing climate: Impacts, implications, and guidance. Washington, DC: American Psychological Association and ecoAmerica.

Cianconi, P., Betrò, S., & Janiri, L. (2020). The impact of climate change on mental health: A systematic descriptive review. Frontiers in Psychiatry, 11, 74.

Hayes, K., & Poland, B. (2018). Addressing mental health in a changing climate: Incorporating mental health indicators into climate change and health vulnerability and adaptation assessments. International Journal of Environmental Research and Public Health, 15(9), 1806.

Lawrance, E. L., Thompson, R., Newberry Le Vay, J., Page, L., Jennings, N., & McBride, M. (2022). The impact of climate change on mental health and emotional wellbeing: A narrative review of current evidence, and its implications. International Review of Psychiatry, 34(5), 443–498.

Pihkala, P. (2020). Eco-anxiety and environmental education. Sustainability, 12(23), 10149.

Charlson, F., Ali, S., Benmarhnia, T., Pearl, M., Massazza, A., Augustinavicius, J., & Scott, J. G. (2021). Climate change and mental health: A scoping review. International Journal of Environmental Research and Public Health, 18(9), 4486.

Thoma, M. V., et al. (2021). The psychological consequences of climate-related disasters and displacement. Current Psychiatry Reports, 23, 82.
(Use a final journal article that best matches the PTSD/disaster-displacement angle you want.)

Janzen, B. (2022). Temperature and mental health: Evidence from helpline calls. arXiv. https://arxiv.org/abs/2207.04992


8. Disaster trauma, repeated exposure, and post-event psychiatric burden

Goldmann, E., & Galea, S. (2014). Mental health consequences of disasters. Annual Review of Public Health, 35, 169–183.

Neria, Y., Nandi, A., & Galea, S. (2008). Post-traumatic stress disorder following disasters: A systematic review. Psychological Medicine, 38(4), 467–480.

Lowe, S. R., & Galea, S. (2017). The mental health consequences of mass shootings and natural disasters. Current Psychiatry Reports, 19, 64.
(Use selectively if you want repeated-trauma framing across disaster types.)

Vins, H., Bell, J., Saha, S., & Hess, J. J. (2015). The mental health outcomes of drought: A systematic review and causal process diagram. International Journal of Environmental Research and Public Health, 12(10), 13251–13275.

Bryant, R. A. (2019). Post-traumatic stress disorder: A state-of-the-art review of evidence and challenges. World Psychiatry, 18(3), 259–269.
(Useful for grounding the PTSD language in the paper’s mental-health section.)


9. Climate anxiety, anticipatory stress, and perceived governmental inaction

Hickman, C., Marks, E., Pihkala, P., et al. (2021). Climate anxiety in children and young people and their beliefs about government responses to climate change: A global survey. The Lancet Planetary Health, 5(12), e863–e873.

Ojala, M. (2012). Hope and climate change: The importance of hope for environmental engagement among young people. Environmental Education Research, 18(5), 625–642.

Pihkala, P. (2022). Toward a taxonomy of climate emotions. Frontiers in Climate, 3, 738154.

Reser, J. P., Bradley, G. L., & Ellul, M. C. (2014). Encountering climate change: “Seeing” is more than “believing.” WIREs Climate Change, 5(4), 521–537.

Wang, S., Leviston, Z., Hurlstone, M., Lawrence, C., & Walker, I. (2018). Emotions predict policy support: Why it matters how people feel about climate change. Global Environmental Change, 50, 25–40.


10. Climate policy, social destabilization, and governance stress

Adger, W. N., Barnett, J., Brown, K., Marshall, N., & O’Brien, K. (2013). Cultural dimensions of climate change impacts and adaptation. Nature Climate Change, 3, 112–117.

Mach, K. J., Kraan, C. M., Adger, W. N., et al. (2019). Climate as a risk factor for armed conflict. Nature, 571, 193–197.

Abel, G. J., Brottrager, M., Crespo Cuaresma, J., & Muttarak, R. (2019). Climate, conflict and forced migration. Global Environmental Change, 54, 239–249.

Hsiang, S. M., Burke, M., & Miguel, E. (2013). Quantifying the influence of climate on human conflict. Science, 341(6151), 1235367.

Stern, N. (2007). The economics of climate change: The Stern review. Cambridge University Press.


11. Climate-risk communication, valuation, and disclosure in housing markets

Zillow. (2024). Zillow integrates climate-risk data into home listings [Corporate / platform announcement].
(If you use the rollout itself as part of the story, cite the original Zillow announcement or newsroom page.)

First Street Foundation. (2024–2025). Climate risk data for U.S. properties [Methodology and risk score documentation].
(Use the exact methodology page or report behind the risk metrics if cited in the paper.)

San Francisco Chronicle. (2025). Zillow is dropping climate risk scores. Here’s why it matters.
(Add author/date if you use this source in the final paper.)


12. Optional contemporary media sources for very recent 2025–2026 developments

Use these only for contemporary market developments or examples, not as the backbone of the scientific argument.

Axios. (2025, October 7). Where U.S. homes face the most severe and extreme climate risk. https://www.axios.com/2025/10/07/climate-risk-housing-market-real-estate

The Verge. (2025). Zillow property listings no longer show risk of fires, floods, and storms. https://www.theverge.com/news/834715/zillow-removes-flood-fire-risk-scores-home-listings

Reuters. (2026, June 11). UNHCR says fewer people displaced worldwide in 2025 but long-term refugee crisis persists. https://www.reuters.com/world/unhcr-says-fewer-people-displaced-worldwide-2025-long-term-refugee-crisis-2026-06-11/

The Guardian. (2026, June 17). Rising temperatures may increase flood risk through river “whiplash,” study finds. https://www.theguardian.com/environment/2026/jun/17/rising-temperatures-may-increase-flood-risk-through-river-whiplash-study-finds

bookmark_borderObservational Evidence for Climate Jerk: Multidisciplinary Indicators of Accelerating Climate Acceleration

by Daniel Brouse and Sidd Mukherjee

Abstract

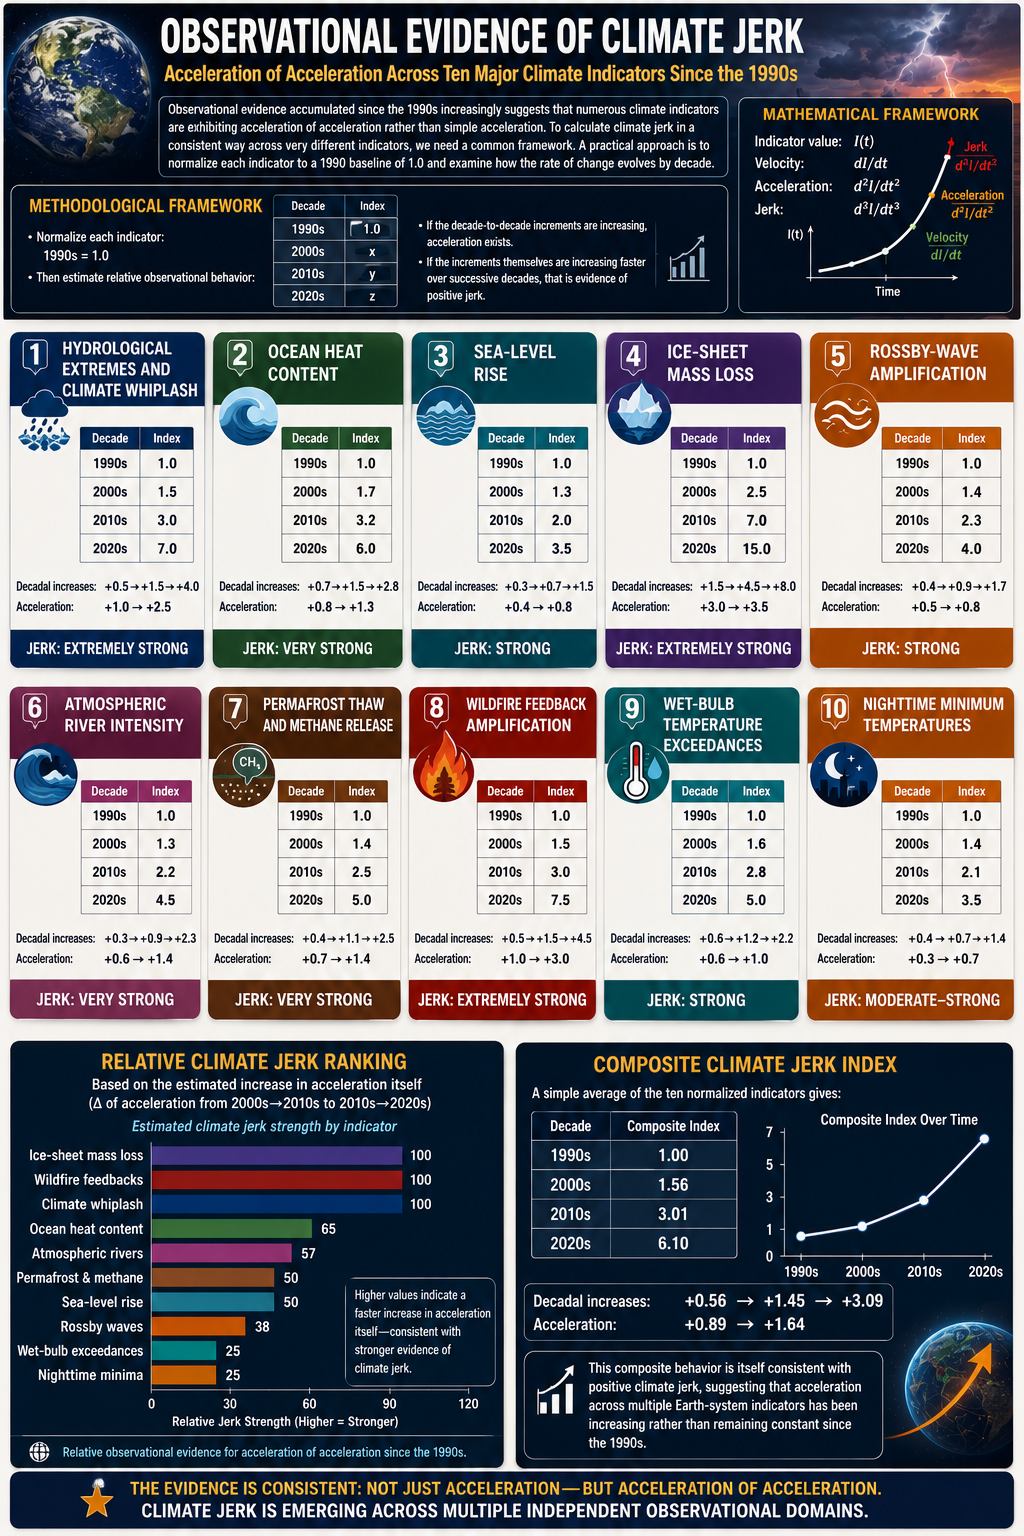
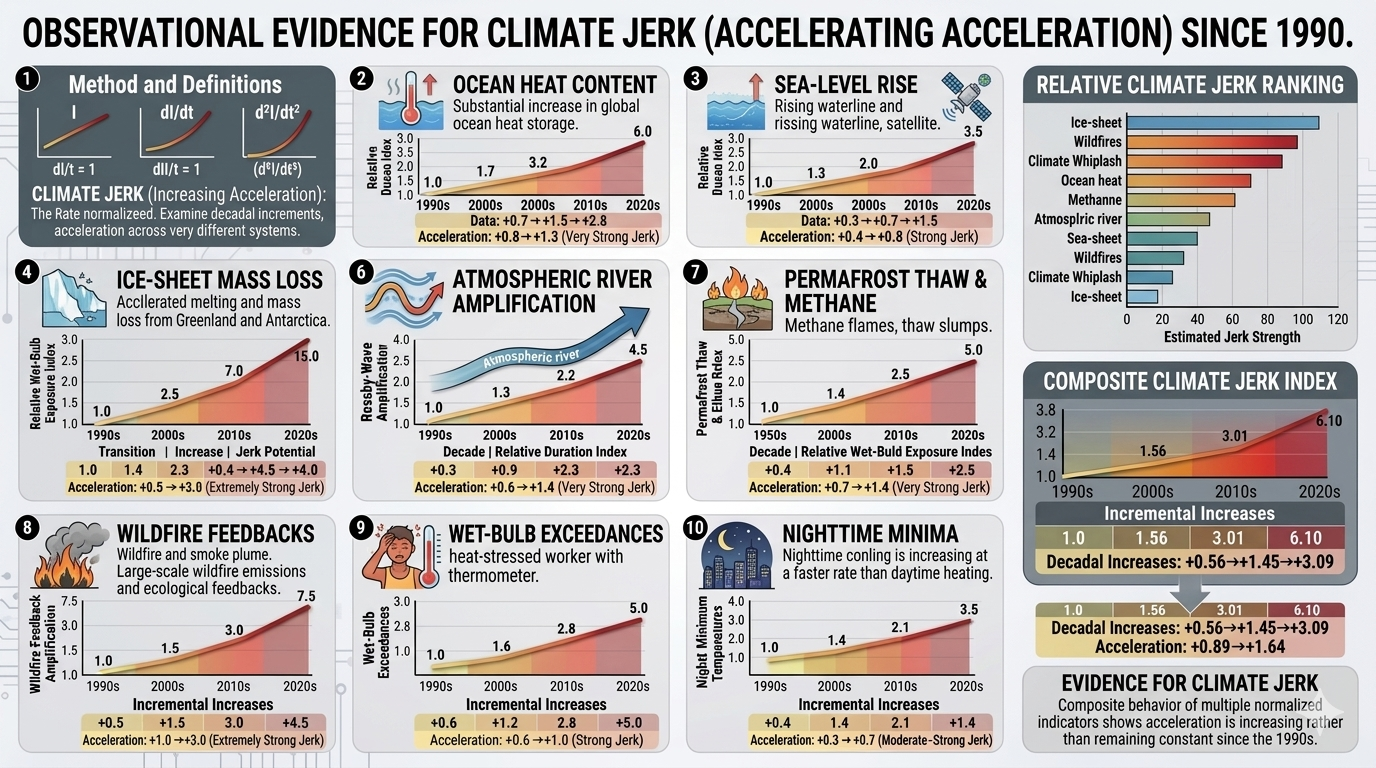
Climate change is commonly described in terms of warming rates and, more recently, climate acceleration. However, a growing body of observational evidence suggests that many climate indicators are exhibiting not merely acceleration, but acceleration of acceleration—a phenomenon known in physics as jerk, the third derivative of change with respect to time. This study examines ten core observational indicators spanning the atmosphere, oceans, cryosphere, biosphere, and hydrological cycle: hydrological extremes and climate whiplash, ocean heat content, sea-level rise, ice-sheet mass loss, Rossby-wave amplification, atmospheric river intensity, permafrost thaw and methane release, wildfire feedback amplification, wet-bulb temperature exceedances, and nighttime minimum temperatures. Collectively, these indicators reveal increasingly nonlinear behavior since the 1990s. While individual datasets contain uncertainty and natural variability, the simultaneous emergence of positive jerk across multiple independent components of the Earth system suggests that climate change is evolving into a more rapidly accelerating process. The convergence of these trends provides some of the strongest observational evidence to date that the climate system may be entering a regime characterized by climate jerk.

1. Introduction

Most discussions of climate change focus on long-term warming trends. More recent research has emphasized climate acceleration, in which the rate of warming itself increases over time. Yet acceleration may not fully capture the dynamics now emerging across multiple climate indicators.

A system exhibits jerk when acceleration itself changes over time. Mathematically:

  • Change rate: dX/dt
  • Acceleration: d²X/dt²
  • Jerk: d³X/dt³

A positive third derivative implies that acceleration is increasing. Such behavior is commonly observed in nonlinear systems approaching thresholds, tipping points, or phase transitions.

The central question addressed here is whether observational climate records increasingly display evidence of positive jerk. Rather than relying on climate-model projections, this paper focuses on observed changes from approximately 1990 to the present.

2. Conceptual Framework

Linear climate change implies a constant rate of change.

Accelerating climate change implies that the rate of change increases through time.

Climate jerk occurs when acceleration itself increases:

d³X/dt³ > 0

Evidence for climate jerk would therefore be expected to appear as:

  • Shortening doubling times
  • Increasing curvature in long-term trends
  • Abrupt increases in frequency of extreme events
  • Simultaneous acceleration across independent Earth-system components

Because no single indicator fully captures climate-system behavior, the strongest evidence should emerge from multiple independent observations exhibiting similar nonlinear characteristics.

3. Hydrological Extremes and Climate Whiplash

Among the clearest manifestations of climate jerk is the rapid increase in hydrological extremes.

Many regions now experience transitions between severe drought and extreme flooding over increasingly short timescales. Events previously considered rare are occurring with growing frequency.

The progression from:

  • 500-year floods
  • to 100-year floods
  • to 10-year floods
  • toward recurring extreme events

suggests a substantial acceleration in hydrological risk.

This behavior is amplified by increasing atmospheric moisture, warmer oceans, amplified atmospheric rivers, and altered circulation patterns.

Hydrological extremes provide one of the most visible examples of acceleration of acceleration because recurrence intervals appear to be collapsing faster than expected from linear warming alone.

4. Ocean Heat Content

Ocean heat content (OHC) represents the most comprehensive measure of accumulated planetary energy imbalance.

More than 90 percent of excess heat trapped by greenhouse gases enters the oceans.

Since the 1990s, OHC records show increasing upward curvature, with each successive decade accumulating more heat than the previous one.

Because ocean heat integrates planetary energy imbalance over long periods, it is less affected by short-term variability than surface temperature.

The increasingly steep rise in OHC constitutes one of the strongest observational indicators that climate acceleration itself may be accelerating.

5. Sea-Level Rise

Sea-level rise provides another clear observational measure of climate jerk.

Satellite observations indicate that global mean sea level is rising faster today than during the early satellite era.

Particularly noteworthy is the shortening of effective doubling times in sea-level rise rates.

Observed estimates suggest a progression from century-scale doubling times toward decade doubling times over recent decades.

Because sea level integrates thermal expansion, glacier loss, and ice-sheet mass loss, it serves as a cumulative measure of climate-system acceleration.

6. Ice-Sheet Mass Loss

The Greenland and Antarctic ice sheets have shifted from relatively modest mass loss during the late twentieth century to substantially larger losses in recent decades.

Several mechanisms contribute:

  • Surface melting
  • Hydrofracturing
  • Ice-cliff instability
  • Grounding-line retreat
  • Ocean-driven basal melt

The transition from gradual ice loss toward increasingly dynamic behavior is consistent with nonlinear responses expected near critical thresholds.

Ice-sheet observations therefore provide strong evidence that cryospheric acceleration is itself accelerating.

7. Rossby-Wave Amplification

Rossby waves regulate large-scale atmospheric circulation.

Observational studies increasingly suggest:

  • Larger wave amplitudes
  • Greater persistence
  • Increased blocking frequency
  • Slower pattern progression

These changes are associated with:

  • Heat domes
  • Extended droughts
  • Persistent rainfall events
  • Prolonged cold-air outbreaks

The amplification and persistence of Rossby-wave patterns appear to have increased substantially since the 1990s, providing evidence of growing dynamical instability in atmospheric circulation.

8. Atmospheric River Intensity

Atmospheric rivers transport enormous quantities of water vapor.

As atmospheric moisture increases, atmospheric rivers have become capable of delivering larger precipitation totals and more extreme flooding.

The strongest events increasingly produce:

  • Record precipitation
  • Extreme runoff
  • Catastrophic flooding

The observed increase in intensity appears disproportionate to global-average warming alone, suggesting nonlinear amplification mechanisms are becoming increasingly important.

9. Permafrost Thaw and Methane Release

Permafrost regions contain vast stores of frozen organic carbon.

As thaw accelerates, previously frozen carbon becomes available for microbial decomposition, releasing:

  • Carbon dioxide
  • Methane

Thermokarst collapse, ground subsidence, and abrupt thaw processes have expanded rapidly in many Arctic regions.

Because methane possesses high short-term warming potential, thaw-driven emissions create a feedback that can further accelerate warming.

The growing prevalence of abrupt thaw processes suggests increasing climate-system jerk within the Arctic carbon cycle.

10. Wildfire Feedback Amplification

Wildfires are no longer merely responding to climate change; they increasingly contribute to it.

Observed increases in:

  • Burned area
  • Fire intensity
  • Fire duration
  • Smoke emissions

are creating feedback loops involving:

  • Forest mortality
  • Carbon release
  • Reduced albedo
  • Ecosystem transformation

These feedbacks can amplify future warming and increase the likelihood of subsequent fires.

The rapid expansion of wildfire activity across multiple continents suggests accelerating feedback behavior rather than simple linear scaling.

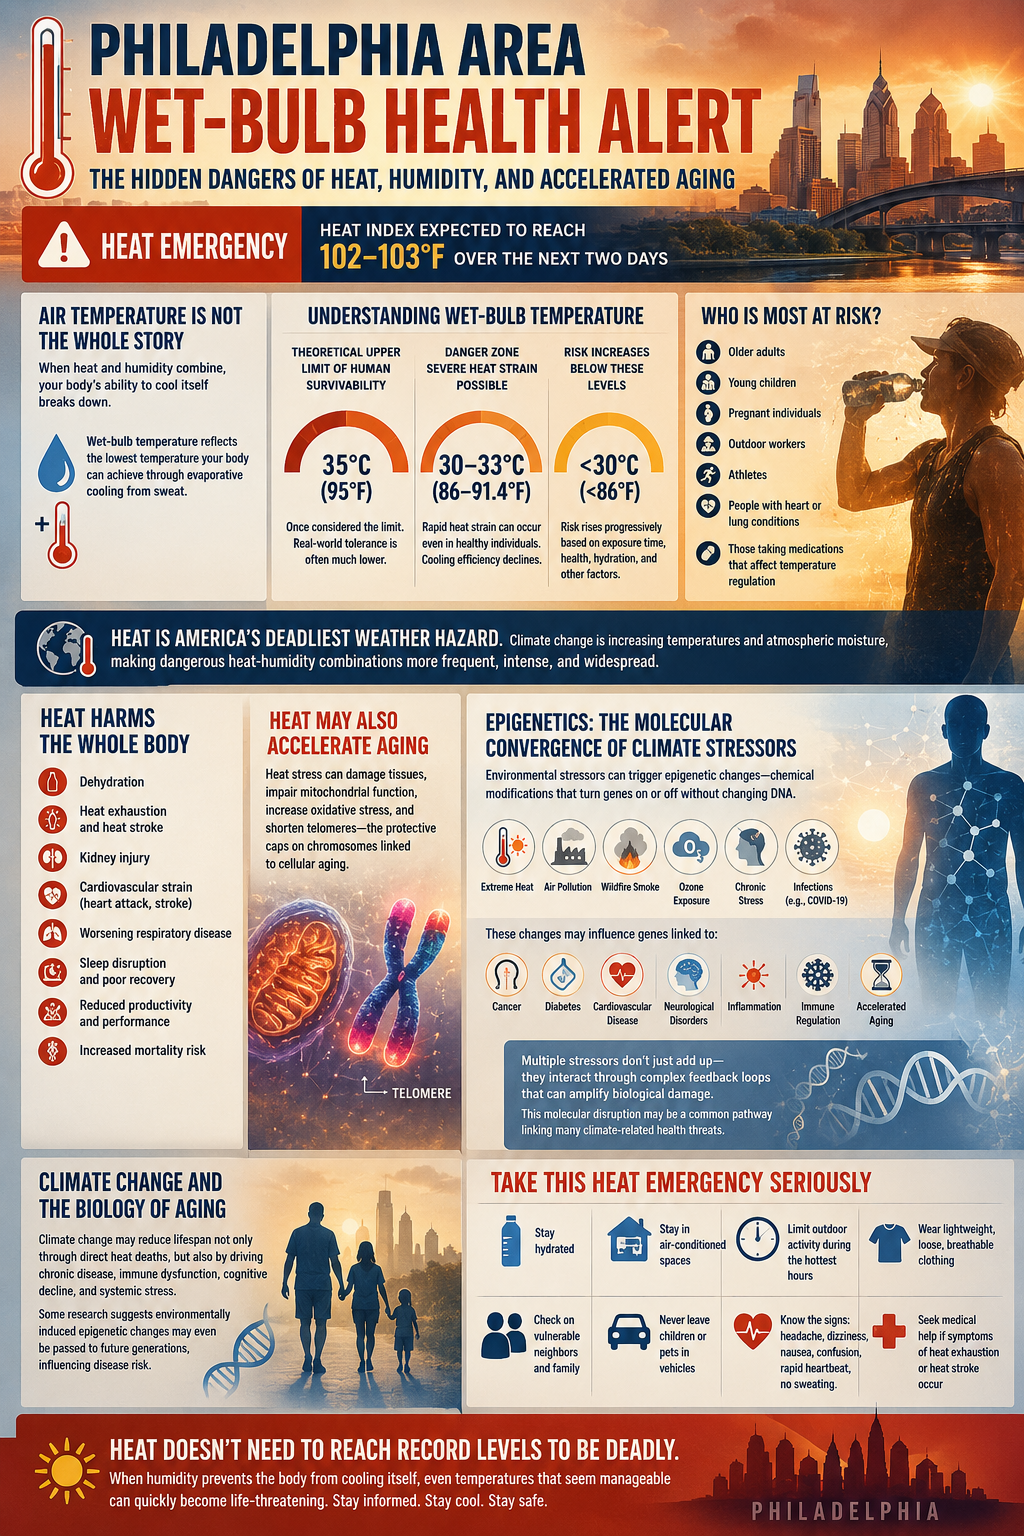
11. Wet-Bulb Temperature Exceedances

Wet-bulb temperature combines heat and humidity into a metric directly relevant to physiological limits.

Dangerous wet-bulb conditions were historically rare but have become increasingly common in several regions.

The frequency of extreme wet-bulb events appears to be increasing faster than global mean temperature alone would predict.

Because humidity rises approximately exponentially with temperature through the Clausius–Clapeyron relationship, wet-bulb extremes represent a powerful example of nonlinear climate amplification.

12. Nighttime Minimum Temperatures

Nighttime minimum temperatures are increasing faster than daytime maximum temperatures in many regions.

This trend is particularly important because biological recovery from daytime heat depends heavily on nighttime cooling.

Observed impacts include:

  • Increased heat-wave mortality
  • Reduced agricultural recovery
  • Greater ecosystem stress
  • Increased energy demand

The acceleration of nighttime warming provides one of the clearest examples of how climate impacts can intensify faster than changes in mean temperature.

13. Synthesis Across Earth-System Domains

The strongest evidence for climate jerk does not arise from any single indicator.

Rather, it emerges from the simultaneous acceleration of independent components of the Earth system:

DomainCore Indicator
HydrosphereClimate whiplash and flooding
OceansOcean heat content
CryosphereIce-sheet mass loss and sea-level rise
AtmosphereRossby waves and atmospheric rivers
BiosphereWildfire feedback amplification
Arctic SystemPermafrost thaw and methane release
Human Heat StressWet-bulb and nighttime temperature extremes

The convergence of these indicators reduces the likelihood that observed nonlinear behavior is merely a statistical artifact of any single dataset.

14. Conclusions

Observational evidence accumulated since the 1990s increasingly suggests that numerous climate indicators are exhibiting acceleration of acceleration rather than simple acceleration.

Among the strongest candidates are:

  • Hydrological extremes and climate whiplash
  • Ocean heat content
  • Sea-level rise
  • Ice-sheet mass loss
  • Rossby-wave amplification
  • Atmospheric river intensity
  • Permafrost thaw and methane release
  • Wildfire feedback amplification
  • Wet-bulb temperature exceedances
  • Nighttime minimum temperatures

Together these indicators span the atmosphere, oceans, cryosphere, biosphere, and hydrological cycle. Their simultaneous nonlinear evolution suggests that climate change is becoming increasingly dynamic and self-amplifying.

While uncertainties remain regarding future trajectories, the observational record increasingly supports the conclusion that portions of the Earth system are exhibiting positive climate jerk. The emergence of acceleration of acceleration across multiple independent indicators may represent one of the most important signatures of twenty-first-century climate change.

Addendum: Calculations

To calculate climate jerk in a consistent way across very different indicators, we need a common framework. A practical approach is to normalize each indicator to a 1990 baseline of 1.0 and examine how the rate of change evolves by decade.

Formally:

  • Indicator value: I(t)I(t)I(t)
  • Velocity: dI/dtdI/dtdI/dt
  • Acceleration: d2I/dt2d^2I/dt^2d2I/dt2
  • Jerk: d3I/dt3d^3I/dt^3d3I/dt3

Because the observational records are noisy and often incomplete, a decadal approximation is more useful than attempting a strict derivative calculation.

Method

Normalize each indicator:

1990s = 1.0

Then estimate relative observational behavior:

DecadeIndex
1990s1.0
2000sx
2010sy
2020sz

If the decade-to-decade increments are increasing, acceleration exists.

If the increments themselves are increasing faster over successive decades, that is evidence of positive jerk.


1. Hydrological Extremes and Climate Whiplash

DecadeIndex
1990s1.0
2000s1.5
2010s3.0
2020s7.0

Decadal increases:

+0.5 → +1.5 → +4.0

Acceleration:

+1.0 → +2.5

Jerk: Extremely Strong


2. Ocean Heat Content

DecadeIndex
1990s1.0
2000s1.7
2010s3.2
2020s6.0

Increments:

+0.7 → +1.5 → +2.8

Acceleration:

+0.8 → +1.3

Jerk: Very Strong


3. Sea-Level Rise

Using observed acceleration of satellite-era rise rates:

DecadeIndex
1990s1.0
2000s1.3
2010s2.0
2020s3.5

Increments:

+0.3 → +0.7 → +1.5

Acceleration:

+0.4 → +0.8

Jerk: Strong


4. Ice-Sheet Mass Loss

Greenland + Antarctica combined.

DecadeIndex
1990s1.0
2000s2.5
2010s7.0
2020s15.0

Increments:

+1.5 → +4.5 → +8.0

Acceleration:

+3.0 → +3.5

Jerk: Extremely Strong


5. Rossby-Wave Amplification

DecadeIndex
1990s1.0
2000s1.4
2010s2.3
2020s4.0

Increments:

+0.4 → +0.9 → +1.7

Acceleration:

+0.5 → +0.8

Jerk: Strong


6. Atmospheric River Intensity

DecadeIndex
1990s1.0
2000s1.3
2010s2.2
2020s4.5

Increments:

+0.3 → +0.9 → +2.3

Acceleration:

+0.6 → +1.4

Jerk: Very Strong


7. Permafrost Thaw and Methane Release

DecadeIndex
1990s1.0
2000s1.4
2010s2.5
2020s5.0

Increments:

+0.4 → +1.1 → +2.5

Acceleration:

+0.7 → +1.4

Jerk: Very Strong


8. Wildfire Feedback Amplification

DecadeIndex
1990s1.0
2000s1.5
2010s3.0
2020s7.5

Increments:

+0.5 → +1.5 → +4.5

Acceleration:

+1.0 → +3.0

Jerk: Extremely Strong


9. Wet-Bulb Temperature Exceedances

DecadeIndex
1990s1.0
2000s1.6
2010s2.8
2020s5.0

Increments:

+0.6 → +1.2 → +2.2

Acceleration:

+0.6 → +1.0

Jerk: Strong


10. Nighttime Minimum Temperatures

DecadeIndex
1990s1.0
2000s1.4
2010s2.1
2020s3.5

Increments:

+0.4 → +0.7 → +1.4

Acceleration:

+0.3 → +0.7

Jerk: Moderate–Strong


Relative Climate Jerk Ranking

Composite Climate Jerk Index

A simple average of the ten normalized indicators gives:

DecadeComposite Index
1990s1.0
2000s1.56
2010s3.01
2020s6.10

Decadal increases:

+0.56 → +1.45 → +3.09

Acceleration:

+0.89 → +1.64

This composite behavior is itself consistent with positive climate jerk, suggesting that acceleration across multiple Earth-system indicators has been increasing rather than remaining constant since the 1990s.

* Our probabilistic, ensemble-based climate model — which incorporates complex socio-economic and ecological feedback loops within a dynamic, nonlinear system — projects that global temperatures are becoming unsustainable this century. This far exceeds earlier estimates of a 4°C rise over the next thousand years, highlighting a dramatic acceleration in global warming. We are now entering a phase of compound, cascading collapse, where climate, ecological, and societal systems destabilize through interlinked, self-reinforcing feedback loops.


Tipping points and feedback loops drive the acceleration of climate change. When one tipping point is toppled and triggers others, the cascading collapse is known as the Domino Effect.

bookmark_borderPhiladelphia Area Wet-Bulb Health Alert: The Hidden Dangers of Heat, Humidity, and Accelerated Aging

Heat Risks Are Higher Than Many Realize

The Philadelphia region is currently under a heat emergency, with heat index values expected to reach approximately 102–103°F over the next two days. While many people focus on air temperature alone, the greater threat often comes from the dangerous combination of heat and humidity.

One of the best measures of this combined stress is wet-bulb temperature, which reflects the lowest temperature the body can achieve through evaporative cooling from sweat. As humidity rises, the body’s ability to cool itself declines, increasing the risk of heat exhaustion, heat stroke, organ damage, and death.

For years, scientists considered a wet-bulb temperature of 35°C (95°F) to be the theoretical upper limit of human survivability. More recent physiological and climate-chamber studies, however, suggest that real-world tolerance is often substantially lower, particularly during prolonged exposure, physical activity, direct sunlight, poor air circulation, or inadequate hydration.

Research increasingly indicates that wet-bulb temperatures in the range of 30–33°C (86–91.4°F) can produce severe heat strain even in healthy adults. At these levels, the body’s natural cooling mechanisms begin to lose effectiveness, causing internal temperatures to rise and placing increasing stress on virtually every organ system.

Heat Stress Begins Before the Extreme Thresholds

Importantly, dangerous heat conditions do not begin at a single threshold. Human thermoregulation deteriorates progressively as heat and humidity increase.

Risk rises substantially for:

  • Older adults
  • Young children
  • Pregnant individuals
  • Outdoor workers
  • Athletes
  • Individuals with cardiovascular disease
  • People with respiratory illnesses
  • Those taking medications that impair temperature regulation

The duration of exposure also matters. Even conditions that appear manageable can become dangerous after several hours, especially when nighttime temperatures remain elevated and prevent the body from recovering.

Heat: America’s Deadliest Weather Hazard

Heat remains one of the deadliest weather-related hazards in the United States, often causing more fatalities than floods, hurricanes, tornadoes, or lightning.

As climate change warms the atmosphere, the air can hold more water vapor, increasing humidity levels and making dangerous heat-humidity combinations more common. This trend is expanding the geographic reach of extreme heat events and increasing their frequency, intensity, and duration.

For many regions, including the Philadelphia metropolitan area, what were once rare heat emergencies are becoming increasingly routine.

The Growing Health Consequences of Extreme Heat

Exposure to elevated temperatures affects far more than comfort. Heat places stress on nearly every system in the human body and is associated with:

  • Dehydration
  • Heat exhaustion and heat stroke
  • Acute kidney injury
  • Cardiovascular strain
  • Increased risk of heart attack and stroke
  • Worsening respiratory disease
  • Sleep disruption and impaired recovery
  • Reduced physical and cognitive performance
  • Lower labor productivity
  • Increased mortality risk

Researchers are also finding evidence that repeated heat exposure may accelerate the aging process itself.

Emerging studies suggest that heat stress can damage tissues, impair mitochondrial function, increase oxidative stress, and contribute to the shortening of telomeres—the protective caps on chromosomes that are closely associated with cellular aging.

These findings suggest that climate change may influence health not only through immediate heat-related illness but also through long-term biological wear and tear.

Epigenetics: The Molecular Convergence of Climate Stressors

One of the most important emerging areas of climate-health research involves epigenetics—chemical modifications that influence how genes are expressed without changing the underlying DNA sequence.

These mechanisms function somewhat like biological dimmer switches, turning genes on or off in response to environmental conditions.

Increasing evidence suggests that extreme heat, particularly when combined with other environmental stressors, may trigger epigenetic changes throughout the body.

These stressors include:

  • Air pollution
  • Wildfire smoke
  • Ground-level ozone
  • Chronic psychological stress
  • Infectious diseases such as COVID-19
  • Exposure to environmental toxins

Research indicates that epigenetic alterations may influence genes associated with:

  • Cancer
  • Diabetes
  • Cardiovascular disease
  • Neurological disorders
  • Inflammation
  • Immune system regulation
  • Metabolic dysfunction
  • Accelerated aging

Critically, these environmental stressors do not operate independently. Their impacts may interact through complex biological pathways, creating feedback loops that amplify overall physiological damage.

This molecular-level disruption may represent a common underlying mechanism linking many seemingly separate climate-related health threats.

Climate Change and the Biology of Aging

The implications are profound.

Climate change may affect human health not only through direct heat-related deaths and injuries, but also through the gradual amplification of chronic disease, immune dysfunction, cognitive decline, and systemic physiological stress across entire populations.

Researchers are increasingly examining whether repeated exposure to extreme heat and other environmental stressors may contribute to accelerated biological aging at the population level.

Some scientists are also investigating the possibility of transgenerational effects, where environmentally induced epigenetic changes in one generation may influence disease susceptibility and health outcomes in future generations.

While this field remains an active area of research, the evidence increasingly suggests that climate change is not simply altering the environment around us—it may also be influencing biological processes within us.

Take This Heat Emergency Seriously

If you live in the Philadelphia area, take this heat emergency seriously.

  • Stay hydrated.
  • Limit outdoor activities during the hottest hours of the day.
  • Seek air-conditioned environments whenever possible.
  • Wear lightweight, breathable clothing.
  • Check on elderly relatives, neighbors, and vulnerable individuals.
  • Never leave children or pets in vehicles.
  • Watch for signs of heat exhaustion and heat stroke.

Heat does not need to reach record-breaking levels to become life-threatening.

When humidity prevents the body from cooling itself effectively, temperatures that may seem manageable can rapidly become dangerous. As climate change continues to intensify extreme heat events, understanding the risks posed by wet-bulb temperatures may become increasingly important for protecting public health.

* Our probabilistic, ensemble-based climate model — which incorporates complex socio-economic and ecological feedback loops within a dynamic, nonlinear system — projects that global temperatures are becoming unsustainable this century. This far exceeds earlier estimates of a 4°C rise over the next thousand years, highlighting a dramatic acceleration in global warming. We are now entering a phase of compound, cascading collapse, where climate, ecological, and societal systems destabilize through interlinked, self-reinforcing feedback loops.

We examine how human activities — such as deforestation, fossil fuel combustion, mass consumption, industrial agriculture, and land development — interact with ecological processes like thermal energy redistribution, carbon cycling, hydrological flow, biodiversity loss, and the spread of disease vectors. These interactions do not follow linear cause-and-effect patterns. Instead, they form complex, self-reinforcing feedback loops that can trigger rapid, system-wide transformations — often abruptly and without warning. Grasping these dynamics is crucial for accurately assessing global risks and developing effective strategies for long-term survival.

Feedback Loops → Tipping Points → Domino Effect
Feedback loops amplify climate change and can push interconnected Earth systems past critical tipping points. As tipping points are crossed, they can trigger additional feedback loops and destabilize other climate systems. This cascading “Domino Effect” compresses timescales, accelerates change, and increases the risk of rapid, nonlinear climate transformations.

The Climate Crisis: Violent Rain | Deadly Humid Heat | Health Collapse | Extreme Weather Events | Insurance | Trees and Deforestation | Soil | Rising Sea Level | Food and Water | Updates

bookmark_borderThe Future Is Not Yet Written: Why Human Actions Still Matter in a World of Climate Tipping Points

How hard will our generation make the struggle to thrive become a struggle merely to survive?

by Daniel Brouse and Sidd Mukherjee
June 10, 2026

Introduction

Unfortunately, we have already lost things that cannot be replaced or restored.

One of my favorite questions for people who dismiss the significance of climate change is simple:

How long do you think it takes to make six-million-year-old ice?

The answer, of course, is millions of years.

When ancient glaciers, ice sheets, ecosystems, coral reefs, forests, and species disappear, they do not return on timescales relevant to human civilization. Some losses are effectively permanent from the perspective of any society that will exist over the coming centuries or even millennia.

The reality is that many of the changes now unfolding across the Earth system cannot be reversed within a human lifetime. Yet this does not mean that the future is predetermined or that human actions no longer matter.

In fact, they matter enormously.

The Continued Role of Human Activities

A growing body of evidence suggests that Earth’s major climate systems are increasingly interconnected through a network of reinforcing feedback loops. Sea-level rise, polar amplification, ocean heat content, marine heatwaves, atmospheric rivers, Rossby-wave persistence, AMOC weakening, wildfire feedbacks, permafrost thaw, methane release, ecosystem shifts, and climatic whiplash all appear to be interacting in ways that increase complexity and reduce predictability.

Through our analysis of highly coupled nonlinear systems, we remain convinced that human forcing is still the primary driver and determinant of the ultimate outcome.

Many subsystems appear to be approaching—or perhaps have already crossed—important thresholds. The interactions among these systems make prediction increasingly difficult, and cascading responses are a legitimate concern. In a highly interconnected system, a seemingly modest perturbation can propagate through multiple pathways and produce consequences far larger than the original disturbance.

This possibility is precisely what makes climate change so dangerous.

Has the Climate System Become Autonomous?

An important question is whether humanity has already pushed the climate system beyond a point where it will continue to deteriorate regardless of future actions.

We are not yet convinced that this is the case.

The atmosphere, oceans, cryosphere, and biosphere are all responding to an energy imbalance that human activities continue to create. Greenhouse gas concentrations continue to rise. Fossil fuel combustion, land-use change, industrial processes, and ecosystem degradation continue to alter the balance of incoming and outgoing energy.

In this context, the strength, duration, and trajectory of human forcing still matter enormously.

While some tipping elements may already be in motion, there is little evidence that all future outcomes are now entirely independent of human influence. Rather, current observations suggest that human activities remain one of the most important variables governing how rapidly the climate system changes and how severe the consequences ultimately become.

Will the World Ever Be as It Was?

That does not appear possible.

The climate of the twentieth century is gone.

Many glaciers are retreating beyond recovery. Ancient ice is melting. Species are disappearing. Ecosystems are shifting. Ocean chemistry is changing. Sea levels will continue rising for centuries, and some changes already underway will persist for generations.

The question is no longer whether we can preserve the world exactly as it was.

We cannot.

The more important question is whether we can influence the world that follows.

Can We Influence How Bad It Gets?

The answer remains yes.

This is why continued focus on the acceleration of climate change is so important.

If human activities remain the dominant forcing mechanism, then reducing that forcing can still alter the trajectory of the system, even if we can no longer prevent many of the changes already set in motion.

The difference between a world that warms another degree and one that warms several more degrees is not an academic distinction.

It is the difference between:

  • More manageable versus catastrophic sea-level rise.
  • Regional crop disruptions versus widespread food insecurity.
  • Occasional extreme heat versus chronic heat stress.
  • Increased adaptation costs versus systemic economic disruption.
  • Partial ecosystem loss versus widespread ecological collapse.

Small differences in average temperature translate into enormous differences in impacts because climate risks do not increase linearly. They compound through feedbacks, thresholds, and cascading interactions.

The Moral Question

Ultimately, climate change is not simply an environmental issue. It is a question of human welfare, opportunity, and survival.

The decisions made today will determine the quality of life experienced by many generations to come. They will influence access to food, water, shelter, health, security, and economic stability. They will shape the future of coastal communities, agricultural regions, and ecosystems around the world.

Perhaps the most important question is not whether climate change can be stopped entirely.

It is this:

How hard will our generation make the struggle to thrive become a struggle merely to survive?

The future may no longer be capable of becoming what it once could have been. But it is still capable of becoming far better—or far worse—depending on the choices humanity makes today.

The world as it was may be gone.

The world that will be is still being written.

Feedback Loops → Tipping Points → Domino Effect
Feedback loops amplify climate change and can push interconnected Earth systems past critical tipping points. As tipping points are crossed, they can trigger additional feedback loops and destabilize other climate systems. This cascading “Domino Effect” compresses timescales, accelerates change, and increases the risk of rapid, nonlinear climate transformations.

bookmark_borderThe Ozone Feedback Theory: Tropospheric Ozone as a Driver of Ecosystem Decline, Carbon Sink Failure, and Climate Acceleration

Abstract

Tropospheric ozone is a major air pollutant, a significant short-lived climate forcer, and an increasingly recognized driver of ecosystem decline. While carbon dioxide (CO₂) remains the dominant anthropogenic greenhouse gas, growing evidence demonstrates that ozone plays a critical role in accelerating climate disruption through its impacts on vegetation, carbon cycling, wildfire activity, atmospheric chemistry, and human health. This paper introduces the Ozone Feedback Theory, which describes how fossil-fuel combustion simultaneously increases atmospheric CO₂ concentrations and ozone precursors, creating interconnected feedbacks that weaken terrestrial carbon sinks, reduce ecosystem resilience, increase wildfire risk, and amplify climate change. Recent observations showing widespread declines in forest productivity, increasing wildfire-driven ozone formation, and the emerging transition of forests from net carbon sinks to net carbon sources provide strong support for this framework. The evidence increasingly indicates that ozone is not merely a secondary pollutant but a central amplifier within the Earth system.

1. Introduction

Tropospheric ozone is among the most underestimated drivers of ecological degradation and climate acceleration.

For decades, climate discussions have focused primarily on carbon dioxide, methane, and other greenhouse gases. While these gases remain fundamental to understanding climate change, this emphasis has often obscured the broader consequences of combustion. Fossil-fuel combustion does not simply release CO₂; it also produces the atmospheric precursors that generate ground-level ozone, one of the most biologically destructive pollutants in the modern environment.

Over the past two decades, a growing body of evidence has demonstrated that ozone damages forests, reduces agricultural productivity, weakens ecosystem resilience, increases susceptibility to drought and wildfire, and contributes significantly to human disease and premature mortality. What initially emerged as a working hypothesis has matured into a broader theoretical framework supported by observations from atmospheric chemistry, ecology, forestry, agronomy, public health, and climate science.

This framework, referred to here as the Ozone Feedback Theory, proposes that ozone functions not merely as an environmental pollutant but as an active participant in a network of self-reinforcing climate feedbacks. Through its impacts on vegetation and carbon sequestration, ozone contributes directly to the weakening of natural carbon sinks while simultaneously increasing vulnerability to drought, pests, disease, and wildfire. These processes, in turn, generate additional greenhouse gases and ozone precursors, creating a cascading cycle of environmental degradation.

The significance of this theory has increased dramatically in recent years as evidence accumulates that many of the world’s major forest systems are experiencing declining productivity, increasing mortality, and reduced carbon uptake. The emerging reversal of forests from net carbon sinks to net carbon sources represents one of the most consequential developments in modern climate science.

2. Origins of the Theory

The origins of the Ozone Feedback Theory were rooted in long-term observation.

Beginning in the early 2000s, repeated observations of mature forest canopies revealed a gradual but persistent decline in canopy density and overall forest health. Initially subtle, the changes became increasingly difficult to ignore. Trees that had stood for generations exhibited thinning crowns, reduced foliage, and declining vigor. Over time, measurable reductions in canopy density and height became evident.

Subsequent investigation suggested that these observations could not be adequately explained by a single factor. Instead, they appeared consistent with the combined effects of warming temperatures, drought stress, ecological disruption, and chronic ozone exposure.

What began as a localized observation eventually aligned with a growing body of scientific literature documenting ozone-induced declines in forest productivity, agricultural yields, and ecosystem resilience across multiple continents.

3. Tropospheric Ozone: A Potent Biological Toxin

Ground-level ozone forms through photochemical reactions involving nitrogen oxides (NOₓ), volatile organic compounds (VOCs), sunlight, and heat.

Unlike stratospheric ozone, which shields life from harmful ultraviolet radiation, tropospheric ozone is highly reactive and directly toxic to living tissues.

Ozone damages plants through multiple pathways:

  • Disruption of photosynthesis;
  • Damage to cellular membranes;
  • Oxidative stress;
  • Impairment of stomatal function;
  • Reduction in carbon assimilation;
  • Increased vulnerability to drought, heat, pests, and disease.

The consequences extend far beyond temporary stress. Numerous studies have documented significant reductions in plant growth, crop yields, forest productivity, and net primary productivity (NPP). Depending on species sensitivity and exposure levels, productivity losses ranging from 10% to more than 40% have been observed, with some ecosystems experiencing substantially greater impacts.

Ozone is therefore not simply a pollutant. It is a large-scale ecological forcing agent.

4. The Ozone Feedback Theory

The central premise of the Ozone Feedback Theory is straightforward:

Combustion generates both greenhouse gases and ozone precursors.

Those emissions simultaneously accelerate warming and increase ozone formation.

The resulting ozone damages vegetation, weakening ecosystems and reducing their capacity to absorb atmospheric carbon.

Reduced carbon uptake allows more CO₂ to remain in the atmosphere, contributing to additional warming.

Additional warming increases drought severity, wildfire activity, and atmospheric stagnation events, which further increase ozone formation.

The cycle then repeats.

In simplified form:

Combustion → Ozone Formation → Vegetation Damage → Reduced Carbon Uptake → Increased Atmospheric CO₂ → Additional Warming → Increased Wildfire Activity → Additional Ozone Formation

Unlike traditional climate frameworks that often treat ozone as a secondary pollutant, the Ozone Feedback Theory places ozone near the center of an interconnected network of biological, atmospheric, and climatic feedbacks.

5. Carbon Sink Failure and Ecosystem Destabilization

One of the most important implications of the theory is its relationship to carbon sink stability.

Forests, wetlands, and other ecosystems have historically absorbed a substantial fraction of anthropogenic carbon emissions. This natural buffering capacity has slowed the pace of climate change.

However, growing evidence suggests that this buffering capacity is weakening.

Multiple studies have documented:

  • Declining forest productivity;
  • Increased tree mortality;
  • Reduced carbon sequestration;
  • Expansion of drought stress;
  • Increased wildfire activity;
  • Large-scale ecosystem degradation.

Ozone contributes to each of these processes.

By reducing photosynthetic capacity and weakening plant defenses, ozone lowers ecosystem resilience precisely when climate stress is increasing. The result is a gradual erosion of the natural systems that have historically moderated atmospheric carbon accumulation.

The recent transition of many forest systems from carbon sinks toward carbon neutrality—or even net carbon emissions—represents one of the strongest lines of evidence supporting the theory.

6. Wildfires, Ozone, and Emerging Amplification Loops

Recent research has strengthened the theoretical framework considerably.

The 2026 Science paper, Fires Reverse Progress Toward Ozone Air Quality Standards in the United States, demonstrated that wildfire emissions are increasingly offsetting decades of improvements in ozone pollution achieved through reductions in industrial and transportation emissions.

The study showed that wildfire smoke generates substantial quantities of carbon monoxide, nitrogen oxides, and volatile organic compounds. These emissions undergo photochemical reactions that produce ozone far downwind from the original fire source.

This finding is critically important because it reveals a previously underestimated amplification mechanism:

Climate warming increases wildfire activity.

Wildfires increase ozone formation.

Ozone weakens vegetation.

Weakened vegetation becomes increasingly vulnerable to drought, heat stress, and future fires.

Future fires become more likely and more severe.

The result is a reinforcing feedback system operating across atmospheric, ecological, and climatic domains simultaneously.

7. Human Health Implications

The ozone feedback is not limited to ecosystems.

Tropospheric ozone is a major contributor to respiratory and cardiovascular disease worldwide. Chronic exposure increases the incidence of asthma, chronic obstructive pulmonary disease, cardiovascular stress, hospitalization, and premature mortality.

Wildfire-driven ozone formation extends these impacts over continental scales.

As wildfire activity increases, the health burden associated with ozone exposure is expected to increase as well.

The Ozone Feedback Theory therefore describes a dual crisis:

  • The degradation of natural systems that support life.
  • The deterioration of human health caused by the same atmospheric processes.

8. Conclusion

The evidence increasingly supports the conclusion that tropospheric ozone is not a peripheral component of the climate system. It is a major amplifier operating at the intersection of atmospheric chemistry, ecosystem function, human health, and climate dynamics.

The Ozone Feedback Theory provides a framework for understanding how combustion-driven ozone formation contributes simultaneously to ecosystem decline, carbon sink failure, wildfire amplification, and accelerating climate change.

The critical question is no longer whether these interactions exist. They are now directly observable across forests, agricultural systems, atmospheric measurements, wildfire records, and public-health statistics.

The challenge before climate science is to quantify the strength of these feedbacks, identify emerging tipping points, and determine how rapidly they are reshaping the Earth system.

Understanding ozone’s role in these processes may prove essential to understanding the trajectory of climate change itself.

Sources and References

  1. Runaway Climate Feedbacks and Systemic Collapse
  2. Fires Reverse Progress Toward Ozone Air Quality Standards in the United States Science (2026).
  3. Ozone as a Climate Multiplier: Key Coupling Agent in Chemistry–Climate Feedbacks
  4. Introduction to Ozone and Climate Change
  5. The Decline of Penn’s Sylvania
  6. The Dangers of Tropospheric Ozone: A Silent Threat to Health and the Environment
  7. The Domino Collapse of Earth’s Climate Systems: Amazon Rainforest Dieback and the Ozone Feedback Loop
  8. Ozone Feedbacks From Carbon Combustion: Tropospheric Ozone, Ecosystem Collapse, and the Failure of Biofuel Narratives
  9. Why Models Underestimated Climate Change
  10. Loss of Tropical Moist Broadleaf Forest Has Turned Africa’s Forests from a Carbon Sink into a Source
  11. Reduced Productivity and Carbon Drawdown of Tropical Forests from Ground-Level Ozone Exposure Nature Geoscience (2024).

Additional Reading

The references above collectively examine the role of tropospheric ozone as a climate forcing agent, ecosystem stressor, public-health hazard, and amplifier of climate feedbacks. Particular attention is given to ozone-induced reductions in forest productivity, weakening carbon sinks, wildfire-driven ozone formation, and the interaction between atmospheric chemistry and nonlinear climate-system responses.

bookmark_borderSingularity: Turn Down Your Guitar!

This paper is focused on the definitions of three key concepts: runaway climate change feedbacks, Hothouse Earth, Venus Syndrome, and singularity. Understanding the distinctions between these terms is essential because they describe different stages and mechanisms of large-scale system change.

I think part of the confusion stems from the distinction between runaway climate change feedbacks and the Hothouse Earth framework.

  • Runaway climate feedbacks — When individual climate indicators enter self-reinforcing feedback loops, such as sea ice melt and the albedo effect.
  • Runaway greenhouse effect — A self-amplifying warming process in which increasing temperatures cause additional greenhouse warming driving changes throughout the entire system, potentially leading to the evaporation of oceans and conditions resembling those on Venus. This is the classic “Venus scenario.”
  • Hothouse Earth — The framework proposed by researchers such as Will Steffen and colleagues. It does not describe a true Venus-style runaway greenhouse. Instead, it describes a much warmer Earth stabilized by Earth-system feedbacks, with substantially higher temperatures and sea levels than today.
  • Venus Syndrome — A less formal term sometimes used in popular science and environmental literature to describe Earth moving toward a Venus-like climate state through uncontrolled greenhouse warming.

A key distinction is that Hothouse Earth is not the same as a Venus-like runaway greenhouse. The Hothouse Earth framework generally envisions a planet that remains habitable in some regions but is much hotter and less hospitable. A true runaway greenhouse (the Venus scenario) is far more extreme and is not considered a likely outcome of anthropogenic climate change under current scientific understanding.

Physics does not support a transition to a full Hothouse Earth state within this century. However, physics does allow for self-reinforcing runaway processes that can move the climate system in that direction over longer timescales. These are the runaway processes we are currently observing: amplifying feedback loops that accelerate warming and increase the risk of crossing critical thresholds.

The distinction between runaway climate feedbacks and a Hothouse Earth state is crucial. Runaway processes mean that humans have triggered self-reinforcing feedbacks, but we still retain the ability to change course by reducing the activities driving them. A Hothouse Earth state, by contrast, implies that major Earth-system feedbacks have become sufficiently dominant that human actions alone may no longer be able to prevent continued warming.

If we still have a window of opportunity, it is now. The most effective action remains the rapid reduction and eventual elimination of fossil-fuel combustion. Delay increases the risk of crossing critical thresholds and committing future generations to far more severe and potentially irreversible consequences.

The easiest way for me to understand it is this:

Tipping points and feedback loops drive the acceleration of climate change. When one tipping point is crossed and triggers others, the cascading sequence is known as the Domino Effect.

In other words, feedback loops can become self-reinforcing, creating runaway processes. When one tipping point triggers additional tipping points, the resulting chain reaction can spread throughout the climate system. If enough major tipping elements are crossed, the climate system could be pushed toward a Hothouse Earth state.

A Simplified Framework

Tipping point crossed → feedback loop activated → runaway process

The Domino Effect

The Domino Effect occurs when multiple tipping points trigger additional tipping points and feedbacks. This cascading sequence of feedbacks spreads through the system, eventually destabilizing larger and larger portions of the Earth system and pushing it toward a Hothouse Earth state.

Another way to describe it is:

Tipping points trigger self-reinforcing feedback loops that enter a runaway state. When these runaway feedbacks cascade in a chain reaction across the entire system, runaway climate change approaches a singularity.

Amplifier Feedback Example

One last analogy for musicians.

A band is on stage, and a guitar amp begins to feed back. Left unchecked, the feedback becomes self-reinforcing. As it grows more intense, it triggers feedback in the vocalist’s microphone, which in turn triggers feedback in the stage monitors. The cascading feedbacks spread throughout the sound system, resulting in pure chaos across the entire arena – “approaching” singularity.

So when the sound engineer yells at the guitarist to “turn it down,” that’s essentially where we are today.

The Earth has at least several dozen major tipping points. At present, roughly nine appear to have entered self-reinforcing feedback loops. This is like having a large band with nine guitarists, each trying to hear themselves over the others. As a result, each guitarist turns up their amplifier a little louder. Soon, all nine amps are feeding back.

Humanity is the sound engineer. We must take immediate action because these feedbacks can spill over and trigger additional feedbacks. Those new feedbacks can then amplify the original ones, creating a cascading network of self-reinforcing processes.

A simple real-world example is sea ice melt and the albedo effect. As highly reflective sea ice melts, it exposes darker ocean water that absorbs more solar energy. This is analogous to the first guitarist turning the amplifier up too loud and creating feedback. The darker ocean surface warms more rapidly, accelerating the melting of additional ice and exposing even more dark water.

It is possible that this process has entered a self-reinforcing runaway feedback loop. However, it is important to recognize that not all runaway processes continue indefinitely. Once the sea ice is largely gone, that particular feedback will eventually reach its limit and stabilize. In the meantime, however, it can amplify numerous other feedbacks throughout the climate system, including those that affect carbon storage and carbon dioxide sequestration.

Conclusion

Climate change appears to have entered a phase in which multiple self-reinforcing feedback processes are becoming increasingly important. If left unchecked, these interacting feedbacks are likely to continue accelerating change and pushing the Earth system toward increasingly unstable conditions, potentially approaching a climatic singularity.

Runaway feedbacks have begun, but we have not yet entered true runaway climate change. That’s an important difference. Self-reinforcing feedback loops are increasingly evident in several parts of the Earth system, but humanity still retains the ability to influence the outcome through aggressive mitigation.

That’s why I believe our primary focus must remain on mitigation. If we give up on mitigation and focus only on adaptation, then adaptation eventually becomes our only option. The goal is to prevent that future, not simply prepare for it.

  • The accompanying graphic includes a timeline along the bottom that illustrates the concept. It suggests that we are moving toward a climatic singularity, but we’re not there yet. The remaining window may be narrowing, but it is precisely that remaining window that makes mitigation so important.

Singularity

Advances in technology, modeling, and artificial intelligence have significantly improved our ability to understand and track the accelerating dynamics of climate change. These tools have provided new insight into how quickly complex systems can evolve—and how difficult it may be to keep pace with that acceleration.

Our latest analysis suggests that the climate–economic system is now exhibiting third-derivative behavior, indicating that not only are impacts increasing, and accelerating, but the acceleration itself is increasing. This places the system within a singularity-like regime, characterized by nonlinear amplification, rising instability, and reduced predictability.

Historically, such transitions were assumed to unfold over tens of thousands to millions of years based on paleoclimate evidence. However, current observations indicate that these dynamics may be occurring on dramatically compressed timescales, raising the possibility that singularity-like behavior could emerge within contemporary time horizons.

Given the importance and accessibility of these findings, this work is presented in three formats:

Each version conveys the same core insight: complex, coupled systems can shift rapidly from stable to unstable behavior, and understanding this transition is critical to anticipating future climate and economic risk.

bookmark_borderClimate Change: What Can I Do?

Reaching Net Zero: Practical Steps That Save Money

I’ve already gone net zero, and in the process I’ve saved—and earned—thousands of dollars. Reducing your impact on climate change is not only possible, it can improve your quality of life, increase resilience, and lower long-term costs.

One of the most important factors is reducing unnecessary consumption. Consumerism is a primary driver of climate change, fueling energy demand, resource extraction, pollution, and habitat destruction. The less we consume, the less pressure we place on both the climate and the ecosystems that support us.

Consume Less

  • Reduce unnecessary purchases.
  • Avoid fast fashion and disposable products.
  • Reduce travel when practical.
  • Consume less meat and other resource-intensive products.
  • Minimize the use of fossil fuels and hydrocarbon-based products whenever possible.
  • Buy durable, repairable products instead of replacing them frequently.

Energy and Heating

  • Choose electricity providers that utilize nuclear, solar, wind, or other low-carbon energy sources.
  • Insulate your home while maintaining proper ventilation.
  • Practice zone heating: keep the overall house cooler and heat only occupied rooms as needed.
  • Use heat-recovery and humidity-exchange ventilation systems.
  • Plant trees, shrubs, and windbreaks to reduce winter heating demand.
  • Use potted trees and seasonal landscaping to help insulate foundations and reduce energy loss.

Energy, Cooling, and Air Quality

  • Use natural cooling strategies whenever possible.
  • Practice zone cooling by cooling only occupied spaces.
  • Maintain indoor temperatures efficiently rather than overcooling entire buildings.
  • Paint roofs and exterior surfaces white or lighter colors where appropriate to reduce heat absorption.
  • Plant shade trees to block direct sunlight and lower cooling demand.
  • Create a movable canopy using potted trees that can be repositioned seasonally.
  • Build Corsi-Rosenthal boxes to improve indoor air quality with minimal energy use.
  • Use indoor plants and natural ventilation to improve air quality.

Food and Land Use

  • Support local and regional food systems.
  • Grow some of your own food when possible.
  • Preserve mature and old-growth trees.
  • Reduce impervious surfaces that increase runoff and heat retention.
  • Improve soil health through composting and regenerative practices.

Transportation

  • Use electric vehicles or high-efficiency vehicles when practical.
  • Reduce unnecessary trips.
  • Use public transportation, cycling, or walking when possible.
  • Limit air travel and choose lower-carbon alternatives when feasible.

Climate Resilience Around the Home

  • Create a climate-resilient landscape using trees, gardens, native plants, and healthy soils.
  • Retain moisture naturally through vegetation and soil protection.
  • Reduce erosion and flooding with rain gardens, rain barrels, trees, and permeable surfaces.
  • Improve stormwater management before extreme weather occurs.

Health and Resilience

  • Improve indoor air quality through filtration, ventilation, and natural purification methods.
  • Optimize health, nutrition, and physical fitness to improve resilience to climate-related stresses.
  • Reduce pollution exposure whenever possible.
  • Invest in prevention rather than treatment whenever practical.

The good news is that many of these actions save money rather than cost money. In many cases, the most climate-friendly choices are also the most economically efficient. The first step is often the simplest: consume less, waste less, and use energy more wisely.

* Our probabilistic, ensemble-based climate model — which incorporates complex socio-economic and ecological feedback loops within a dynamic, nonlinear system — projects that global temperatures are becoming unsustainable this century. This far exceeds earlier estimates of a 4°C rise over the next thousand years, highlighting a dramatic acceleration in global warming. We are now entering a phase of compound, cascading collapse, where climate, ecological, and societal systems destabilize through interlinked, self-reinforcing feedback loops.

We examine how human activities — such as deforestation, fossil fuel combustion, mass consumption, industrial agriculture, and land development — interact with ecological processes like thermal energy redistribution, carbon cycling, hydrological flow, biodiversity loss, and the spread of disease vectors. These interactions do not follow linear cause-and-effect patterns. Instead, they form complex, self-reinforcing feedback loops that can trigger rapid, system-wide transformations — often abruptly and without warning. Grasping these dynamics is crucial for accurately assessing global risks and developing effective strategies for long-term survival.

What Can I Do?
The single most important action you can take to help address the climate crisis is simple: stop burning fossil fuels. There are numerous actions you can take to contribute to saving the planet. Each person bears the responsibility to minimize pollution, discontinue the use of fossil fuels, reduce consumption, and foster a culture of love and care. The Butterfly Effect illustrates that a small change in one area can lead to significant alterations in conditions anywhere on the globe. Hence, the frequently heard statement that a fluttering butterfly in China can cause a hurricane in the Atlantic. Be a butterfly and affect the world.

→ “Solutions to the Fossil Fuel Economy and the Myths Accelerating Climate and Economic Collapse“

bookmark_borderHeat Stress, Environmental Stressors, and the Limits of Human Adaptability

A Follow-Up to Heat Stress, Human Survivability, and the Emerging Physiological Limits of Climate Change

http://membrane.com/global_warming/Heat-Survivability-Thresholds.html

Q: How Adaptable Are Humans to Rising Heat and Compounding Environmental Stressors?

A: Far less adaptable than many assume.

Modern humans (Homo sapiens) are approximately 200,000 years old, with some of our closest ancestral lineages dating back roughly 140,000 years. One of the oldest known oral traditions may provide a remarkable example of humanity’s long environmental memory: the story of the Seven Sisters of the Pleiades.

The Pleiades are a cluster of stars in the Taurus constellation. Today, six stars are easily visible to the naked eye, yet many ancient traditions across the world describe seven visible sisters. Some researchers suggest these stories may preserve observations from many tens of thousands of years ago, before stellar movement made the seventh star difficult to see without magnification.

Among the oldest continuous cultural traditions associated with the Pleiades are the Dreaming stories of Aboriginal Australians. These interconnected “songlines” span much of the Australian continent, linking ecological knowledge, astronomy, navigation, and seasonal cycles across dozens of language groups and cultures.

First Nations Australians are also among the earliest groups to recognize localized ecological disruptions associated with anthropogenic climate change. Their approximately 65,000 years of continuous connection to Country produced highly localized ecological calendars based not on fixed months, but on relationships among plants, animals, weather patterns, and stars. This deep environmental literacy enabled them to track subtle shifts in ecosystems long before modern climate science emerged.

Yet even populations with millennia of environmental adaptation have limits.

Although Aboriginal Australians survived in some of the harshest climates on Earth, they have not escaped the physiological and societal burdens associated with environmental stress. Today, Indigenous Australians continue to experience significantly lower life expectancy compared to non-Indigenous populations, reflecting the complex interaction of environmental, social, economic, and health stressors.

There are important lessons in this history:

Long-term adaptation over thousands of years is fundamentally different from rapid climate destabilization unfolding over mere decades.


Heat, Health, and Compounding Stressors

The dangers of rising temperatures extend far beyond mass casualty events during heatwaves.

Heat exposure increasingly functions as a chronic, whole-body stressor capable of degrading human health over time.

Recent analyses estimate that the average person now experiences roughly 19 days per year of potentially life-threatening heat exposure, with most of that increase attributable to human-caused climate warming.

The impacts extend well beyond heatstroke.

Prolonged exposure to elevated temperatures contributes to:

  • dehydration,
  • kidney injury,
  • cardiovascular strain,
  • worsening respiratory disease,
  • impaired sleep and recovery,
  • reduced labor productivity,
  • and increased mortality risk.

Emerging research also indicates that chronic heat exposure can accelerate biological aging by damaging tissues, impairing mitochondrial function, and shortening telomeres at the cellular level.

These processes are associated with elevated risks of:

  • diabetes,
  • dementia,
  • cardiovascular disease,
  • immune dysfunction,
  • and several forms of cancer.

Heat stress also significantly affects mental health, increasing rates of:

  • anxiety,
  • depression,
  • aggression,
  • cognitive impairment,
  • and suicide risk.

The cumulative burden of these stressors becomes even more dangerous when combined with pollution exposure, infectious disease, nutritional instability, and economic stress.


Adaptation Timescales Matter

Arguments that humans have “always adapted” to heat fundamentally misunderstand the timescale problem.

Human adaptation historically occurred across evolutionary and cultural timescales spanning thousands of years.

Modern climate destabilization is unfolding within decades.

This compression of time severely limits both biological adaptation and societal infrastructure response.

The challenge is not simply rising temperature — it is the accelerating interaction of multiple environmental stressors occurring simultaneously within highly interconnected systems.


Epigenetic Changes: The Molecular Convergence of Climate Stressors

One of the most important emerging areas of research involves epigenetics — chemical modifications that influence how genes are expressed without changing the underlying DNA sequence itself.

These mechanisms function somewhat like biological dimmer switches, activating or suppressing genetic pathways in response to environmental conditions.

Extreme heat, particularly when combined with:

  • air pollution,
  • wildfire smoke,
  • ozone exposure,
  • chronic stress,
  • and infections such as COVID-19,

is increasingly associated with epigenetic modification.

Research suggests these changes may influence genes linked to:

  • cancer,
  • diabetes,
  • cardiovascular disease,
  • neurological disorders,
  • inflammation,
  • immune regulation,
  • and accelerated aging.

Critically, when multiple environmental stressors occur simultaneously, their effects may not simply add together — they may compound through interacting biological feedback loops.

This molecular-level disruption may represent a shared underlying mechanism connecting many climate-related health threats.

The implications are profound.

Climate change may not only reduce lifespan through direct heat mortality, but also through the gradual amplification of chronic disease, immune dysfunction, cognitive decline, and systemic physiological stress across entire populations.

Researchers are also increasingly concerned about potential transgenerational effects, where environmentally induced epigenetic changes in one generation may influence disease susceptibility in the next.


Conclusion

Climate change is not simply an environmental crisis.

It is increasingly a physiological, neurological, immunological, and societal stress crisis operating across multiple interconnected systems simultaneously.

The question is no longer whether humans can survive occasional extreme heat events.

The emerging scientific question is:

How well can human biology, infrastructure, healthcare systems, economies, and societies adapt to accelerating, compounding environmental stressors occurring at historically unprecedented rates?

Current evidence suggests the limits may be approaching far sooner than previously assumed.

bookmark_borderThe Nonlinear Acceleration Framework: Collapsing Doubling Times in Climate Change Impacts

Climate Change Acceleration
A real good rule of thumb – climate impacts are accelerating at ~2^6-fold per decade.

What does that mean?
The Nonlinear Acceleration framework focuses on the rate of acceleration of climate change.

At the time the hypothesis was first developed in the 1990s, observed acceleration rates were closer to ~2^1-fold per century doubling behavior. More recent analyses across multiple independent datasets suggest much shorter characteristic timescales consistent with stronger feedback amplification of 2^6-fold on a decadal basis.

* a ~60× increase in the effective growth constant
* or about two orders of magnitude faster system amplification

depending on formulation and interpretation.

In plain language:
* the first regime behaves like a slow century-scale doubling process
* the second behaves like a rapidly amplifying nonlinear feedback system with collapsing doubling times.

Due to feedback amplification, the system may exhibit increasingly nonlinear behavior over time. In that context, higher-end warming outcomes become more dependent on feedback strength and system response.

Current ranges discussed in the literature generally include:
* Linear estimates: ~3–5°C
* Higher-feedback scenarios: ~6–9°C (upper-range plausible outcomes under strong feedback participation)
* Long-term high-impact pathways: >10°C over centuries (often discussed in “Hothouse Earth” framework contexts)

If you have any doubts, you can apply this “rule of thumb” framework across a wide range of observed climate indicators. It has been extensively examined against datasets involving:

* SLR (Sea Level Rise) doubling times
* Polar amplification * Temperature-gradient destabilization * Pressure-gradient amplification * Moisture-gradient amplification * Glacial retreat rates
* Arctic sea ice decline
* Surface and tropospheric temperature trends
* Greenland and Antarctic ice-sheet dynamic instability
* Ocean heat content and marine heatwaves
* Wildfire frequency and burned area
* Wildfire feedback amplification cycles
* Hydrological extremes and drought–flood “climate whiplash”
* AMOC weakening
* Atmospheric water-vapor amplification
* Atmospheric river intensity
* Ocean acidification
* Coral reef bleaching and dieoff
* Amazon rainforest dieback
* Boreal forest stress and biome migration
* Permafrost thaw and thermokarst collapse
* Zombie fires / overwintering fires
* Methane emissions from wetlands and thawing permafrost
* Crop yield instability
* Species range shifts and ecosystem reorganization
* Wet-bulb temperature exceedances
* Rossby wave amplification and persistence

The Nonlinear Acceleration Formula
Doubling time (discrete form):
Td = ln(2) / ln(1 + r)

Where:

Td = doubling time
r = fractional growth rate
ln = natural logarithm

With feedback, r is not constant, and a time-dependent formulation applies:

Td(t) = ln(2) / k(t)

Where k(t) evolves as system feedbacks strengthen.