bookmark_borderThe Climate Regime Is Changing: What the Hottest Month on Record Reveals

by Daniel Brouse

Introduction: The Climate Regime Is Changing

July 2026 was the hottest month ever recorded for the contiguous United States—but the most revealing record wasn’t the daytime heat.

It was the heat that didn’t go away at night.

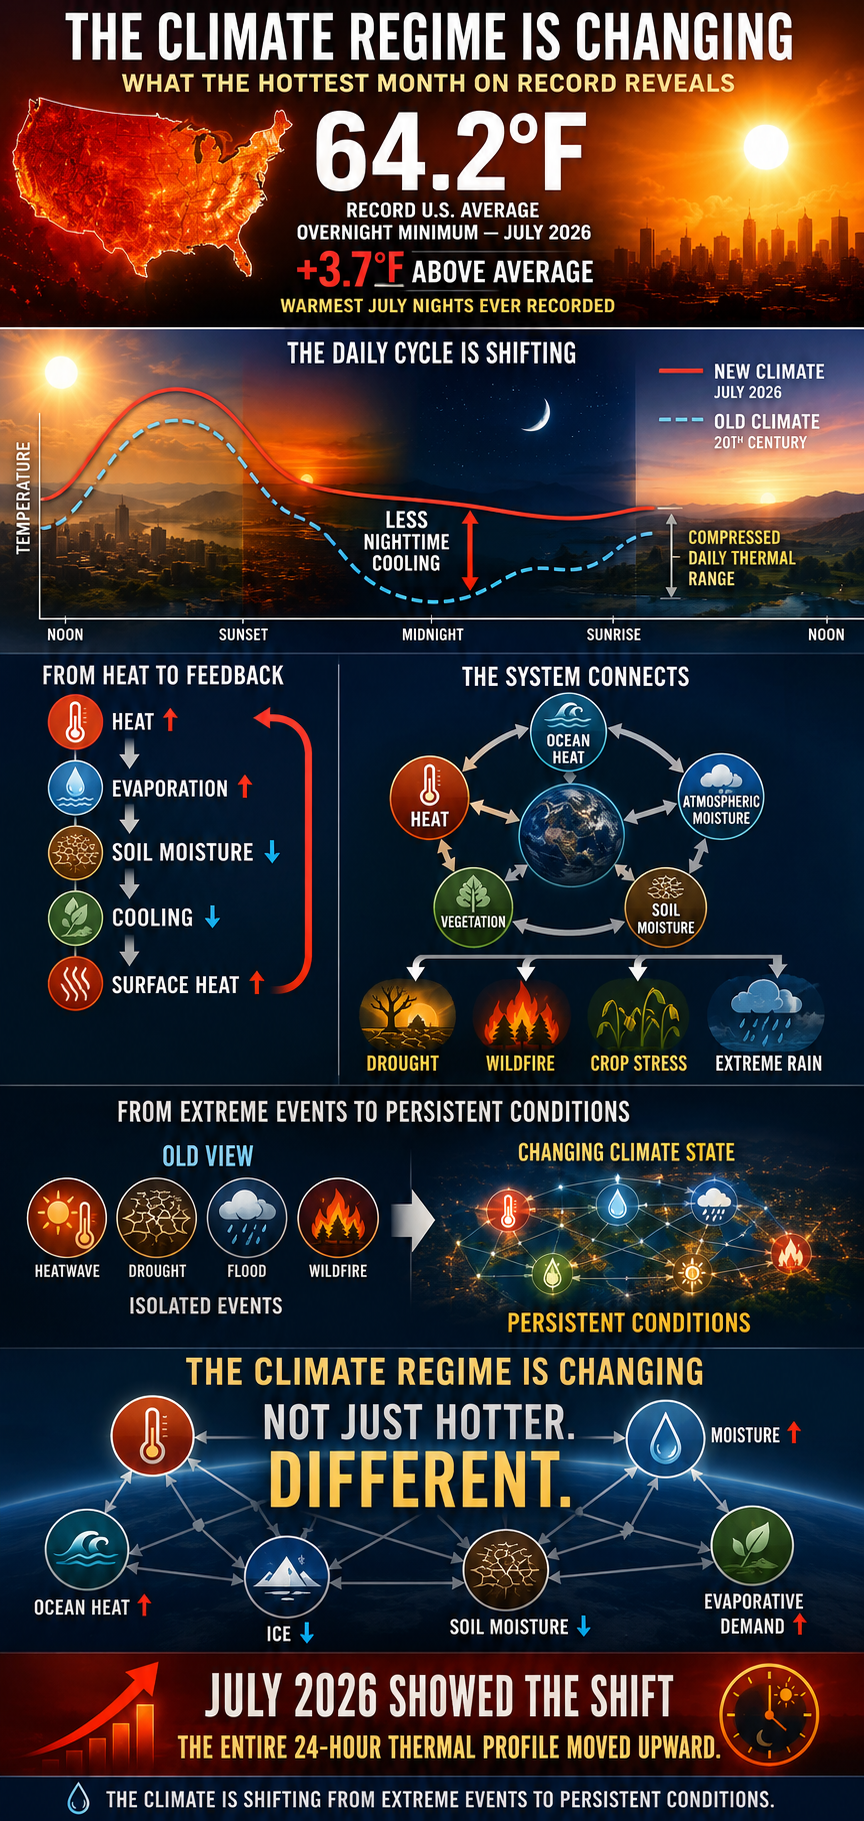
The average overnight minimum reached 64.2°F—3.7°F above average, setting a new U.S. record for the warmest average July minimum temperature.

That matters because nighttime cooling is part of the climate system’s ability to shed accumulated heat.

When nights stay warmer:

🌡️ The daily temperature range compresses.
💧 Evaporative demand increases.
🌱 Soil moisture declines faster.
🔥 Surface heating intensifies.
🌾 Vegetation and crops face greater stress.
🌧️ Atmospheric moisture interacts with a warmer atmosphere to alter precipitation extremes.

These aren’t isolated changes. They interact.

Heat + drought + soil moisture loss + wildfire + extreme precipitation are components of the same changing climate system.

July 2026 provides a striking example: the entire 24-hour temperature profile shifted upward.

The climate isn’t simply becoming hotter.

It’s becoming different.

#ClimateChange #ClimateScience #ExtremeHeat #GlobalWarming #July2026 #ClimateRegime #HeatWaves #ClimateRisk

The Climate Regime Is Changing: July 2026 and the Transformation of the 24-Hour Earth System

July 2026 was the hottest month ever recorded for the contiguous United States since national records began in 1895. The daytime heat was extraordinary, but the defining feature of the record was the heat that remained after sunset. The average overnight minimum temperature reached 64.2°F—3.7°F above average. That established the warmest average minimum temperature ever recorded for the contiguous United States, surpassing the previous record, set in July 2022, by 0.7°F.

This is more than another temperature record. It is a measurable change in how the climate system operates. A record daytime temperature shows that the surface became exceptionally hot. A record nighttime temperature demonstrates that the system retained an exceptional amount of that heat through the entire overnight period. The distinction is fundamental. Climate change is not simply producing more extreme temperatures within an otherwise familiar climate. It is changing the background conditions that govern the atmosphere, oceans, land surface, hydrological cycle, ecosystems, agriculture, infrastructure, and human health.

July 2026 therefore provides direct observational evidence of a changing thermal regime. The important signal is not simply how high temperatures reached during the afternoon. It is how little the system cooled before the next day began.

Nighttime temperatures reveal accumulated heat

Nighttime minimum temperatures provide a direct window into the thermal behavior of the surface-atmosphere system. After sunset, the land surface normally loses energy through infrared radiation, and the air near the surface cools. This daily cycle of heating and cooling is fundamental to Earth’s climate and to the biological and physical systems operating within it.

Daytime temperatures respond strongly to solar radiation, wind, soil moisture, cloud cover, and atmospheric circulation. Nighttime temperatures respond to these factors as well, but they also reveal how effectively the surface-atmosphere system releases accumulated heat. Greenhouse gases and water vapor absorb and re-emit infrared radiation, reducing the efficiency of radiative cooling. Atmospheric moisture, clouds, wind, soil conditions, and circulation further influence the amount of heat that remains near the surface overnight.

July 2026 demonstrates this change clearly. The United States did not simply experience exceptionally hot afternoons. It experienced exceptionally warm mornings. The average minimum temperature was 3.7°F above normal, producing a larger anomaly than the daytime temperature anomaly and establishing a national record.

The most important number in understanding the character of this event is therefore 64.2°F, not simply the daytime maximum.

That minimum temperature records the condition of the system after an entire day of heating and an entire night of attempted cooling. The system remained unusually warm at the point when it historically would have reached its daily minimum. That is a direct indication that the thermal baseline has shifted.

The daily thermal cycle is being compressed

Rising nighttime temperatures are changing the daily temperature cycle itself. A hot afternoon historically transitioned into a cooler night, allowing people, plants, animals, soils, buildings, and infrastructure to release accumulated heat. As nighttime temperatures rise, that recovery period becomes shorter and less effective.

The system increasingly moves from daytime heating into incomplete nighttime cooling and then immediately into another daytime heating cycle. The following morning begins with more residual heat. The next afternoon adds additional energy. The following night begins from an even warmer condition.

This creates persistence.

Weather variability can interrupt this process through clouds, precipitation, wind, or the arrival of cooler air. But a warmer climate baseline increases the probability of warm nights and reduces the frequency and duration of substantial overnight cooling.

The result is a compression of the daily thermal range. The upper temperature limit rises, but the lower temperature limit rises as well. The entire temperature distribution shifts upward.

Climate change therefore does not simply increase the height of the temperature peaks.

It raises the floor beneath them.

The climate system stores and transfers energy

The Earth system has enormous thermal memory. The atmosphere, oceans, land, soils, vegetation, ice, and built environment absorb, store, transport, and release energy continuously. The oceans dominate this energy storage because their heat capacity allows them to absorb and redistribute enormous quantities of energy.

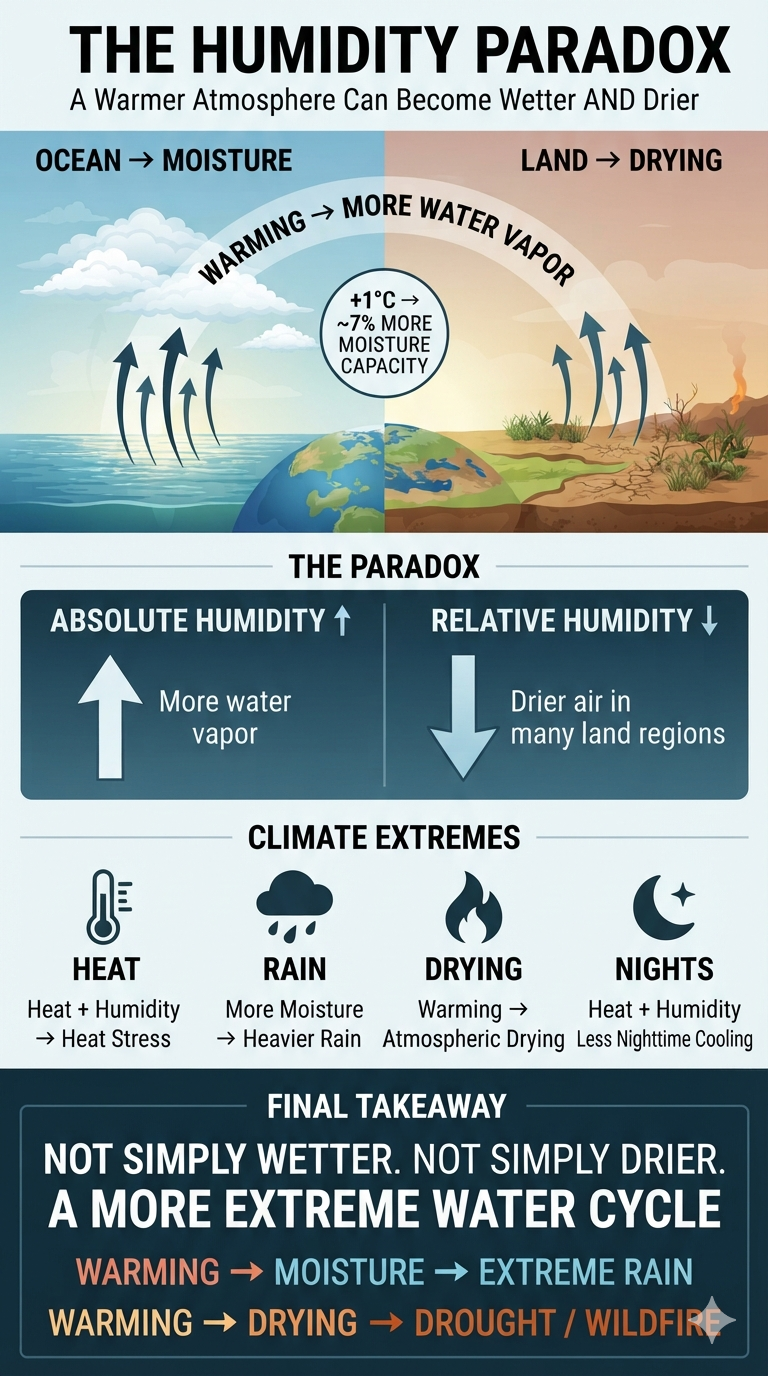
The atmosphere is changing at the same time. A warmer atmosphere can contain more water vapor, and water vapor is a greenhouse gas that absorbs and re-emits infrared radiation. Increased atmospheric moisture also changes cloud formation, precipitation, atmospheric instability, and the movement of latent heat.

The land surface stores heat as well. Urban areas, pavement, buildings, and other infrastructure remain warm after sunset. Soil moisture determines how much incoming energy is converted into evaporation versus sensible heat. When soils dry, evaporative cooling declines and a larger share of available energy remains as heat near the surface.

Temperature therefore reflects more than the conditions at a single moment. It reflects the accumulated state of a system that is continually absorbing, transporting, storing, and releasing energy.

Rising nighttime temperatures demonstrate that more of that energy remains within the coupled surface-atmosphere system through the overnight period.

The system begins the next day carrying more heat.

A warmer baseline changes the meaning of extreme

Climate extremes are defined relative to a baseline. When the baseline moves, the statistical meaning of an extreme changes with it.

A temperature that once occurred only during an exceptional event becomes more common when the entire distribution shifts upward. A nighttime temperature that once provided relief can become a source of physiological stress. A daytime temperature that once represented a rare heatwave can become increasingly probable.

This changes the character of heat itself.

A hot day followed by a cool night is fundamentally different from a hot day followed by another hot night. In the first case, the system experiences heating followed by recovery. In the second, heating is followed by incomplete recovery.

The difference accumulates over time.

For humans, elevated nighttime temperatures interfere with physiological recovery and sleep. For agriculture, warm nights increase plant respiration and reduce recovery from daytime heat. For buildings and infrastructure, warm nights reduce the opportunity to dissipate stored heat. For electrical systems, elevated nighttime temperatures prolong air-conditioning demand.

The impact of heat therefore depends not only on the maximum temperature reached but also on the amount of time the system remains thermally stressed.

The hydrological cycle is part of the transformation

Temperature is inseparable from the movement of water through the climate system. Warmer air can hold more water vapor. Increased atmospheric moisture changes evaporation, cloud formation, precipitation, and the transfer of latent heat.

Evaporation moves energy from the surface into the atmosphere. Condensation releases that energy back into the atmosphere. This continuous transfer of energy connects surface temperature with atmospheric moisture and precipitation.

Changes in soil moisture add another layer. When soils contain water, evaporation provides cooling. When soils dry, evaporative cooling declines. More incoming solar energy then remains available to heat the surface.

This produces a reinforcing interaction:

warming increases evaporative demand; evaporative demand dries soils; dry soils reduce evaporative cooling; reduced cooling increases surface heating.

The resulting heat can intensify drought, increase wildfire conditions, stress crops, reduce ecosystem resilience, and increase water demand.

The nighttime temperature record is therefore not an isolated atmospheric statistic. It is one visible component of a larger reorganization of energy and water within the Earth system.

Heat and soil moisture create interacting feedbacks

The relationship between heat and soil moisture demonstrates why climate change cannot be evaluated through individual variables in isolation.

A warm atmosphere increases the demand for water from soils and vegetation. Persistent heat accelerates evaporation and plant water use. As available moisture declines, evaporative cooling weakens. Surface temperatures then rise more efficiently.

The consequences propagate through the system.

Agriculture experiences increased water stress. Vegetation becomes more vulnerable to heat and drought. Dry landscapes become more susceptible to wildfire. Reduced vegetation and soil moisture alter the surface energy balance. Water supplies face greater demand at the same time that replenishment becomes less reliable in some regions.

These interactions create conditions in which the effects of warming reinforce one another.

The temperature record is therefore not the entire story. It is a measurement of one component within a network of coupled physical processes.

The transformation extends into infrastructure

The same thermal changes affect the built environment.

Buildings, roads, pavement, bridges, electrical equipment, and other infrastructure absorb heat during the day and normally release some of that energy overnight. When nighttime temperatures remain elevated, the cooling period becomes less effective.

Buildings begin the next day warmer. Air-conditioning systems operate longer. Electricity demand remains elevated for more hours. Equipment experiences prolonged thermal loading. Infrastructure designed around historical temperature ranges increasingly encounters conditions outside those assumptions.

The energy system is particularly sensitive to this change. A conventional heat event produces high afternoon demand followed by overnight relief. Persistent nighttime heat converts that pattern into sustained demand.

The difference is important because infrastructure responds not only to peak intensity but also to duration.

A system can withstand a short peak that becomes difficult to manage when the same stress persists for days.

From extreme events to persistent conditions

This is the central distinction between a changing climate and a collection of isolated weather records.

A heatwave occurs within a climate state. A drought occurs within a climate state. A flood occurs within a climate state. A wildfire occurs within a climate state.

When the climate state changes, the conditions surrounding every one of those events change.

Heat occurs over warmer oceans and a warmer atmosphere. Drought occurs under greater evaporative demand. Heavy precipitation occurs in an atmosphere capable of carrying more moisture. Wildfire occurs on landscapes increasingly exposed to heat and dryness. Extreme heat increasingly follows nights that provide less cooling.

The background condition becomes part of the event.

This transforms the risk profile.

A heatwave is no longer simply a period of unusually high daytime temperatures. It becomes a period of sustained thermal loading involving daytime heat, nighttime heat, humidity, soil moisture, water availability, electricity demand, human physiology, and ecological stress.

The system becomes more interconnected because the stresses occur simultaneously.

This is a change in climate regime

The term “climate regime” describes the statistical and physical conditions in which weather occurs. A regime changes when the underlying distribution and relationships among climate variables change sufficiently to alter system behavior.

That process is occurring now.

The baseline temperature is rising. Atmospheric moisture is increasing. Ocean heat is increasing. Ice is declining. Soil moisture is changing. Evaporative demand is increasing. Extreme precipitation is intensifying in many regions. Heat extremes are becoming more frequent and persistent.

These changes interact.

The result is not simply a warmer version of the old climate.

It is a climate system operating under different boundary conditions.

July 2026 provides a clear example because the change appears simultaneously at the top and bottom of the daily temperature cycle. The United States experienced record daytime heat and record nighttime warmth. The entire 24-hour thermal profile shifted upward.

That is the signature of a changing regime.

The rate of change is historically significant

Human civilization developed within a comparatively stable climate. Agriculture, cities, infrastructure, water systems, economies, and food networks evolved around climatic conditions that remained within relatively narrow ranges over the period in which civilization expanded.

Human activities are now changing the atmospheric composition and energy balance of the planet on a timescale measured in decades and centuries. Multiple Earth-system components are responding simultaneously.

The result is a rapid departure from the climatic conditions within which modern civilization developed.

The danger comes not only from the absolute temperature reached but from the rate at which the baseline is moving and the speed with which interconnected systems must adapt.

The climate is shifting from events to conditions

The most important conceptual change is the transition from thinking about climate change as a series of extreme events to understanding it as a transformation of persistent background conditions.

A heatwave does not occur independently of ocean temperature, atmospheric moisture, soil moisture, vegetation, and nighttime cooling. A drought does not occur independently of temperature and evaporative demand. A wildfire does not occur independently of heat, dryness, vegetation stress, and wind. A flood does not occur independently of atmospheric moisture and precipitation intensity.

The climate system connects them.

As the baseline changes, the relationships among these variables change as well.

This produces compound risks in which several stressors occur simultaneously. High temperatures combine with warm nights. Heat combines with drought. Drought combines with wildfire. Atmospheric moisture combines with extreme precipitation. Ocean heat combines with atmospheric instability.

The risk emerges from the interaction.

July 2026 demonstrates the transformation

July 2026 should therefore not be remembered simply as the month when the United States broke another temperature record.

It should be remembered as a month that demonstrated a change in the structure of the climate system itself.

The record was present in the daytime heat, but it was equally present in the nighttime minimum. The system heated more intensely and cooled less effectively. The thermal range compressed. The next day began from a warmer baseline.

That change affects everything connected to the temperature cycle: human health, sleep, agriculture, ecosystems, soil moisture, wildfire conditions, water demand, buildings, infrastructure, and electricity consumption.

The significance extends beyond July.

A climate system that retains more heat overnight operates differently from one that releases that heat efficiently. A climate system with warmer oceans, more atmospheric moisture, altered soil moisture, declining ice, and elevated temperatures operates differently from the system that existed when modern civilization developed.

The evidence is accumulating across multiple variables and multiple physical systems.

The fundamental change is therefore not simply that temperature records are being broken.

The baseline itself is moving.

The climate is becoming warmer throughout the 24-hour cycle. The atmosphere is carrying more energy and moisture. The land is experiencing changing water availability and evaporative demand. The oceans are storing more heat. Ecosystems and human systems are operating under increasingly different thermal conditions.

July 2026 makes that transformation visible in one of the simplest measurements possible: the temperature before sunrise. The record minimum temperature demonstrates that the climate system no longer resets to the same thermal state each night.

The heat carries forward. That is the deeper significance of the July 2026 record. We are not simply experiencing more extreme weather within the old climate regime.

We are changing the regime itself.

And the most important evidence of that transformation is not only found in how high the temperature rises.

It is found in how little it falls.
bookmark_borderJuly 2026: The Record Heat Was Especially Dangerous After Sunset

by Daniel Brouse

July 2026 was officially the hottest month ever recorded for the contiguous United States since national records began in 1895. According to the National Oceanic and Atmospheric Administration (NOAA), the average temperature across the Lower 48 reached 76.9°F—about 3.3°F above the 20th-century average and roughly 0.1–0.2°F warmer than the previous July records set during the Dust Bowl era in 1936 and the exceptional heat of 2012.

But the most important part of this record may not have been the daytime heat.

It was the heat that refused to leave at night.

The nighttime record is the real warning signal

July’s average daytime maximum temperature was 89.5°F, which was 2.9°F above average and ranked as the sixth-warmest month on record for average high temperatures.

The average overnight minimum temperature, however, reached 64.2°F—an extraordinary 3.7°F above average. That was the warmest average minimum temperature ever recorded for the contiguous United States, surpassing the previous record, set in July 2022, by 0.7°F.

That distinction matters.

A hot afternoon is dangerous, but a hot afternoon followed by a substantial nighttime cooldown gives the human body, vegetation, soils, buildings, infrastructure, and electrical systems an opportunity to recover.

When nighttime temperatures remain elevated, that recovery period disappears.

July 2026 therefore represents more than another record for daytime heat. It demonstrates an increasingly important characteristic of a warming climate: the thermal baseline is rising around the clock.

Why nighttime temperatures matter so much

Nighttime cooling is a fundamental part of Earth’s daily heat cycle.

After sunset, the land surface normally loses energy through infrared radiation. As the surface cools, the air near the ground cools as well. This produces the familiar drop from afternoon highs to early-morning lows.

Greenhouse-gas-driven warming interferes with that process. A warmer atmosphere contains more heat and can emit more infrared radiation back toward the surface. Increased atmospheric moisture can further enhance this effect because water vapor is itself a powerful greenhouse gas.

Cloud cover, humidity, soil moisture, wind, urbanization, and atmospheric circulation also influence how much the temperature falls overnight.

The result is not simply that afternoons become hotter. The floor beneath the temperature curve rises. That is critically important because the minimum temperature determines how much accumulated heat is actually released before the next day begins. If an afternoon reaches 100°F but the temperature falls to 65°F overnight, the body and environment experience a meaningful period of relief. If that same afternoon is followed by an 82°F night, the next day begins with the system already carrying a substantial heat load.

This is why nighttime warming can transform an episodic heatwave into a cumulative heat event.

The human body needs nighttime recovery

The human body is particularly vulnerable to persistent nighttime heat because sleep is one of the primary periods available for physiological recovery.

During sleep, the body normally reduces its core temperature. A hot bedroom makes that process more difficult. Higher nighttime temperatures can increase sweating, heart rate, dehydration, and thermal stress while disrupting normal sleep.

Research examining hundreds of thousands of U.S. respondents found that increases in nighttime temperatures were associated with more reports of insufficient sleep, with particularly strong effects during summer.

The consequences extend beyond simply feeling tired the next morning.

Repeated nights of inadequate sleep can impair cognitive performance, mood, immune function, metabolic regulation, and the ability to cope with additional heat stress.

Nighttime heat therefore creates a potentially dangerous cycle:

Hot day → inadequate nighttime cooling → poor sleep and incomplete recovery → greater vulnerability the next day → another hot day.

Research specifically examining nighttime warming has also found significant associations between hot nights and mortality. One modeling study concluded that nighttime warming could become an increasingly important component of future heat-related mortality, with the mortality risk on hot nights substantially higher than on days without hot nighttime conditions.

More recent multicountry research likewise finds that hot nights themselves contribute independently to heat-related mortality risk.

In other words, nighttime heat is not merely an inconvenience between two hot days. It is itself a health hazard.

The agricultural implications are equally important

Plants do not stop metabolizing when the sun goes down.

At night, plants continue to respire. They consume stored energy and undergo physiological processes that are essential for growth, reproduction, and recovery from daytime stress. When nighttime temperatures remain unusually high, respiration increases and plants can consume more of the carbohydrates they produced during the day.

Research involving wheat has demonstrated this effect experimentally. A field study found that artificially increasing nighttime temperatures by 2°C reduced grain yield, with yield declining by approximately 1.9% for every 1°C increase in nighttime temperature in the experiment.This is especially significant because nighttime warming can affect crops even when daytime temperatures do not become dramatically more extreme.

A crop can therefore experience a double burden:

More daytime heat stress + less nighttime physiological recovery.

Higher nighttime temperatures can also increase water loss and alter plant stomatal behavior, while warmer soils can accelerate moisture loss and biological activity. For agriculture, the problem is not simply the temperature at noon. It is the accumulated thermal stress across the entire 24-hour cycle.

Nighttime heat also keeps the landscape from resetting

The same principle applies beyond human beings and crops.

Soils need to cool.

Water bodies need to release heat.

Buildings need to dissipate stored heat.

Urban infrastructure needs to shed the energy accumulated during the day.

Even ecosystems depend upon daily temperature cycles.

When nights remain warm, all of these systems begin the following day from a higher thermal starting point.

This can become particularly important during prolonged heatwaves. Consider two hypothetical heatwaves with identical daytime highs:

Heatwave A:
100°F day → 65°F night → 100°F day → 65°F night

Heatwave B:
100°F day → 82°F night → 100°F day → 82°F night

The daytime maximum is identical.

But Heatwave B is vastly more difficult for people, plants, buildings, soils, and ecosystems because the system never receives the same opportunity to cool.

That is the hidden dimension of persistent heat.

Nighttime warming can amplify the consequences of daytime warming

It is important to be precise here: rising nighttime temperatures should not be described as a standalone climate “feedback” in the strict physical sense. Rather, nighttime warming is both a consequence of increased heat retention in the climate system and an amplifier of the impacts produced by daytime warming.

The distinction matters.

The physical climate system contains genuine feedbacks—such as increased atmospheric water vapor, declining snow and ice, and changes in soil moisture—that can amplify warming.

Nighttime warming is an important expression of those processes at the surface.

And once it occurs, it can amplify consequences across other systems.

For example:

Higher greenhouse-gas concentrations → greater atmospheric heat retention → warmer nights → less nighttime recovery → greater human heat stress → greater vulnerability to the next day’s heat.

A parallel agricultural pathway is:

Warmer nights → increased plant respiration and physiological stress → reduced recovery → lower productivity → greater vulnerability to subsequent heat and drought.

This is why minimum temperatures deserve far more attention than they traditionally receive.

The energy system feels it too

There is another important consequence: electricity demand.

Hot afternoons increase air-conditioning demand. But when temperatures remain high overnight, air conditioners continue operating long after sunset.

That extends the period of peak or elevated electricity demand and reduces the opportunity for buildings to naturally cool.

Instead of a system experiencing:

high demand → nighttime relief → recovery

the grid can experience:

high demand → continued overnight demand → high demand again.

This becomes especially problematic when multiple consecutive days and nights are exceptionally warm.

The result is a compound infrastructure stress rather than a single afternoon peak.

Nighttime temperatures reveal accumulated heat

There is also a deeper climate signal embedded in minimum temperatures.

Daytime temperatures can be strongly influenced by short-term weather conditions, including sunshine, wind, soil moisture, and atmospheric circulation. Minimum temperatures are also affected by these factors, but persistently elevated nighttime temperatures can reveal something particularly important: the atmosphere and surface are retaining more heat between sunset and sunrise.

That makes nighttime minimums an important indicator of how the climate system is changing.

July 2026 provides an extraordinary example.

The United States did not merely experience exceptionally hot afternoons.

It experienced exceptionally warm mornings.

The average minimum temperature was 3.7°F above normal—an even larger anomaly than the daytime maximum—and established a national record by a substantial margin.

That is why the July 2026 record deserves to be examined differently from a conventional heat record.

The most important number may be 64.2°F, not 89.5°F.

A warmer baseline changes what “extreme” means

There is another consequence that is easy to overlook.

As nighttime temperatures rise, the definition of a dangerous heat event changes.

Historically, a very hot day followed by a relatively cool night allowed the human body and natural systems to partially recover. But as the nighttime baseline rises, temperatures that once represented nighttime relief can themselves become hazardous.

The result is a compression of the daily thermal cycle.

The difference between daytime and nighttime temperatures becomes smaller, while the entire 24-hour temperature profile shifts upward. This means climate change is not simply producing more extreme peaks. It is elevating the entire thermal floor.

And once that floor rises sufficiently, heat becomes persistent rather than episodic.

July 2026 fits into a larger global pattern

The U.S. record occurred within an exceptionally warm global month. According to the Copernicus Climate Change Service, July 2026 was the joint-second-warmest July globally, tied with July 2024. Global ocean surface temperatures outside the polar regions were the highest recorded for any July, with developing El Niño conditions contributing to the unusually warm ocean state.

NOAA also reports that El Niño is continuing to strengthen and is expected to persist into early 2027, adding another natural source of variability to an already substantially warmer climate background.

El Niño can help explain why a particular period becomes exceptionally warm, but it does not explain away the long-term warming trend. Natural variability operates on top of a climate system whose baseline has been shifted upward by human-caused greenhouse-gas emissions.

That distinction is essential.

The warning hidden in the overnight record

July 2026 should therefore not be remembered simply as the month when the United States broke another temperature record. It should be remembered as a month when the nighttime thermal floor rose dramatically. The record daytime heat was dangerous. The record nighttime heat made it harder to recover from that danger.

For people, that means poorer sleep and greater cumulative heat stress. For agriculture, it means less nighttime recovery and additional physiological stress. For buildings and power systems, it means less overnight cooling and prolonged energy demand. For soils and ecosystems, it means less opportunity to shed accumulated heat.

And for the climate system itself, it is another indication that the traditional rhythm of hot day → cool night → recovery is being disrupted.

That is the significance of rising nighttime temperatures.

A hotter afternoon creates heat stress. A hotter night prevents the system from recovering from it.

When both happen repeatedly, heat stops behaving like a series of isolated events and begins behaving like a persistent environmental load.

That may ultimately be one of the most consequential—and least appreciated—features of a warming climate.

bookmark_borderFire Without Precedent: The Wildfire Escalation Reshaping the Pacific Northwest and Alaska

by Daniel Brouse

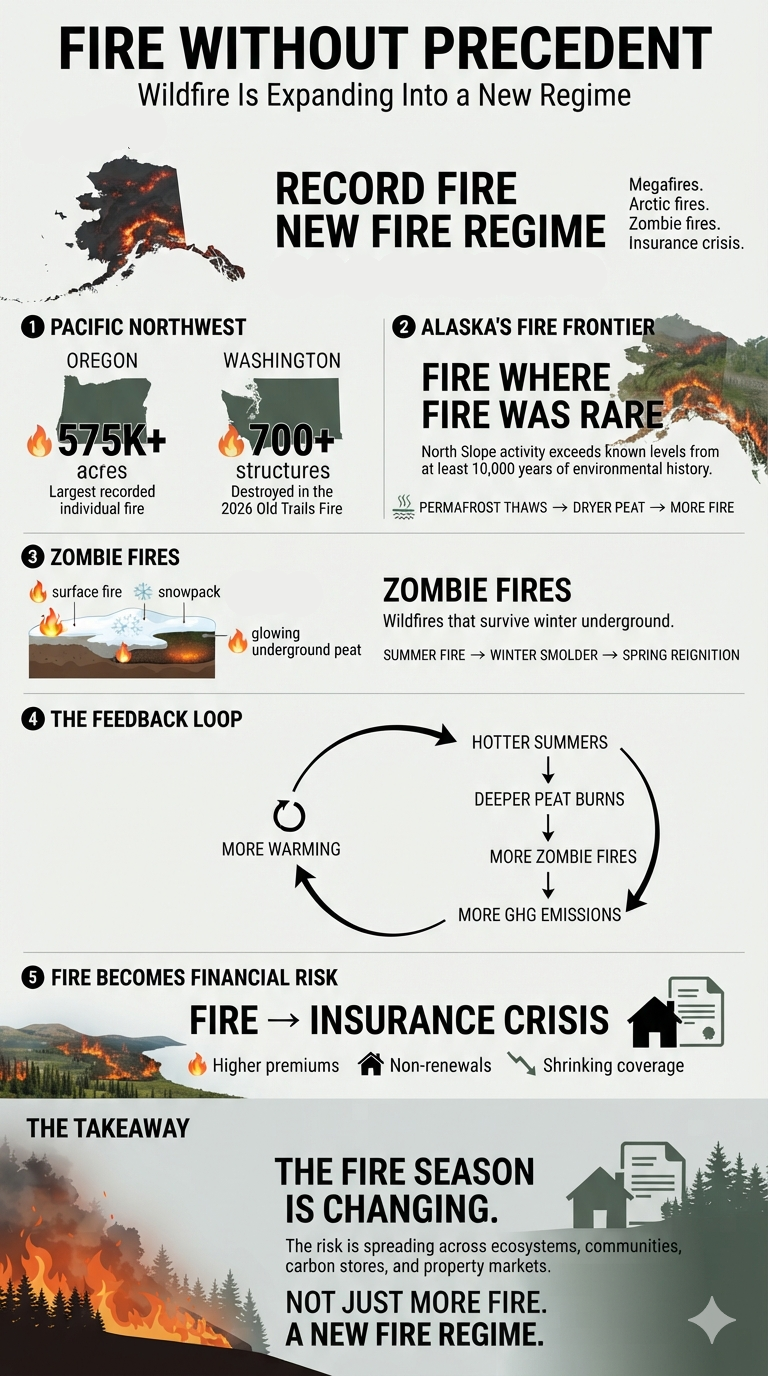
The 2026 wildfire season is rewriting the history of wildfire in Oregon, Washington, and Alaska. Record-setting megafires, increasingly unusual Arctic fires, overwintering “zombie fires,” and growing insurance losses reveal a wildfire regime that is expanding in both intensity and geographic reach.

From Oregon’s record-breaking Big Grass Fire to destructive fires around Spokane and unprecedented burning across Alaska’s tundra and boreal forests, the scale of change is becoming increasingly difficult to dismiss as simply another bad fire season.

Oregon’s Worst Wildfires

Oregon’s wildfire history is being rewritten by back-to-back extreme fire years, particularly in 2024 and 2026.

The Big Grass Fire (2026)

Burning 575,341 acres, the active Big Grass Fire has become the largest individual wildfire in recorded Oregon history by acreage.

The Long Draw Fire (2012)

The Long Draw Fire consumed 557,028 acres of rangeland in southeastern Oregon and previously held the modern state record.

The Biscuit Fire (2002)

The Biscuit Fire burned approximately 500,000 acres through southwestern Oregon’s Siskiyou National Forest, requiring a massive national firefighting response.

The Rowe Creek and Coleman Creek Fires (2026)

These two major fire complexes have burned approximately 372,971 and 308,721 acres, respectively, adding to an extraordinary season of large-scale burning.

The Labor Day Fires (2020)

Although not the largest Oregon fires by individual acreage, the 2020 Labor Day fires demonstrated how rapidly extreme weather can transform multiple fires into a statewide disaster. Severe winds drove simultaneous fires—including the Santiam and Almeda fires—that collectively burned more than 1 million acres, destroyed thousands of homes, and caused multiple fatalities.

Washington’s Worst Wildfires

Washington’s most intense historical fires have generally occurred in the state’s drier eastern regions. More recently, however, extreme fires have increasingly demonstrated their destructive potential at the wildland-urban interface.

The Okanogan Complex (2015)

The Okanogan Complex burned more than 304,000 acres, making it the largest wildfire complex in modern Washington history. Three wildland firefighters lost their lives.

The Carlton Complex (2014)

The Carlton Complex burned approximately 256,000 acres in the Methow Valley and destroyed about 300 homes, making it the state’s most destructive fire in terms of property loss at that time.

The Old Trails Fire (2026)

The catastrophic, human-caused Old Trails Fire near Spokane has consumed more than 700 structures, contributing to what is being described as Washington’s most destructive wildfire season on record.

The Sinlahekin Fire (2026)

This ongoing megafire has scorched more than 115,514 acres in Okanogan County.

The Gray and Oregon Fires (2023)

These two fast-moving fires in Spokane County destroyed a combined 710 structures, including 366 homes, and caused two deaths.

Cross-Border Blazes

Wildfires do not recognize state boundaries. The shared Columbia River border between Oregon and Washington can allow fire impacts to cross from one state to the other.

In 2017, the human-caused Eagle Creek Fire ignited in Oregon’s Columbia River Gorge, burned approximately 50,000 acres, and sent airborne embers across the river, igniting secondary fires in Washington.

Alaska’s New Wildfire Frontier

Alaska is experiencing another dimension of the wildfire transformation: fire is expanding into landscapes where large, persistent wildfires were historically exceptionally rare.

The North Slope tundra and portions of southwestern Alaska are experiencing wildfire activity that paleofire research suggests has no close parallel in the region’s known environmental history.

The North Slope Tundra

Historically, the Arctic tundra north of the Brooks Range was too cold, wet, and sparsely vegetated to sustain frequent large fires. Recent research indicates that North Slope wildfire activity during the past century has risen beyond anything observed in at least 3,000 years.

The drivers: Thawing permafrost is lowering local water tables and drying ancient peat layers that once acted as natural fire barriers. At the same time, warmer conditions are allowing woody shrubs to expand, creating additional fuel across the tundra.

The precedent: Modern megafires in this region—including the historic Anaktuvuk River Fire, which burned more than 400 square miles of tundra—represent a fundamentally different fire regime from what prevailed during much of the previous several millennia.

Southwestern Alaska: Yukon-Kuskokwim Delta and Bristol Bay

Southwestern Alaska has also historically experienced very little wildfire because of maritime moisture and tundra conditions.

That pattern is changing.

Millions of acres have burned across the region during recent consecutive fire seasons, including major events such as the Lime Complex and East Fork Fire.

Fires are now occurring as early as April and can burn deeply into organic-rich soils that have stored carbon for thousands of years.

The Yukon Flats

Farther south, in Alaska’s Interior boreal forest, the Yukon Flats ecoregion has experienced a dramatic increase in fire frequency and severity. Research indicates that recent fire activity has reached levels exceeding those seen at any point in approximately 10,000 years.

The ecological consequences extend beyond individual fires. Repeated severe burning can help convert ancient conifer-dominated spruce forests into more fire-adapted deciduous woodlands, potentially altering the region’s ecosystem for generations.

Zombie Fires: Wildfires That Survive the Winter

One of the most unusual consequences of Arctic and sub-Arctic warming is the rise of “zombie fires,” scientifically known as overwintering or holdover fires.

These fires can continue burning underground through the freezing winter and then reemerge at the surface the following spring. Instead of being extinguished by rain and heavy snow, they remain hidden beneath the surface until conditions become favorable for renewed combustion.

How a Fire Survives Under Ice and Snow

Zombie fires depend heavily on the unique composition of Arctic and sub-Arctic soils.

The fuel layer: Boreal and tundra ecosystems contain thick layers of peat and decomposing organic material. Peat is highly compacted, carbon-rich, and capable of sustaining slow, persistent combustion.

Low-oxygen smoldering: When a summer wildfire penetrates deeply into peat, it can transition from an open flame to underground smoldering. The winter snowpack restricts oxygen availability without necessarily extinguishing the fire, allowing it to move slowly through roots and organic matter even while surface temperatures plunge far below freezing.

Spontaneous combustion: Research has also identified another potential mechanism. Rapid spring warming can accelerate microbial decomposition within peat, producing heat that may contribute to spontaneous ignition under certain conditions.

Why Zombie Fires Challenge Fire Management

Fire managers once viewed overwintering fires as rare anomalies. Increasing observations suggest they may be becoming a more important source of new wildfire ignitions across Alaska, northern Canada, and Siberia.

An early start to fire season: Zombie fires can reemerge in April or May, weeks before the traditional summer lightning season. This can place additional demands on firefighting resources before seasonal crews are fully deployed.

An invisible threat: While buried, these fires can produce little visible flame and relatively little surface heat, making detection difficult. Firefighters may not discover them until they emerge along the edges of previous burn scars.

Booby-trapped landscapes: As underground fires consume roots and peat, they can hollow out sections of the ground. The resulting landscape can contain extensive areas of fallen trees and unstable soil, creating dangerous conditions for helicopters and ground crews.

The Climate Feedback Loop

The most consequential concern may be what these fires release into the atmosphere.

Peatlands store enormous quantities of carbon. When zombie fires smolder through peat for months, they can release carbon dioxide (CO₂), carbon monoxide (CO), and potentially methane (CH₄), adding greenhouse gases to the atmosphere.

That creates the potential for a reinforcing feedback loop:

Hotter summers → deeper peat fires → more overwintering fires → greater greenhouse-gas emissions → additional warming.

The concern is not simply that the Arctic is burning more. It is that warming can alter the underlying conditions that determine where, when, and how fire can persist.

Wildfire Is Becoming an Insurance Crisis

The intensifying wildfire seasons across the Western United States are also triggering a severe property-insurance crisis, characterized by soaring premiums, policy non-renewals, and increasingly stringent requirements for homes in fire-prone areas.

Major nationwide insurers, including State Farm and Allstate, have been pulling back from or reducing exposure to some high-risk Western markets as they attempt to limit catastrophic wildfire losses.

The effects differ considerably among Oregon, Washington, and Alaska because of differences in fire activity, population exposure, and state regulation.

Oregon: Pushed Toward the Brink

Oregon’s insurance market is under increasing pressure following consecutive years of severe wildfire activity.

Premium surges: Homeowners in Central Oregon, along the Oregon Coast, and on rural acreage properties are facing renewal increases ranging from 50% to more than 100%.

Statewide non-renewals: Some carriers are dropping entire ZIP codes, leaving rural homeowners increasingly dependent on high-cost, bare-bones “last-resort” insurance pools.

Regulatory intervention: Under S.B. 82, insurers must provide clear and detailed notices explaining the wildfire risk factors contributing to a cancellation or premium increase.

During the active 2026 fire season, the Oregon Division of Financial Regulation issued an emergency order pausing home-insurance cancellations and non-renewals through August 2026 in affected areas.

Local governments are also responding. Deschutes County, for example, has adopted the R327 building code, which requires newly constructed or remodeled homes to incorporate features such as ember-resistant vents and Class A roofing to improve wildfire resilience and eligibility for specialty insurance markets.

Washington: Post-Spokane Instability

Before August 2026, Washington’s property-insurance market had been showing signs of stabilization. The devastating Old Trails Fire near Spokane, however, has injected new volatility into the market.

The Spokane drop-off: Data indicate that after severe fire seasons, Washington insurers have dropped or canceled policies on more than a third of fire-impacted properties, while Spokane County has experienced a 65% increase in non-renewals.

Risk-score friction: Insurers increasingly use wildfire-risk scores to price policies. A 2026 legislative effort backed by the Washington Office of the Insurance Commissioner sought greater transparency and an appeals process for consumers. The bill passed the Senate 48–1 but ultimately stalled in the House.

Mandated baseline coverage: Washington law requires standard homeowners policies to cover basic fire, smoke, and soot damage under terms that meet or exceed the state’s official model policy. Yet obtaining new coverage in a high-risk area has become increasingly difficult.

Alaska: The Emerging Insurance Frontier

Alaska has not yet experienced the widespread homeowner-insurance collapse seen in some other high-risk Western markets. But the underlying risk profile is changing.

Lagging actuarial models: Many legacy underwriting maps continue to assess Alaska through a historical lens—one that assumes an Arctic environment with relatively low structural wildfire risk.

The tundra shift: Much of Alaska’s recent extreme fire activity has occurred in remote wilderness rather than heavily populated residential areas. As a result, structural losses remain comparatively limited.

Future vulnerability: The situation could change as tundra and Interior fires move closer to isolated communities and population centers such as Fairbanks. Insurance brokers anticipate that carriers could respond with tighter underwriting standards and higher deductibles for smoke and fire damage in vulnerable wildland-urban interface areas.

From Wildfire Season to a New Fire Regime

The story unfolding across Oregon, Washington, and Alaska is larger than a collection of record-breaking fires.

It is a shift in the conditions under which fire operates.

Oregon is experiencing record-scale megafires. Washington is confronting increasing destruction at the wildland-urban interface. Alaska is seeing fire penetrate ecosystems where large fires were historically rare. And beneath the surface, overwintering fires are extending the wildfire season beyond the traditional summer window.

The consequences do not stop when the flames disappear. They reach into forests, soils, carbon stores, communities, property markets, and the insurance system itself.

The question is no longer simply how bad the next wildfire season will be.

It is whether the wildfire regime itself is changing faster than our ecosystems, infrastructure, insurers, and communities can adapt.

bookmark_borderIntegrated Climate Stewardship: The Fossil Fuel Question and Answer

Question:

I use phasing out in a way that means completely ending the use and production of fossil fuels down to zero. Phasing down means a gradual reduction or scaling back in FF use over time without specifying a complete stop. Would add or alter that in any way?

How would you define differntiate ‘transition away’?

Reply:

I would slightly modify your definition of “phasing down” to: “a gradual reduction or scaling back in fossil-fuel use over time without specifying a date for complete cessation.”

There are really two separate issues for me:

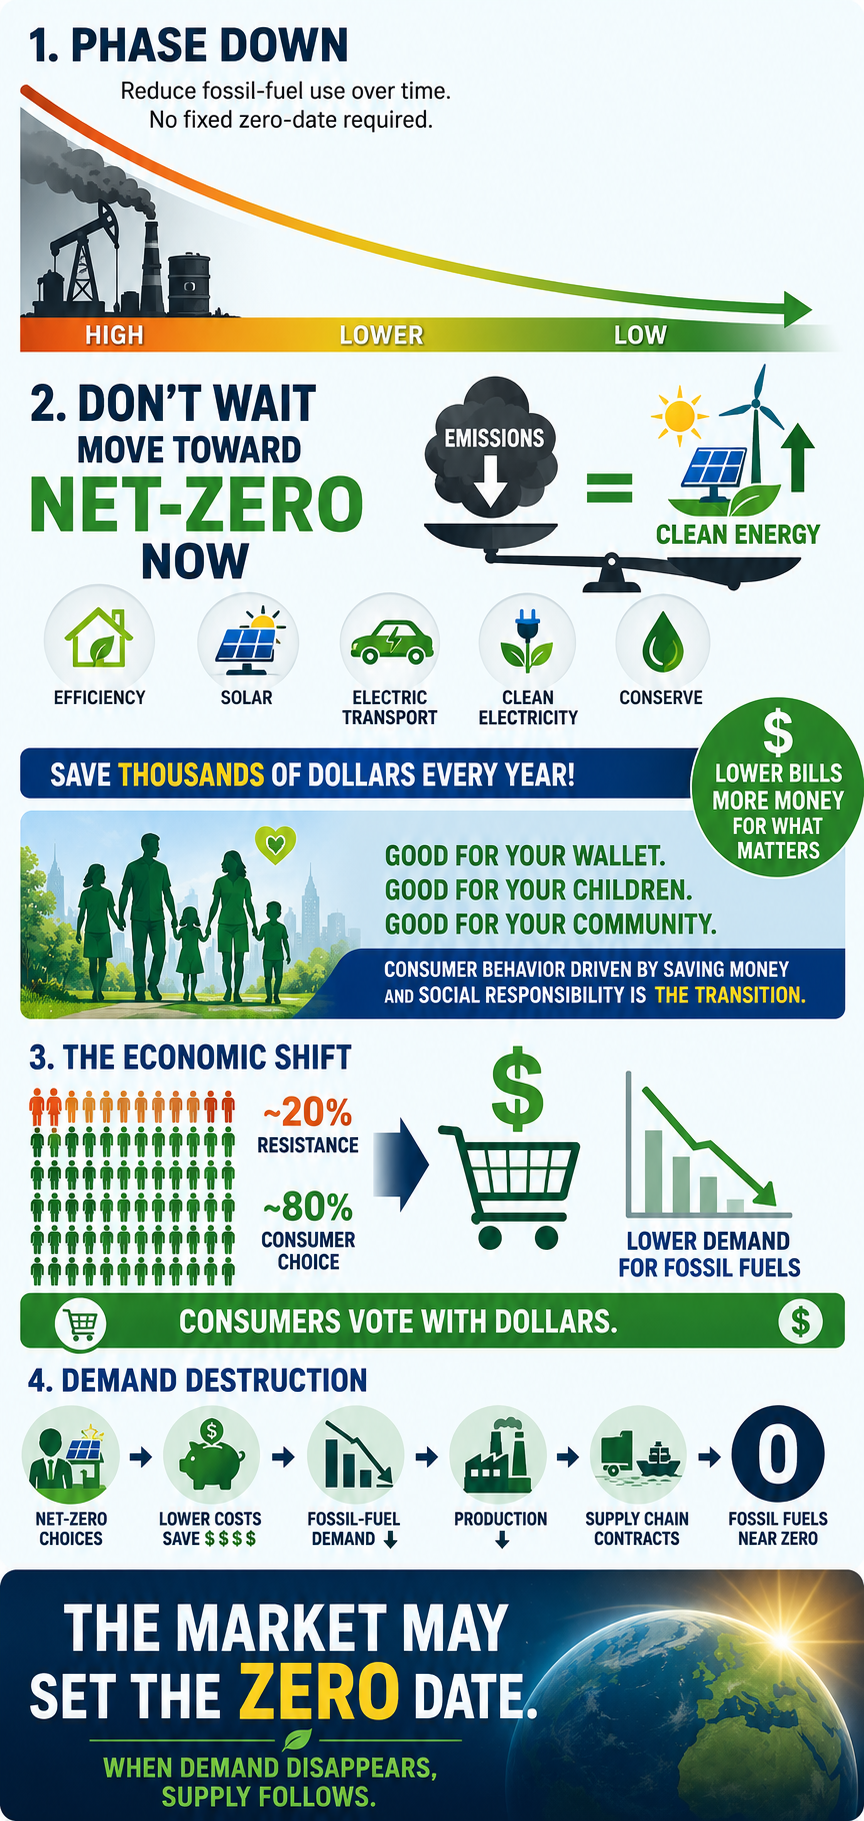
1. For this generation, I prefer net-zero carbon emissions as the immediate goal. If someone isn’t already moving toward net-zero, I think they should start now. We don’t need to wait for a theoretical future phase-out date to begin reducing emissions.

2. As both a climatologist and an economist, I’m not convinced that setting a specific date for the complete elimination of fossil fuels is ultimately what matters. In the U.S., roughly 20% of the population appears ideologically committed to policies that would accelerate climate change. Nothing I say or do is likely to change that.

But that still leaves roughly 80% of the population—and I think economics is going to do much of the work.

Right now, perhaps only ~0.5% of Americans are seriously attempting a structured net-zero lifestyle through continuous behavioral reductions and intentional balancing. As more people discover that net-zero can actually save them thousands of dollars a year while also leaving a better environment for their children and grandchildren, I expect consumer behavior to change.

When the remaining ~79.5% begin voting with their dollars, fossil-fuel demand will fall. That creates demand destruction, which ultimately means suppliers will have less and less reason to produce fossil fuels.

So, ironically, I don’t think we necessarily need to establish the exact date when fossil fuels reach zero. The market may establish that date for us. The “complete stop” happens when there is no longer sufficient demand to sustain the fossil-fuel supply chain.

Question:

When you use the term net zero is it with the understanding that the “net” component allows continuous greenhouse gas emissions under the assumption that unproven removal technologies or flawed offsets will balance them out later, delaying necessary fossil fuel phaseouts?

Net zero is a contentious term within my community and I want to be clear that I understand how you see and apply it.

Reply:

That’s an important distinction. When I use the term net-zero, I’m talking about it at the personal/lifestyle level, and I am not using “net” to justify continuing to emit greenhouse gases while assuming that unproven technologies or questionable offsets will clean up the problem later.

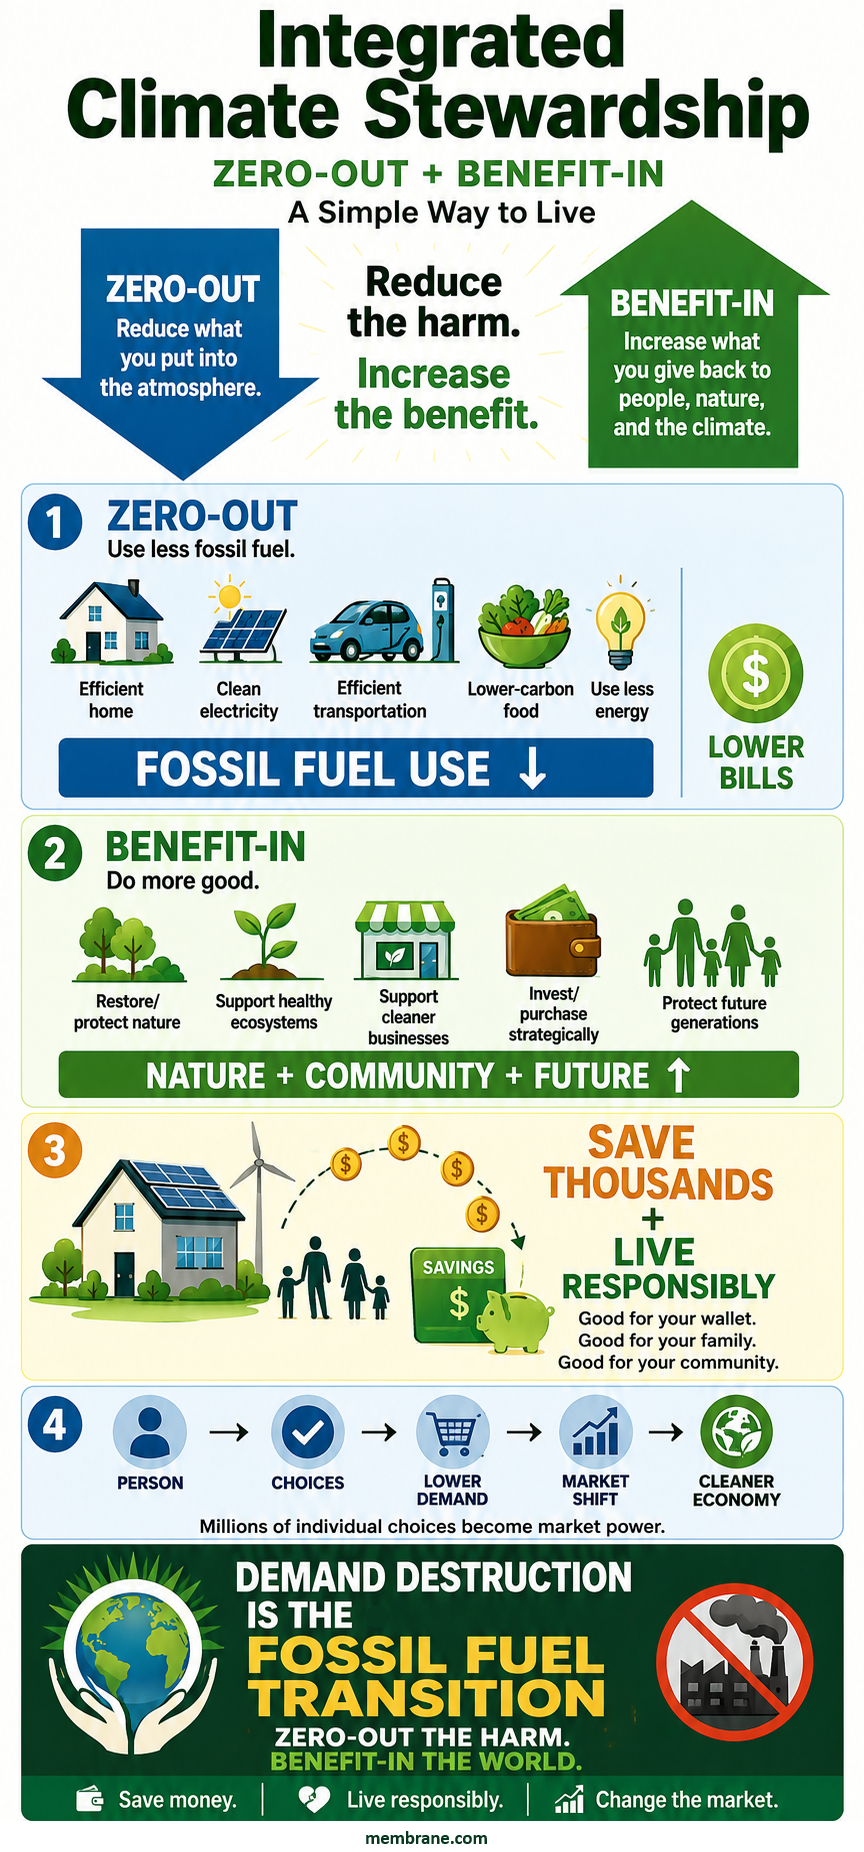
What I mean is closer to “Holistic Net-Zero Living” or “Integrated Climate Stewardship”: reducing and, wherever realistically possible, zeroing out the emissions associated with my own lifestyle first, while also taking responsibility for the impacts I can’t immediately eliminate.

For me, that means a 360-degree carbon strategy:

ZEROING OUT / STRUCTURAL DECARBONIZATION

  • Electrifying transportation and home energy
  • Increasing energy efficiency
  • Using clean electricity
  • Reducing fossil-fuel consumption as close to zero as practical
  • Reducing high-carbon consumption, including dietary choices

BEYOND MY DIRECT FOOTPRINT

  • Supporting ecosystem restoration and conservation
  • Protecting forests and biodiversity
  • Supporting businesses and technologies that accelerate decarbonization
  • Using my purchasing and investment decisions to create economic demand for cleaner alternatives

So I’m not saying, “Keep emitting and someone will remove it later.” Quite the opposite. The first priority is eliminating the emissions themselves.

I think of the “net” component as recognizing that an individual cannot instantly eliminate every indirect emission associated with modern life. Rather than pretending those emissions don’t exist, I try to compensate through additional positive actions while continuously working to reduce the underlying footprint.

Ultimately, my goal isn’t simply to achieve a favorable carbon-accounting number. It’s to change the way I live so that my actual fossil-fuel demand approaches zero—and to use my economic choices to help make that transition happen systemically.

That’s why I sometimes think “holistic net-zero living” or “integrated climate stewardship” communicates what I mean better than simply saying “net-zero.”

Question:

Why continue using the language of ‘net zero’? What economic model do you see best aligns w/ what you have outlined?

Reply:

Haaha… good questions.

A: I’m actually in the process of writing the paper that officially changes my language from “net-zero” to “Integrated Climate Stewardship.” So thank you for pushing me on that. I think the new terminology better captures what I’ve been trying to describe.

B: I’m also working on the economic model, and that one is considerably trickier—not because of the terminology, but because AI is changing the underlying economics so rapidly.

I see AI as a double-edged sword. On one edge, as AI replaces more human labor and productivity, the human contribution to economic production could eventually become a much smaller share of GDP. AI may also be capable of producing enormous amounts of economic value with far less energy per unit of output than traditional human labor and many existing production systems.

But the other edge of that sword is wealth distribution.

If the ownership of AI, capital, and productive capacity becomes increasingly concentrated, we could see extraordinary productivity growth occurring alongside increasingly unjust wealth inequality. We could potentially solve one problem—resource and energy efficiency—while creating another: who actually owns and benefits from the productivity?

That’s the economic model I’m wrestling with now: how do we build an economy where AI-driven productivity, decarbonization, consumer savings, and environmental stewardship reinforce each other while the resulting wealth is broadly distributed?

That may ultimately be a much bigger economic question than the climate transition itself.

Question:

Have you been sitting with the economic of degrowth in all of this then? Sounds like there is that tension in what is being considered.

Reply:

Yes. I’ve been sitting with the economics of degrowth quite a bit. And I think there’s an interesting tension here.

Traditional capitalism is fundamentally tied to population growth, human labor, productivity, and consumption. But AI potentially breaks that relationship. If technology increasingly replaces human labor, then economic growth can continue—even accelerate—while the economic value of human labor declines, perhaps dramatically.

So I’m not sure the future necessarily looks like “degrowth.” It may be something stranger: exponential technological growth occurring alongside declining human labor demand, an aging population in the developed regions of the world, and potentially declining population worldwide.

That raises a much bigger question: if human labor is no longer the primary engine of economic value, what exactly are we trying to maximize—and how should the economy distribute the benefits of that productivity?

That’s the economic model I’m wrestling with right now.

Question:

What about lands and waters in these considerations?

Can we agree that what we need must be either mined or grown?

Raw materials come from somewhere with significant externalities — often left out of economic theory.

My other issue is the assumptive ghost of interest-bearing-debt as a driver of unnecessary growth.

Reply:

Yes—and I think land, water, and raw materials have to be part of the model. My initial modeling, however, is pointing toward a very different problem than the one we traditionally assume.

If AI continues improving itself, productivity could eventually become extraordinarily resource-efficient. Very little additional human labor—and potentially much less land, water, or energy per unit of economic output—may be required for productivity and growth. At the same time, consumers could be forced to consume much less because their income from labor is declining. And as solar and other clean-energy technologies continue becoming cheaper, the pressure for some forms of mining and extraction could decline as well.

That brings me back to your point about interest-bearing debt. I think sovereign debt may become the critical part of the equation.

Productivity gains and abundant cheap clean energy are profoundly deflationary. Deflation sounds wonderful for consumers in theory—but not if it is accompanied by collapsing labor income. You could have falling costs and prices while households simultaneously lose the purchasing power needed to buy anything.

Now add governments facing enormous debt obligations while their traditional tax base is shrinking because human labor is becoming less economically valuable. Governments could increasingly rely on interest-bearing debt to finance poverty reduction, redistribution, and some form of basic income.

And that creates a potentially nasty feedback loop: AI-driven productivity → declining labor income → shrinking tax base → rising sovereign debt → greater reliance on monetary expansion → inflationary pressure.

Historically, severe sovereign debt problems have sometimes been resolved through substantial currency devaluation and inflation. I’m not saying hyperinflation is inevitable—but it is one of the risks I’m now modeling.

The really strange possibility is that we could simultaneously have exponential productivity, increasingly abundant cheap energy, falling costs of production—and increasing economic hardship for ordinary people.

In other words, the problem may not ultimately be whether the planet can produce enough. It may be whether humans can maintain enough income, purchasing power, and economic agency to participate in the abundance that AI creates.

That, to me, is where the economic model gets really interesting.

bookmark_borderRocky Rex Climate Climax

One way into discussing climate change as a whole is to refer to the water cycle, because most people learned about it at school.

The water cycle is now supercharged by extra heat in the oceans.

Warmer seas produce more evaporation – and that extra water vapour* carries the extra heat high into the air. The water vapour then releases the extra heat into high-altitude air as it condenses to make clouds. So weather systems are becoming more energetic, more chaotic. Like other aspects of the climate systems, the water cycle seems to be creating more extremes – prolonged droughts, and also sudden huge rainfall events.

*7% more water vapour for each extra 1 C degree of average global temperature, so we’ve added about 10% at this point. Changes of state (such as evaporation and condensation) involve lots of heat – in physics this is called latent heat.


Our system gives no value to global commons such as the atmosphere or the oceans, because they are not seen as “scarce commodities”. One oak tree does not matter, because there are vast numbers of oak trees.

Pumping sewage into the sea doesn’t matter, because the sea is too big for it to matter.

Pumping CO2 into the air doesn’t matter, because the air is limitless.*

This is a mythological view of the world, and generally people prefer myths to facts, because facts don’t obey wishes.

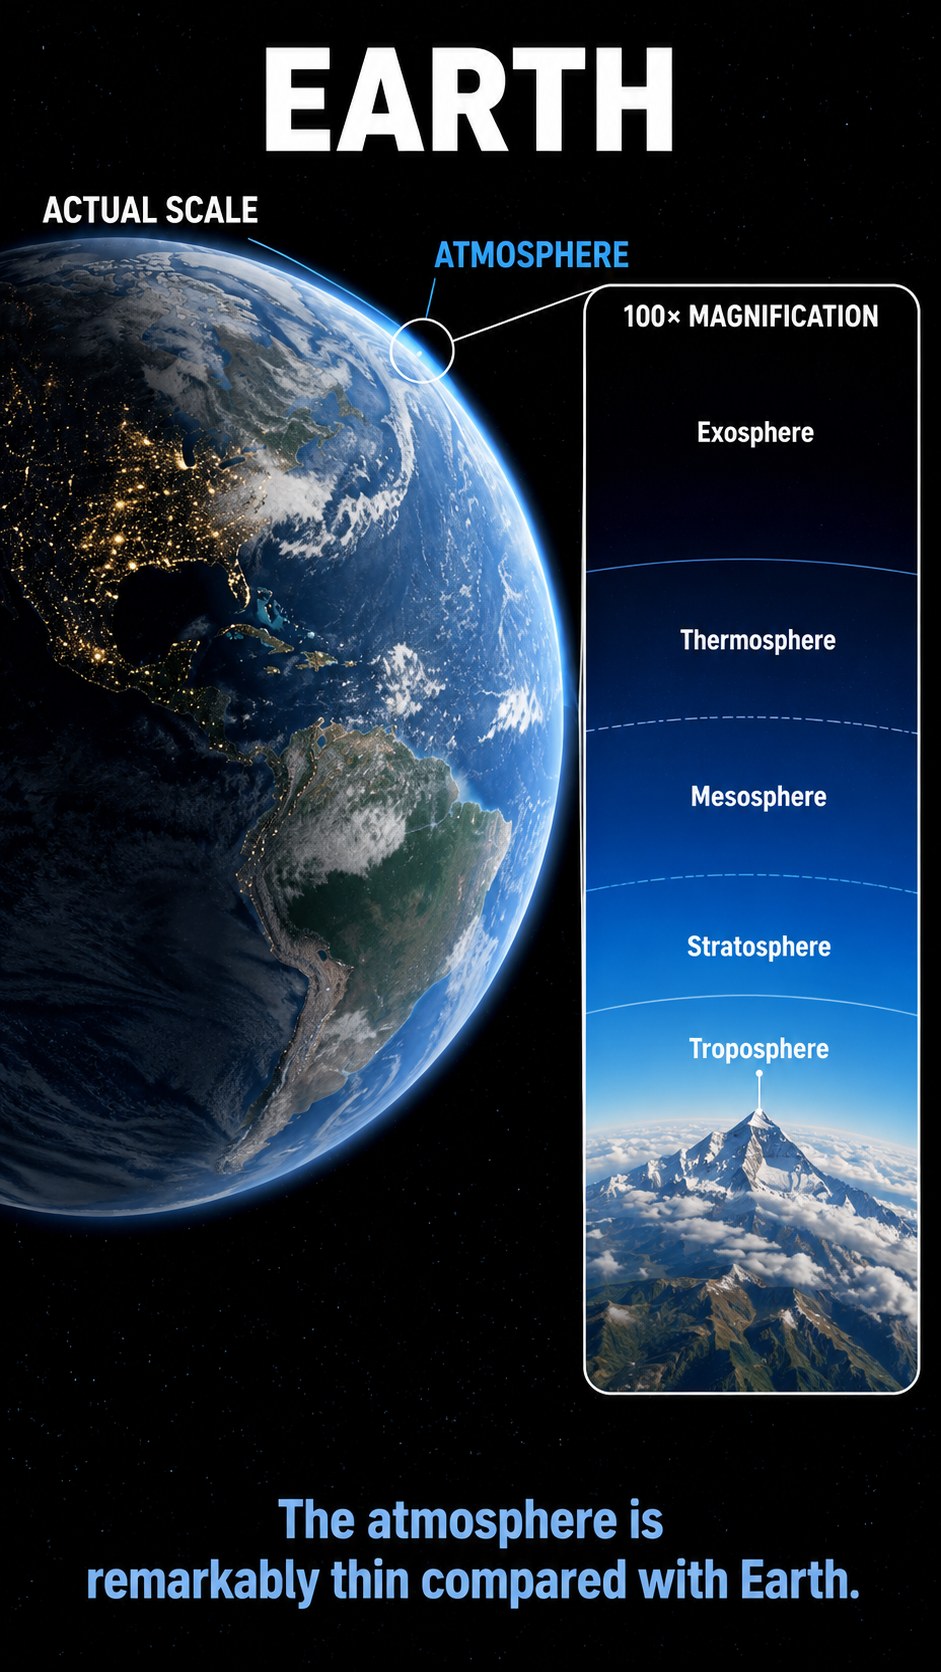
*In fact if there was a lift that could travel vertically at the speed of a fast car, within minutes you’d need breathing equipment.

— Rocky Rex


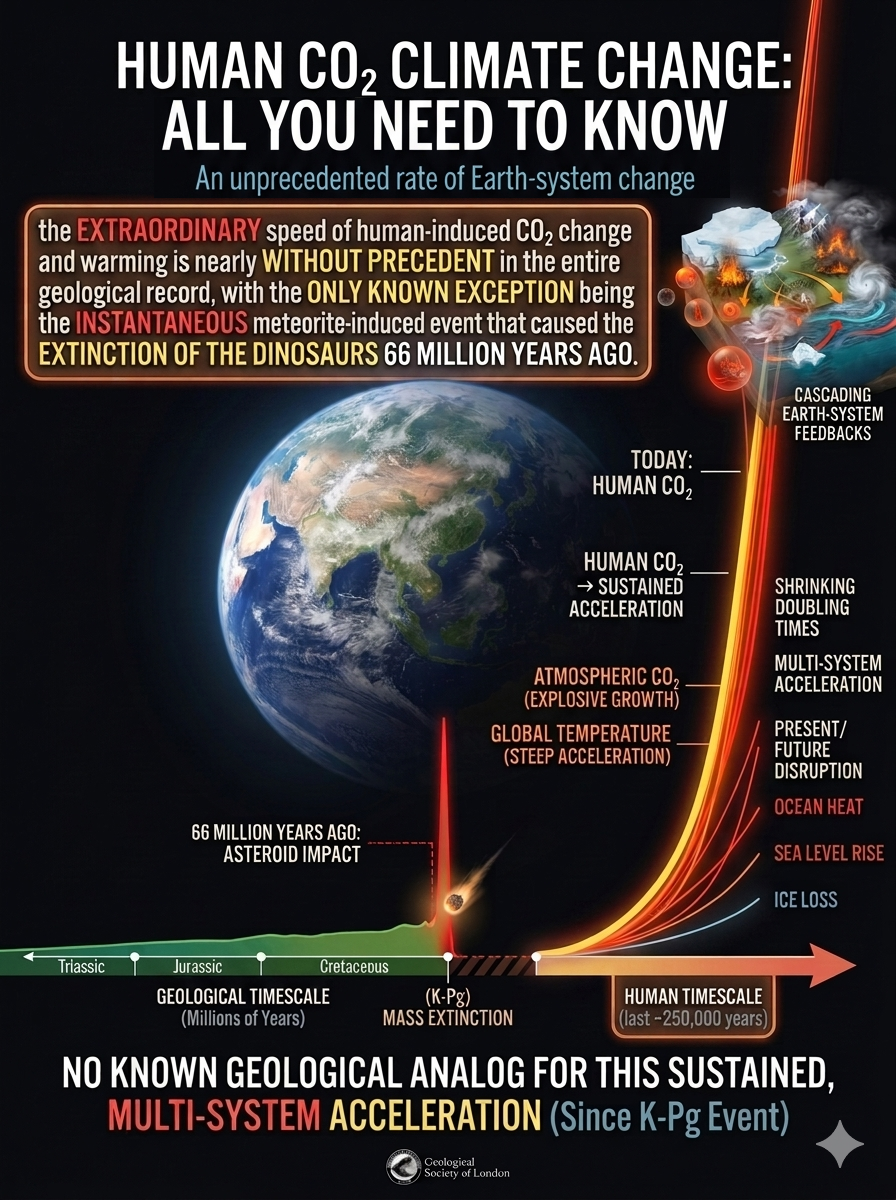
Human CO2 Climate Change: All You Need to Know
An unprecedented rate of Earth-system change.

The Geological Society of London (the UK’s expert association of professional geologists since 1807) says:

” ….the current speed of human-induced CO2 change and warming is nearly without precedent in the entire geological record, with the only known exception being the instantaneous, meteorite-induced event that caused the extinction of non-bird-like dinosaurs 66 million years ago” (H/T Rocky Rex)

We’ve arrived at a very similar observation in our own work, but I don’t think I’ve seen it stated this clearly—or published elsewhere. Thanks, Rocky, for helping to illuminate it.

Juxtapose the two and let me know whether the comparison can be communicated more effectively.

Multiple climate indicators now point to rates of warming-related disruption far beyond those observed during the modern instrumental era.

There is no well-established geological analog for a sustained, multi-variable, decade-scale pattern of accelerating change across the full Earth system at the resolution available in contemporary observations. If sustained, this may represent one of the most abrupt large-scale climate transitions in Earth’s geological history.

Rocky replied:

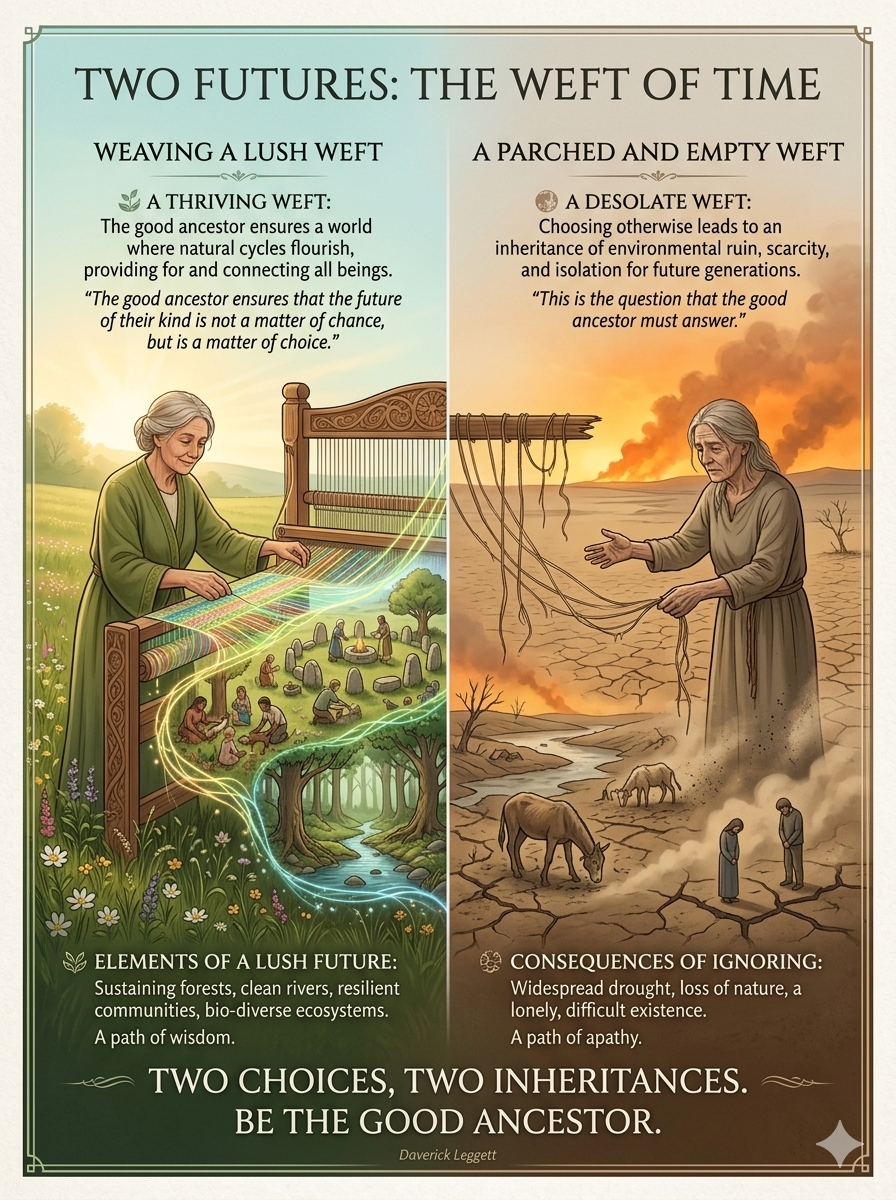
I’ve been citing that for a long time, and I’m always impressed by how many people can totally ignore it. It’s very much the scientific version of “The Good Ancestor” poem, it should hit people between the eyes and wake them up. All the signs are that we are entering an abrupt climate change process. Have I told you this true story before?

In the mid 1950s, Russell Coope was looking for a PhD project after graduating as a geologist. He noticed beetle remains in ice age deposits in a gravel pit in the UK Midlands. His supervisor, Prof Fred Shotton, said something like: “I expect they are just modern beetles that have got stuck to the surface.” Fred was wrong – a rare event.

Coope decided to base his PhD on recording what kinds of beetles there were in different ice age deposits, to see where it led. He discovered that the mix of beetles was linked to the temperatures at that time.

He did this by comparing his layer-by-layer collections with collections of beetles from different places in the modern world – beetles happen to evolve very slowly, so the actual variety of beetles hasn’t changed much over the last million years or so.

As his research proceeded, Coope was shocked to find that the beetles showed that at times, during the ice ages, temperatures had changed significantly in just a few decades – his beetles showed that the Earth’s climate is not fundamentally stable.

He had discovered abrupt climate change events, a previously unknown phenomenon. Geologists had always assumed that most processes were slow.

I had the good fortune to be a student in Coope’s palaeontology lectures long ago…. and also in Fred’s physical geology lectures. (In 1943, Fred Shotton was involved in a secret project that produced geological maps of certain beaches in northern France…… that’s a movie that should be made by someone)

“We are messing with the trigger that causes climate change….the outcome is likely to be ferocious.”

– Professor Russell Coope (1930-2011)

Russell Coope and his ice age beetles https://www.youtube.com/watch?v=xMyt-UbcUQo

Russell Coope on fossil beetles in the Cromer Forest-bed at Happisburgh, Norfolk, UK

YOUTUBE.COM

Russell Coope on fossil beetles in the Cromer Forest-bed at Happisburgh, Norfolk, UK

Russel

The Human Induced Climate Change Experiment

Warming → Feedback Activation → Feedback Coupling → Amplification → Tipping-Point Threshold → Cascade

The climate system is not simply warming—it is changing how it responds to that warming. Coupled climate feedbacks are becoming one of the most consequential dimensions of climate risk in the 21st century because they amplify changes and connect individual tipping-point pathways into larger cascading effects.

The longer warming persists, the more climate feedbacks become active. As these feedbacks interact, we are already observing nonlinear responses, amplification, and cascading impacts across the climate system. Hundreds of feedback mechanisms have been identified, and many can couple and reinforce one another, contributing to the accelerating pace and increasing magnitude of climate change—The Domino Effect.


by Daniel Brouse, Sidd Mukherjee, and Rocky Rex

Can Anthropogenic Global Warming Be Proven?

Yes.

The isotopic signature of atmospheric carbon dioxide provides direct evidence.

Fossil carbon is depleted in 13C and contains essentially no measurable 14C (radiocarbon), because 14C decays over thousands of years.

Observed atmospheric trends show:

  • A measurable decline in the 13C/12C ratio
  • A measurable decline in atmospheric 14C concentration
  • A measurable decline in atmospheric O2 concentration

These shifts form a remarkably consistent fingerprint.

The carbon isotopes tell us where the additional carbon is coming from. Fossil fuels were formed from ancient biological material and therefore have a characteristic isotopic signature: relatively little 13C and virtually no 14C. As fossil carbon is added to the atmosphere, the atmospheric CO2 isotope ratios shift in precisely the direction expected from fossil-fuel combustion.

The decline in atmospheric oxygen provides an independent piece of evidence.

When fossil fuels are burned, carbon combines with atmospheric oxygen:

C + O2 → CO2

The process consumes O2 and produces CO2. Because the additional atmospheric CO2 is accompanied by a measurable decline in atmospheric O2, the observations are consistent with large-scale combustion of carbon rather than simply a redistribution of carbon through the natural carbon cycle.

This is especially important because the ocean, vegetation, and atmosphere continuously exchange carbon and oxygen. Natural processes can move carbon between reservoirs, but they do not explain the simultaneous long-term pattern of rising CO2, falling O2, declining 13C/12C, and declining radiocarbon.

The four observations reinforce one another:

Rising atmospheric CO2
↓
Declining 13C/12C
↓
Declining 14C
↓
Declining atmospheric O2

Together, these measurements provide a chemical and isotopic fingerprint of fossil-carbon combustion.

Volcanoes do not produce the observed isotopic pattern, and the natural carbon cycle cannot account for the simultaneous changes in the required direction and magnitude.

The molecules carry their own fingerprint—and the atmosphere is preserving the evidence in both carbon and oxygen.


Demand Destruction Album Cover

Demand Destruction


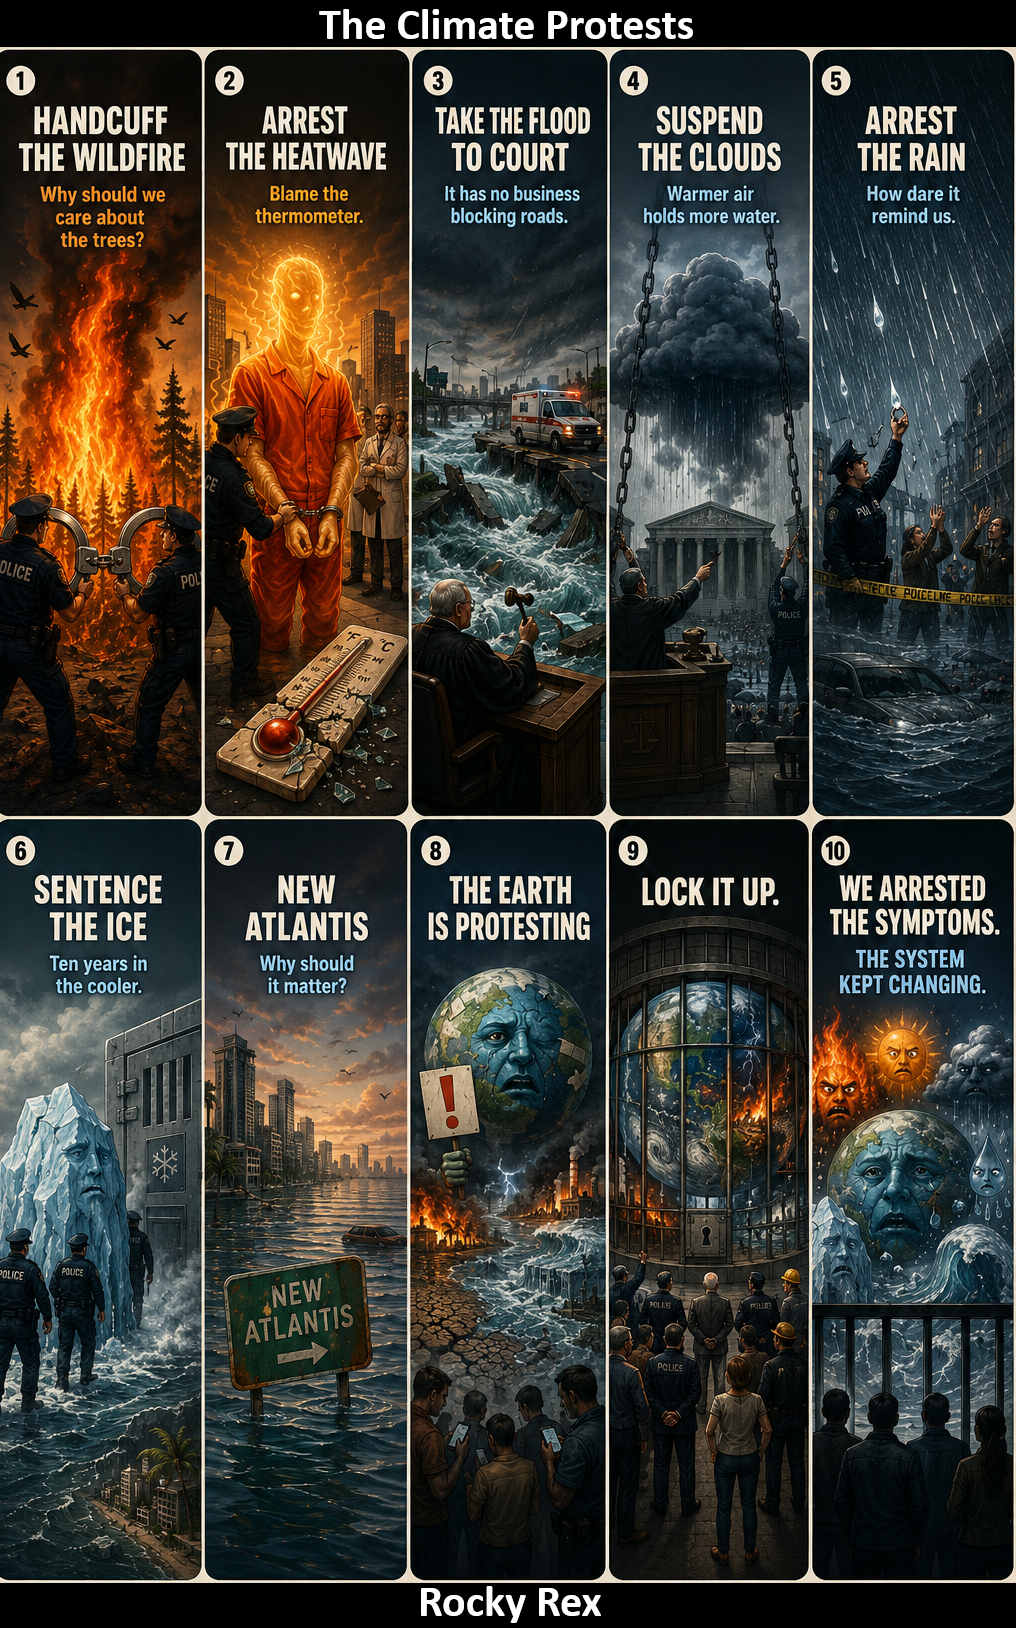
THE CLIMATE PROTESTS

by Rocky Rex

“Handcuff the wildfire.

Why should we care about the trees?

What did the birds ever do for us?

Dress the heatwave in an orange jumpsuit.

It is probably a fault in the thermometer anyway.

These scientists – what do they know?

Take the flood to court.

It has no business blocking roads, or sweeping away bridges.

What if an ambulance was stuck on the wrong side of the river?

Give the clouds a suspended sentence.

They are trying to remind us that a warmer world has wetter air. They should go and tell China, not us.

Arrest the rain.

How dare it remind us that the climate is changing?

Let’s pretend it always rained like this.

Sentence the melting ice to 10 years in the cooler.

Why does it matter if the sea floods Bangladesh?

And Miami can be the New Atlantis.

The Earth is protesting?

We are not interested – just lock it up.”


The Good Ancestor

A poem by Daverick Leggett

Every day I walk a hundred years
to the hill where my great, great granddaughter sits.
I carry words of blessing
and reach to touch her back.

But feeling me near she turns,
sad-eyed and heavy with grief.

“What was it like?” she asks,
“when the great whales swam,
when the birds sang you awake,
when the rains came soft,
and the soil smelled sweet underfoot?”

And the blessings
catch in my throat.

On darker days she turns,
her famished face charred, and eyes
sunk in their bony orbits,
burn with curses.

And the blessings
froth at my mouth
with the poisonous
spume of betrayal.

On the darkest of all days
I walk the hundred years
and find no one there.

Let today be the bright day.
Let today be the bright day
I lay my hand upon her back.

And, feeling me near, she turns
and blesses me, saying,

“Your love was fierce enough,
sweet ancestor,
your love was fierce enough.”


About Rocky Rex

I was a science teacher for a long time – and I taught geology when I could. Rocky Rex began as a poster on my lab wall….I was given a T Rex poster, and as soon as I pinned it up I knew he was called Rocky Rex. The name just came to me, out of nowhere.

He gave a focus for information added to his notice board. He ended up making money for school funds by appearing on T-shirts, pens, key-rings etc.

It wasn’t long before some of the other staff started calling me Rocky. This was all long before the internet existed, but when social media appeared it just seemed obvious that my avatar would be Rocky Rex. I like keeping my online stuff slightly disconnected from my offline life. [I actually did a physics degree, but we had to take an “additional science” course in the first year, so I chose geology. It was the same geology course taken by those doing a joint degree in geology and archaeology. ]

bookmark_borderThe Strange and Hidden Feedback Network: Chaos Theory and the Acceleration of Climate Change

by Daniel Brouse

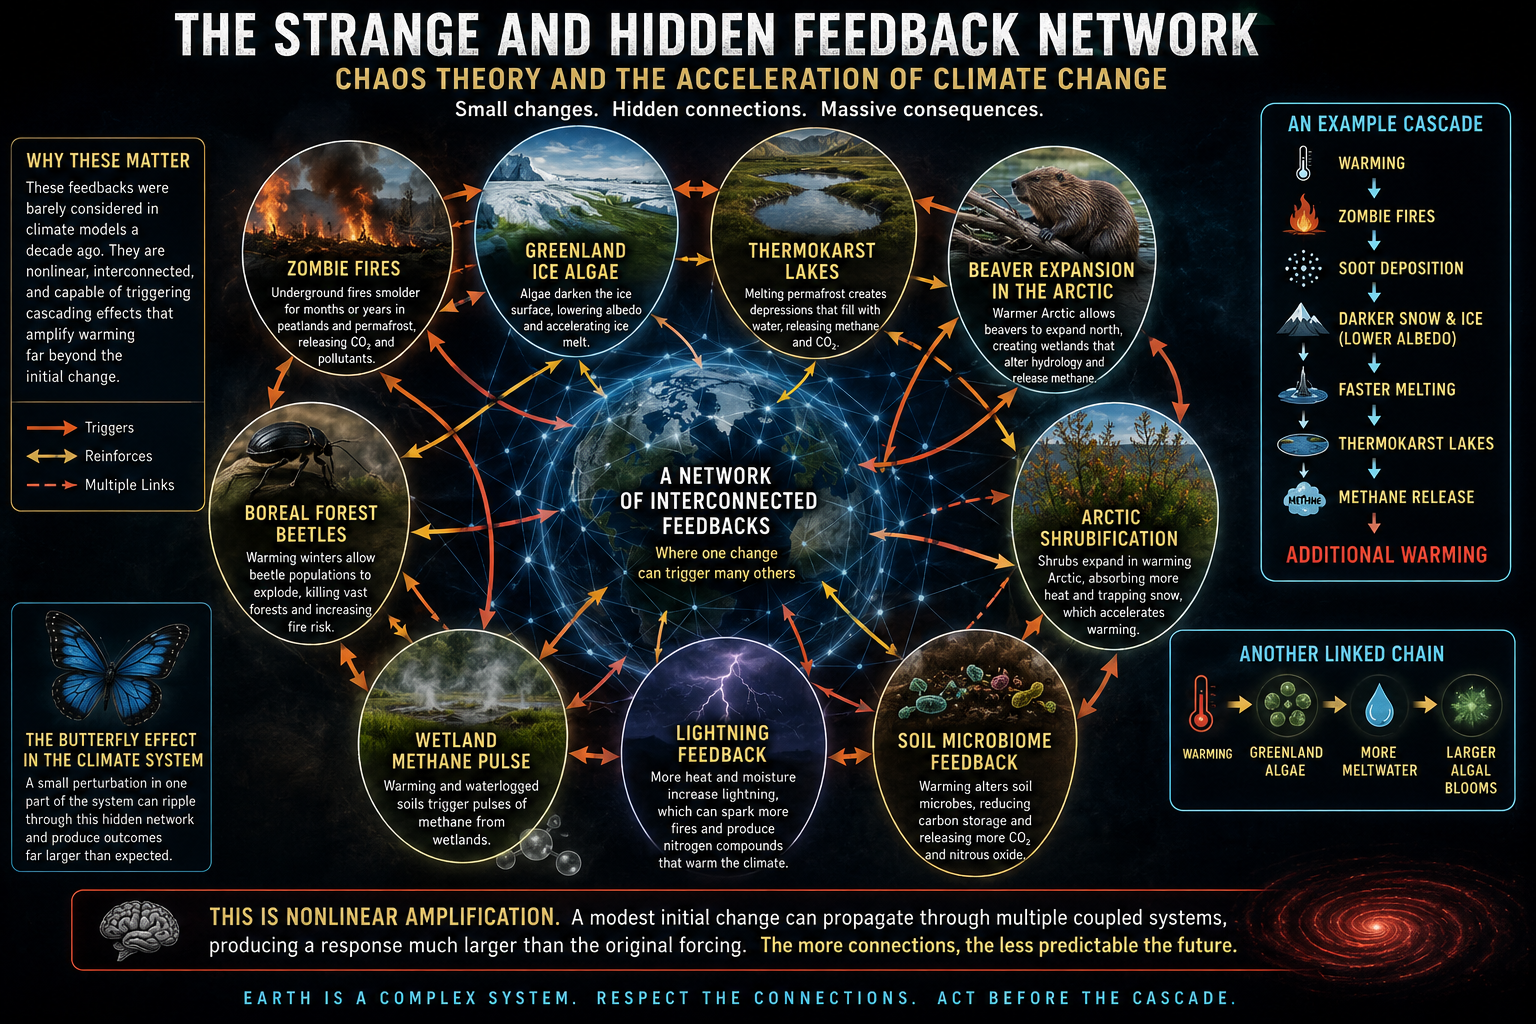
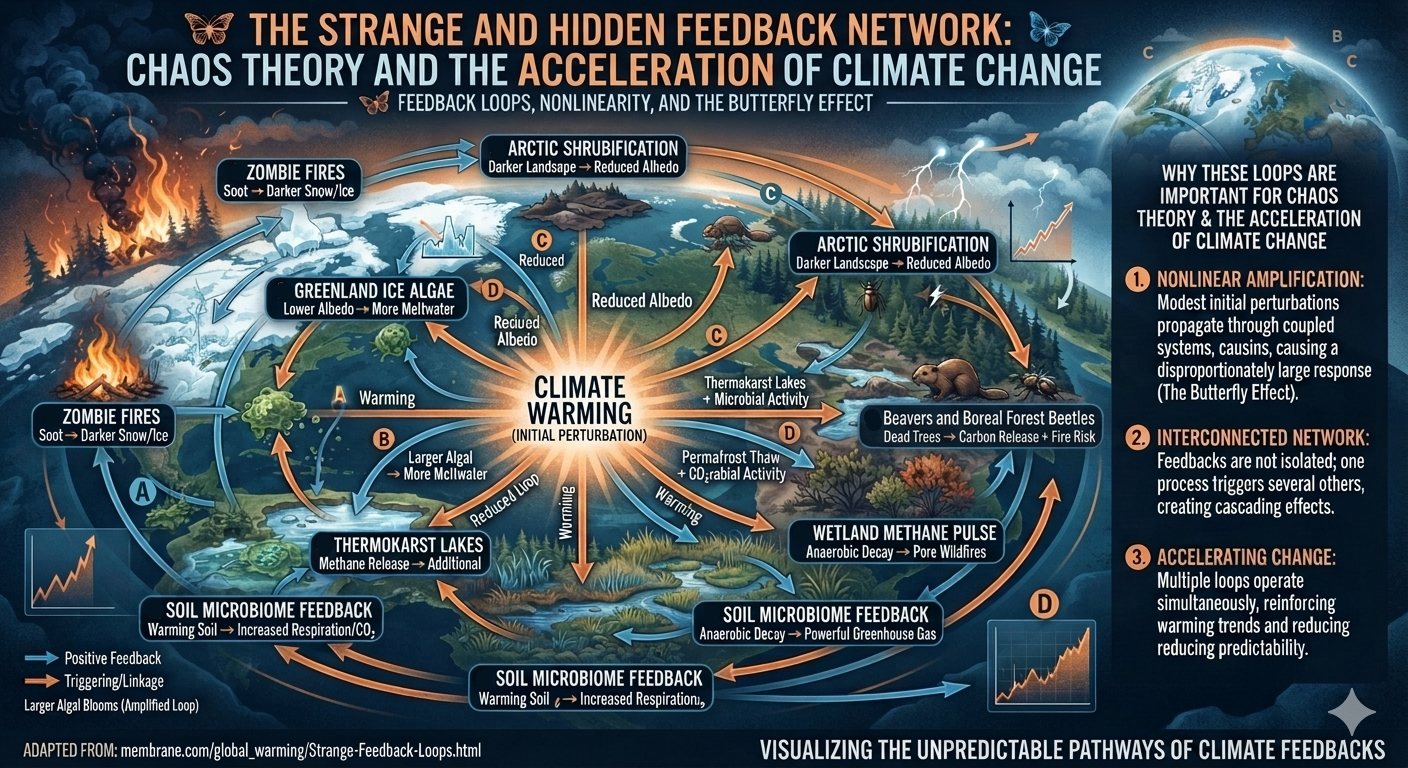
Some of the most fascinating—and concerning—climate feedback loops are ones that were barely considered in climate models a decade ago. They illustrate how a relatively small change can trigger a cascade of nonlinear responses, making them particularly relevant from a chaos theory perspective.

Chaos Theory and the Acceleration of Climate Change

Climate change isn’t just one feedback causing another.

It’s becoming a network of interacting feedbacks where seemingly unrelated processes reinforce each other in ways that traditional linear thinking struggles to capture.

Our newest infographic explores some of the Earth’s most unusual and recently recognized climate feedbacks, including:

🔥 Zombie Fires
🟢 Greenland Ice Algae
🏞️ Thermokarst Lakes
🦫 Arctic Beaver Expansion
🪲 Boreal Forest Beetles
🌿 Arctic Shrubification
💨 Wetland Methane Pulses
⚡ Lightning Feedback
🦠 Soil Microbiome Feedback

These systems don’t operate independently.

A small change can trigger multiple connected responses that amplify one another—a climate-scale example of the Butterfly Effect.

For example:

Warming → Zombie Fires → Soot on Ice → Lower Albedo → Faster Melting → Thermokarst Lakes → Methane Release → More Warming

This is nonlinear amplification: modest initial changes propagating through interconnected systems to produce responses far larger than the original disturbance.

As these hidden connections strengthen, predicting climate behavior becomes increasingly difficult using simple cause-and-effect models.

Understanding the network is becoming just as important as understanding the individual feedbacks.

🌍 Every new connection matters.

1. Zombie Fires (Overwintering Peat Fires)

Feedback loop:

  1. Higher temperatures → more drought.
  2. Peat ignites during summer fires.
  3. Fire smolders underground all winter.
  4. Fire re-emerges the following spring.
  5. Vegetation and insulating peat disappear.
  6. Permafrost thaws.
  7. Ancient carbon and methane are released.
  8. More warming → more fires.

These fires can survive beneath snow because peat acts like charcoal, insulating the combustion. They’re becoming increasingly common across Canada and Siberia as warmer, drier conditions expand.


2. Greenland Ice Algae

Perhaps one of the strangest biological feedbacks.

Feedback loop:

  1. Warmer summers melt snow.
  2. Microscopic algae bloom on exposed ice.
  3. Dark pigments reduce ice reflectivity (albedo).
  4. More sunlight is absorbed.
  5. Ice melts faster.
  6. More liquid water supports additional algae.

Researchers call this biological darkening. In parts of Greenland’s “Dark Zone,” algae have become a measurable contributor to increased melt.


3. Thermokarst Lakes

One of the least intuitive feedbacks.

Feedback loop:

  1. Permafrost begins thawing.
  2. Ground collapses into depressions.
  3. Lakes form.
  4. Water conducts heat much better than frozen soil.
  5. Deeper permafrost melts.
  6. Ancient organic carbon decomposes.
  7. Methane bubbles escape.
  8. Methane accelerates warming.

Small lakes become “hot spots” that can emit disproportionately large amounts of methane.


4. Beaver Expansion in the Arctic

As northern regions warm:

  • beavers move farther north,
  • they build dams,
  • ponds trap warm water,
  • warm water melts surrounding permafrost,
  • wetlands expand,
  • methane emissions increase.

An animal once considered ecologically beneficial in temperate regions becomes an unexpected amplifier of Arctic warming.


5. Boreal Forest Beetles

Cold winters historically killed bark beetles.

Now:

  • milder winters
  • more beetles survive
  • forests die
  • dead forests burn more easily
  • fires release carbon
  • soot darkens snow and ice
  • additional warming allows beetles to expand farther north.

6. Wildfire Smoke Darkening Snow

Smoke doesn’t just affect air quality.

Wildfire ash and black carbon settle on:

  • glaciers
  • Arctic sea ice
  • mountain snowpack

This lowers albedo, causing earlier melt, which exposes darker land and ocean surfaces that absorb even more solar energy.


7. Arctic Shrubification

As tundra warms:

  • shrubs invade formerly snow-covered areas,
  • shrubs absorb more sunlight than snow,
  • shrubs trap drifting snow,
  • deeper snow insulates the soil,
  • winter soil temperatures rise,
  • permafrost thaws faster.

A simple change in vegetation alters the thermal properties of the landscape.


8. Rain-on-Snow Events

Increasing winter rain instead of snow causes:

  • ice crust formation,
  • vegetation damage,
  • reduced insulation,
  • altered hydrology,
  • increased runoff,
  • greater summer drying,
  • increased wildfire risk.

This feedback connects winter weather directly to summer fire seasons.


9. Kelp Forest Collapse

Marine heat waves can eliminate kelp forests.

Loss of kelp means:

  • less carbon uptake,
  • reduced coastal cooling,
  • altered nutrient cycling,
  • warmer coastal waters,
  • additional kelp mortality.

10. Ocean Stratification

Warmer surface oceans become lighter.

This reduces vertical mixing.

Consequences include:

  • less oxygen reaching deep water,
  • reduced nutrient upwelling,
  • warmer surface layers,
  • marine heat waves become more persistent,
  • coral bleaching,
  • weaker biological carbon pump.

11. Wetland Methane Pulse

Heavy rainfall creates:

  • saturated soils,
  • oxygen-poor conditions,
  • methanogenic microbes,
  • increased methane emissions,
  • additional warming.

Ironically, wetter conditions can increase greenhouse-gas emissions from wetlands.


12. Glacier Elevation Feedback

As glaciers melt:

  • their surfaces sink,
  • lower elevations are warmer,
  • melting accelerates,
  • glaciers descend farther into warmer air,
  • retreat speeds up.

Greenland exhibits this effect over large areas.


13. AMOC Freshwater Feedback

Greenland meltwater freshens the North Atlantic.

Fresh water is less dense, reducing deep-water formation.

This can alter ocean circulation, redistribute heat, and change regional weather patterns. Some studies suggest this may also increase subsurface warming near marine-terminating glaciers, enhancing ice-sheet melt.


14. Lightning Feedback

Warmer air produces:

  • more atmospheric moisture,
  • greater instability,
  • more lightning,
  • more wildfire ignitions,
  • greater carbon emissions,
  • additional warming.

Recent studies indicate lightning activity is increasing in parts of the Arctic, where lightning was historically uncommon.


15. Soil Microbiome Feedback

Warmer soils stimulate microbial activity.

Microbes decompose organic matter faster, releasing:

  • CO₂
  • methane
  • nitrous oxide

These gases further warm the atmosphere, increasing microbial activity even more.


Why these are important for chaos theory

What’s striking is that these feedbacks don’t operate independently. They form an interconnected network in which one process often triggers several others. For example:

  • Warming → zombie fires
  • Zombie fires → soot deposition
  • Soot → darker snow and ice
  • Darker ice → faster melting
  • Faster melting → thermokarst lakes
  • Thermokarst lakes → methane release
  • Methane → additional warming

Likewise:

  • Warming → Greenland algae
  • Algae → lower albedo
  • Lower albedo → more meltwater
  • Meltwater → larger algal blooms

These interactions exemplify nonlinear amplification: a modest initial perturbation can propagate through multiple coupled systems, producing a response much larger than the original forcing (The Butterfly Effect). That networked behavior is one reason Earth-system responses can become increasingly difficult to predict with linear cause-and-effect thinking.

bookmark_borderThe Future of Energy Is Not Static

By Daniel Brouse
Economist & Climatologist
Membrane Domain USA
August 10, 2026

I’m not certain what the future holds. I don’t think anyone can be.

But I’m also not convinced that the future of fossil fuels can be projected simply by looking at today’s production levels and assuming they will continue indefinitely.

There is a very real possibility that economics, energy security, technological substitution, and even economic disruption could phase out fossil fuels much faster than most people expect.

In fact, some of the data already point in that direction.

The Energy Transition Is Already Moving

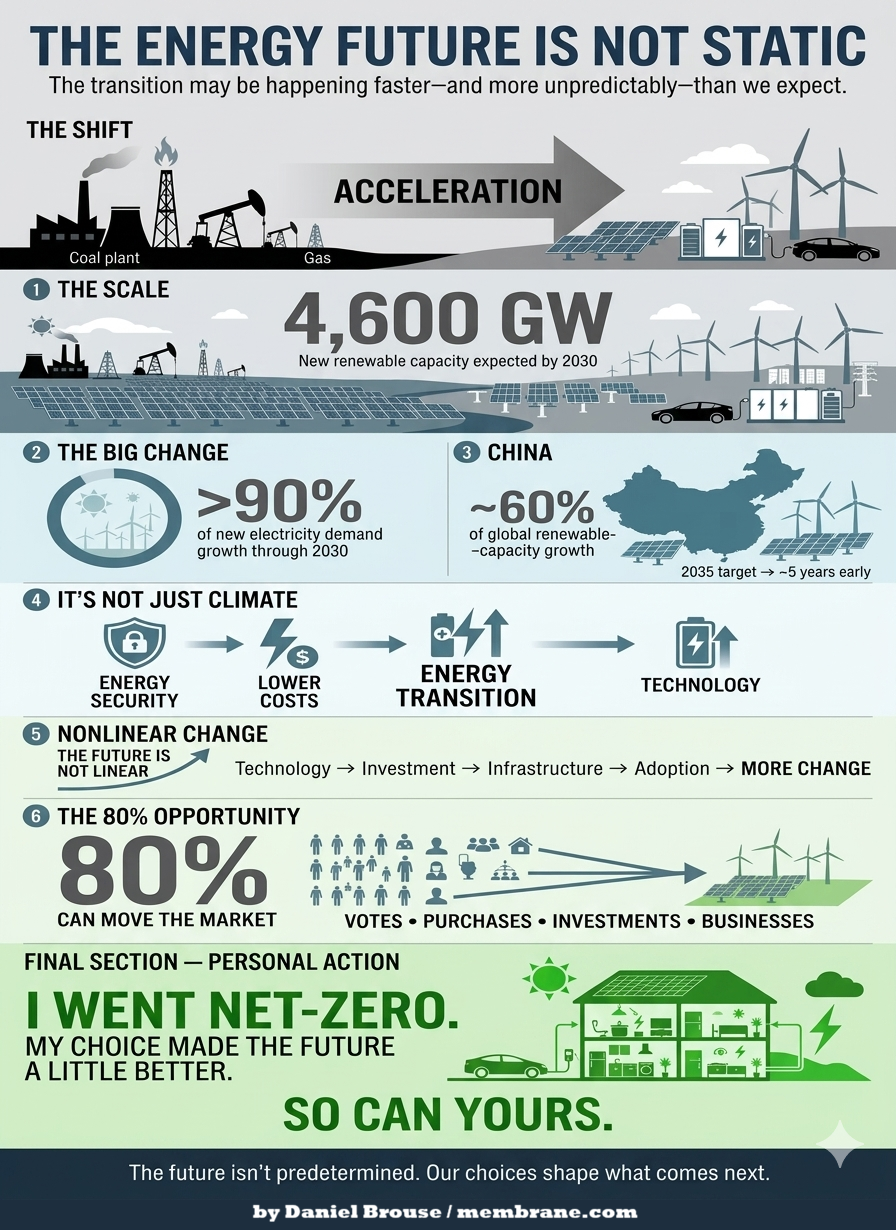
The International Energy Agency estimates that global renewable capacity will increase by roughly 4,600 GW between 2025 and 2030—an extraordinary expansion roughly equivalent to the combined current power capacity of China, the European Union, and Japan.

Solar PV is expected to account for almost 80% of that expansion.

Even more significant is what this means for the growth of electricity demand. Renewables are expected to provide more than 90% of the increase in global electricity generation through 2030.

This is not simply a distant prediction about some hypothetical future energy system. It represents an enormous investment already underway.

And the transition is happening particularly rapidly in China.

China is now responsible for nearly 60% of global renewable-capacity growth. In 2025 alone, it added roughly 314 GW of solar capacity and is on track to reach its 2035 wind-and-solar target approximately five years early.

Whatever one’s views on climate policy, these numbers are difficult to dismiss.

The global energy system is changing.

And it is changing rapidly.

This Isn’t Just About Climate Policy

There is another factor that deserves considerably more attention: energy security.

The transition away from fossil fuels is not being driven exclusively by environmental concerns. Increasingly, it is also becoming an economic and strategic imperative.

The disruption of oil and gas flows through critical transportation routes such as the Strait of Hormuz demonstrates the vulnerability inherent in an energy system dependent upon globally traded fossil fuels.

For Europe and Asia in particular, domestic renewable generation, energy storage, electrification, and efficiency increasingly represent something more than climate policy.

They are energy-security assets.

A solar panel or wind turbine doesn’t need to be transported through a geopolitical chokepoint every time it generates electricity. Once installed, domestic renewable resources can reduce exposure to international fuel-price shocks, supply disruptions, and geopolitical conflicts.

That changes the economic calculation.

And it is one reason I believe the energy transition may prove considerably more nonlinear than many conventional forecasts assume.

The Future May Be Nonlinear

I agree that we shouldn’t pretend we know exactly what the future holds.

My point is almost the opposite.

The future may be much more nonlinear than either of us can confidently predict.

Technologies don’t necessarily replace one another gradually. Once a technology becomes sufficiently cheap, reliable, scalable, and convenient, adoption can accelerate rapidly.

The same thing can happen with infrastructure.

Battery storage becomes cheaper. Electric vehicles become more capable. Solar becomes less expensive. Transmission improves. Heat pumps become more efficient. Businesses discover that electrification can reduce operating costs. Consumers begin choosing technologies that save them money.

Each development can reinforce the others.

And once enough pieces of the system change, the economics of the entire energy system can change with them.

This is why simply extrapolating today’s fossil-fuel production into the future can be misleading.

Could “Drill, Baby, Drill” Backfire?

There is an irony here.

Policies intended to expand U.S. fossil-fuel production could potentially accelerate the transition they are intended to slow if they contribute to greater volatility, geopolitical exposure, or investment in alternatives.

Consider what could happen during a serious economic downturn.

A major recession could cause substantial demand destruction. Businesses would consume less energy. Consumers would drive less and purchase fewer goods. Industrial production would decline.

Fossil-fuel consumption could fall sharply.

That would potentially undermine the very industry that policies designed around expanding fossil-fuel production are intended to strengthen.

There is no guarantee this will happen. But that’s precisely the point.

The future contains feedback loops.

Economic conditions affect energy demand. Energy prices affect technology adoption. Technology affects investment. Investment affects infrastructure. Infrastructure affects energy prices and security. Geopolitical events affect all of them.

The result is a system capable of changing much faster than a simple linear projection would suggest.

This Isn’t an All-or-Nothing Choice

I’m not trying to create another online debate.

I’m simply pointing out that the data show a transition already underway—and its speed is anything but static.

And perhaps the most important point is that this isn’t an all-or-nothing proposition.

Every increment of transition matters.

Every electric vehicle displaces some gasoline consumption. Every solar panel replaces some electricity that otherwise might have come from fossil fuels. Every efficiency improvement reduces energy demand. Every battery installation makes intermittent renewable energy more useful. Every business that electrifies reduces some exposure to fossil-fuel prices.

The more we transition, the more reasonable—and manageable—the future becomes.

We don’t need to transform the entire energy system overnight.

We need to keep moving.

Technology Is Changing More Than Energy

There is another reason I remain optimistic.

Ironically, AI and rapidly advancing technology are accelerating climate science at a pace that may eventually rival the acceleration of climate change itself.

Research that once took years can increasingly be explored in hours.

Large datasets can be analyzed in ways that weren’t previously practical. Relationships between variables can be identified more quickly. Models can be tested, refined, and compared at extraordinary speed.

I’ve been able to identify hundreds of interacting feedbacks and relationships that weren’t even being seriously considered just a few years ago.

That doesn’t mean every hypothesis will be correct.

It means our ability to investigate complex systems is expanding extraordinarily quickly.

And that gives me reason for optimism.

Humans have an extraordinary capacity to adapt, innovate, and solve difficult problems—especially when we are sufficiently motivated to do so.

The future is not predetermined.

What we do now can still make an enormous difference in what comes next.

The 80% Question

A final thought concerns something that initially struck me as particularly concerning.

Roughly 20% of Americans appear to be actively fighting the energy transition.

At first, I found that almost dumbfounding. I expected the number to be closer to less than 2%.

But there is another way to look at it.

That still leaves roughly 80% of the population.

And if that 80% chooses to act—through voting, investment, purchasing decisions, business decisions, and simply choosing where to spend their dollars—the market can move remarkably quickly.

We don’t necessarily have to fight the remaining 20%.

We can vote with our dollars.

Markets respond to demand.

If enough consumers and businesses choose alternatives, capital will follow. Manufacturers will respond. Infrastructure will change. Companies will adapt.

And eventually, the fossil-fuel industry will have to adapt as well—or gradually lose market share.

That is the power of an energy transition driven not only by government policy, but by millions of individual economic decisions.

My Choice. Your Choice. Our Future.

I went net-zero years ago.

If I can do it, anybody can.

I don’t claim that my individual decision changed the world.

But my choice made the future a little better than it otherwise would have been.

And so can yours.

The future of energy isn’t predetermined by today’s production numbers, today’s political battles, or today’s assumptions.

It will be shaped by billions of decisions made by consumers, businesses, investors, engineers, scientists, and governments.

Some of those decisions will be political.

Many will be economic.

Some will be technological.

And countless others will be personal.

That’s why I don’t think the question is whether we can predict exactly what the energy system will look like in 10, 20, or 30 years.

We can’t.

The more important question is:

What direction are we moving—and how much can our choices influence where we ultimately arrive?

The transition is already underway.

Its speed is accelerating.

And the future is still ours to shape.

bookmark_borderScience Is Science: Confronting Denialism and Ecofascism

About Denialism and Ecofascism: Science Is Science

The Observation
Glad to know you’re watching out! At the same time, this divisiveness—when we desperately need everyone to pull together because it’s a CRISIS, right?—makes me somehow deeply sad.

That’s a big job right there… How do we reach those who seem furthest away from any kind of understanding? We need both a Winston Churchill and a Mahatma Gandhi in this endeavor…

The Response
Agreed. Both denialism and ecofascism are ideologies that ultimately defy logic. In very different ways, they can become a kind of combination of self-destruction and destruction of others.

I’ve spent years battling misinformation, propaganda, and rhetoric. To the best of my knowledge, neither Sidd nor I have successfully converted—or even educated—a single committed denier. Climate science has somehow been transformed into a “belief” system. But science has nothing to do with belief. 1 + 1 = 2. If someone refuses to “believe” that, what exactly can you do?

From the beginning, our work has been based on observations, data, mathematics, and the laws of physics. So yes, I think this is at the heart of the crisis. When we started this work, we genuinely believed humanity would eventually take action. We thought we had thousands, if not tens of thousands, of years to adapt. That was the one thing we got wrong.

A couple of years ago, after explaining my continuing attempts to reach climate deniers, I asked Sidd what we could possibly do. His response was essentially, “Dude, just tell them to look out their window.” It sounds simplistic, but there is profound truth in it. The consequences are becoming increasingly difficult to deny.

Since then, we’ve had to rebuild much of our modeling. A +4°C world within thousands of years is no longer the worst-case scenario we worry about. The possibility of 4–7°C of warming within a century has become a much more serious concern in our work.

And then there is the political dimension. The rise of white-nationalist and authoritarian governments in the U.S. and elsewhere has made an already difficult problem considerably harder. Paradoxically, though, history offers one small reason for hope: fascism ultimately fails. It is inherently self-destructive.

The “drill, baby, drill” mentality is economically and environmentally self-defeating. A severe economic contraction could, ironically, buy humanity some time for adaptation while drastically reducing emissions. That is hardly the future anyone should want, but history has repeatedly demonstrated that systems built on extremism and authoritarianism eventually consume themselves.

So yes—we desperately need both the Churchill and Gandhi dimensions: the willingness to confront reality without flinching, and the willingness to keep reaching for people rather than giving up on them. I’m just not sure humanity has ever faced a crisis where we needed both quite this badly.

bookmark_borderThe Humidity Paradox: Why a Warmer Atmosphere Is Getting Wetter—and Drier at the Same Time

by Daniel Brouse

Absolute humidity—the total amount of water vapor in the air—is increasing globally as the climate warms. The fundamental physics is straightforward: according to the Clausius–Clapeyron relationship, warmer air can hold substantially more water vapor. For every 1°C (1.8°F) of warming, the atmosphere’s water-holding capacity increases by roughly 7%.

As human-caused greenhouse gas emissions raise global temperatures, evaporation from the oceans and land surface increases, adding more water vapor to the atmosphere. This creates an important distinction, however: the atmosphere can contain more water vapor even while relative humidity declines in many regions.

The Humidity Paradox

Absolute humidity measures how much water vapor is actually present in the air.

Relative humidity measures how close the air is to saturation relative to the maximum amount of moisture it could hold at that temperature.

Because warmer air has a rapidly increasing moisture capacity, these two measurements can move in different directions.

Over Much of the World’s Land

Relative humidity has declined across many continental regions. Land surfaces are warming faster than the oceans, particularly in already-dry and semi-arid regions. As temperatures rise, the atmosphere’s capacity to hold water vapor can increase faster than the actual moisture supplied by evaporation.

The result is a paradoxical combination:

More water vapor in the atmosphere + lower relative humidity = a warmer, thirstier atmosphere.

This can increase atmospheric drying demand, soil-moisture loss, vegetation stress, drought intensity, and wildfire risk.

Several regions show particularly pronounced drying trends:

  • American West and Southwest: Rapid warming is increasing atmospheric moisture demand faster than water availability in many areas, intensifying drought and wildfire conditions.
  • Interior South America: Parts of the Amazon Basin and surrounding interior regions are experiencing declining relative humidity as warming and land-use change affect moisture recycling.
  • Mediterranean Basin and Southern Europe: Declining relative humidity contributes to stronger atmospheric drying, soil desiccation, and more severe heat and drought conditions.
  • Southern Africa and Central Asia: Large continental interiors are increasingly exposed to atmospheric drying because warming is increasing moisture demand faster than local moisture supplies can compensate.

Over Oceans and Moisture-Rich Regions

Over much of the ocean, relative humidity is more stable because evaporation provides a continuing source of atmospheric moisture. In some regions, relative humidity can increase because of ocean warming, atmospheric circulation changes, and enhanced moisture transport.

The tropical oceans are especially important. Their vast warm-water surfaces provide enormous quantities of moisture to the atmosphere, helping maintain high humidity and supplying the water vapor that can fuel intense precipitation and tropical cyclones.

In the Arctic and other high-latitude regions, declining sea ice exposes more open ocean to the atmosphere. Increased evaporation from newly exposed water can raise local atmospheric moisture and influence clouds, precipitation, and regional energy balance.

Monsoonal regions can also experience large seasonal increases in humidity when atmospheric circulation transports moisture-rich maritime air over land, producing dangerous combinations of heat and humidity.

The Dangerous Consequences of Rising Atmospheric Moisture

1. Severe Heat Stress

Humidity directly affects the body’s ability to cool itself.

When air is already moisture-rich, sweat evaporates less efficiently. This reduces the body’s primary mechanism for dissipating heat and can sharply increase heat stress, particularly during prolonged periods of extreme heat.

The combination of high temperature + high humidity is therefore much more dangerous than temperature alone suggests.

2. More Extreme Rainfall

A warmer atmosphere can contain more water vapor. When moisture-rich air rises, cools, and condenses, that additional atmospheric moisture can contribute to substantially heavier precipitation.

This creates an important climate feedback:

Warming → More atmospheric moisture → Greater precipitation potential → More extreme rainfall → Greater flood risk

The same atmosphere that can become dangerously dry over land between storms can also produce much more intense rainfall when moisture is concentrated and lifted.

3. Hotter and More Humid Nights

High humidity can reduce nighttime evaporative cooling, particularly when temperatures remain elevated.

This matters because the human body needs nighttime cooling to recover from daytime heat exposure. When nights remain unusually warm and humid, physiological heat stress can accumulate over consecutive days.

The result is another dangerous combination:

Hotter days + warmer nights + higher humidity = greater cumulative heat stress.

One Atmosphere, Two Humidity Signals

The apparent contradiction between increasing absolute humidity and declining relative humidity disappears when the two measurements are understood as different properties of the atmosphere.

Absolute humidity asks: How much water vapor is actually there?

Relative humidity asks: How much water vapor is there compared with how much the warmer air could potentially hold?

Climate warming can therefore produce both simultaneously:

More atmospheric water vapor globally

while

relative humidity declines across many warming continental interiors.

This is one of the most important—and frequently misunderstood—features of climate-driven hydroclimatic change.

The atmosphere is becoming wetter in absolute terms while becoming more moisture-hungry in many land regions.

That combination can intensify the hydrologic extremes of a warming world:

More atmospheric moisture → More extreme precipitation

Warmer land → Lower relative humidity → Greater atmospheric drying demand

Higher humidity + higher temperatures → Greater heat stress

Hotter oceans → More evaporation → More atmospheric moisture

The result is not simply a “wetter” or “drier” planet.

It is a planet with a more energetic and increasingly polarized water cycle, where extreme moisture and extreme atmospheric drying can occur closer together in both space and time.

bookmark_borderReal Estate Climate Risk Models

by Daniel Brouse and Sidd Mukherjee

Background

Sidd said: “frightening article by Jeff Masters. We saw some of this coming, the flood risk aint just
along the coast, it extends 100 miles inland…
the water cant get out …”

https://yaleclimateconnections.org/2026/08/the-floods-of-the-future-wont-come-one-at-a-time/

In the 1990s, Sidd and I began developing real-estate-based climate risk models. From the beginning, one of the underlying high-risk factors was flooding—and, closely linked to it, the availability and affordability of flood insurance. In the early 2000s, we met with FEMA, Fannie Mae (FNMA), and Freddie Mac (FHLMC) to better understand their flood-risk modeling and emerging plans for managed retreat.

In October 2023, Sidd observed: “Now I am thinking the violent rain will be a bigger problem before we die.”

That concern has become increasingly relevant. As the Earth warms, warmer air can physically hold more water vapor than cooler air. For every 1°C (1.8°F) increase in temperature, the atmosphere can hold approximately 7% more moisture, increasing the potential for extreme precipitation. Over a 10°C increase, atmospheric moisture-holding capacity would nearly double, creating the potential for substantially more intense rainfall.

The problem, however, is not simply the amount of water falling from the sky. It is also what happens when that water moves across the landscape—and whether infrastructure and government response systems are capable of managing, containing, and recovering from the resulting flows.

Flow forces scale with the square of velocity (v²). As flow speeds increase—whether from heavier rainfall, steeper runoff, or more intense hydrological events—the destructive force of moving water rises rapidly. Density further magnifies this effect. Water is roughly 800 times denser than air, meaning that a comparable flow velocity can produce dramatically greater force.

Together, we developed a series of models incorporating the Clausius–Clapeyron relationship, the extreme energy transfer within the water cycle through latent heat, and fluid-flow dynamics. These models increasingly pointed toward a risk structure in which flooding could no longer be treated as an isolated coastal problem. Instead, precipitation intensity, runoff, topography, infrastructure vulnerability, insurance stress, and limited recovery capacity can interact and compound one another across much larger regions.

By 2026, the framework had evolved from a theoretical real-estate climate-risk model into a broader multiplicative risk framework that could be evaluated against observed real-world conditions.

The latest evolution of this work is presented in the following three papers: