bookmark_borderTipping Points That Toppled

When Climate Feedbacks Stop Looking Theoretical

By Daniel Brouse

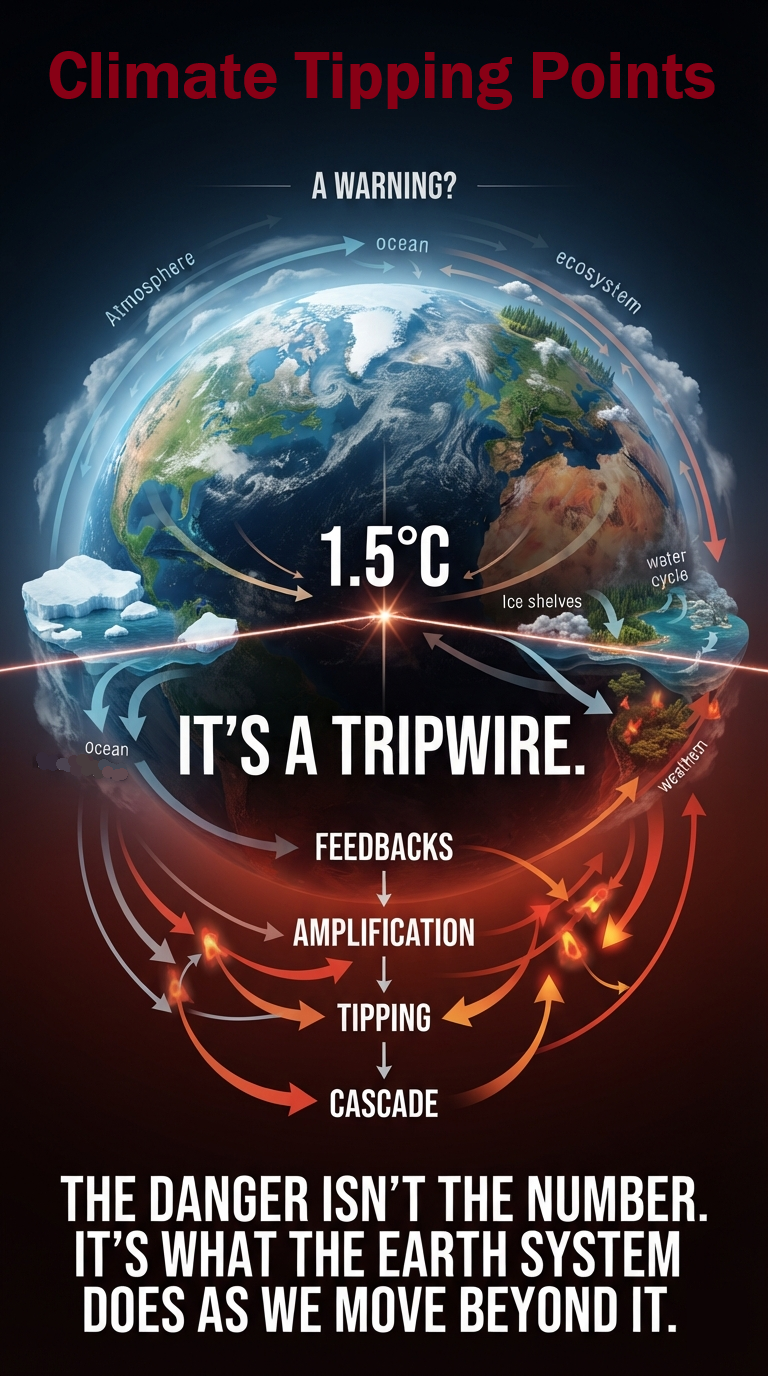
The 2023–2024 El Niño event made observable what had previously been discussed largely as theoretical: multiple climate-system tipping processes were being pushed simultaneously.

At least nine potential tipping points were being knocked or pushed toward critical thresholds during the 2023–2024 period. Two of the clearest examples were global coral reef degradation and accelerating permafrost instability.

What has happened since is even more significant.

The 2026–2027 El Niño is now developing on an Earth system that is already substantially warmer and more stressed than it was during the previous major El Niño. NOAA reported in August 2026 that El Niño was strengthening, with a greater than 90% probability of a very strong event during the Northern Hemisphere fall and winter of 2026–27. NOAA also estimated a 69% probability that October–December 2026 would produce a historic event exceeding +2.5°C in the three-month Relative Oceanic Niño Index—a level exceeding previous El Niño events dating back to 1950.

This matters because tipping behavior does not occur in isolation.

A system that has already been weakened can respond very differently to the next pulse of heat.


The 2023–2025 Coral Reef Collapse

The massive global coral bleaching event that began in 2023 and extended through 2025 was not simply another bad year for coral.

NOAA confirmed in April 2024 that the world was experiencing its fourth global coral bleaching event on record, and the second in only ten years. By the time NOAA’s assessment was updated in 2026, bleaching-level heat stress had affected approximately 84.4% of the world’s coral reef area, with mass bleaching documented across at least 83 countries and territories. NOAA characterized it as the largest global bleaching event on record.

The significance is not merely the percentage of reefs exposed to heat.

Coral reefs depend upon a narrow thermal range. Extreme heat disrupts the relationship between coral animals and the symbiotic algae that supply much of their energy. Bleaching therefore represents a fundamental physiological failure, not simply a change in color.

When extreme heat persists, bleaching can progress to starvation, disease and mortality. And recovery requires time. That is where the feedback becomes dangerous.

If reefs are repeatedly exposed to severe marine heatwaves before they have recovered, the system can move from temporary disturbance to structural ecological degradation. A reef that loses living coral loses the biological architecture that supports fish, coastal protection, biodiversity and future coral recruitment.

The recovery window is shrinking.

A 2026 assessment by the Global Coral Reef Monitoring Network found that the average interval between mass bleaching events has fallen to roughly five or six years, while coral cover during 2020–2024 was approximately 9.5% below historical averages. The 2023 event alone affected an estimated 77% of global reef area, according to the assessment.

The crucial point is that the next El Niño does not begin with the coral system restored to its previous condition.

It begins with an already damaged system.

And now the Pacific is heating again.


The 2026–2027 El Niño

The present El Niño is not hypothetical.

NOAA reported in August 2026 that sea-surface-temperature anomalies in the eastern equatorial Pacific had exceeded +2°C, while subsurface temperature anomalies reached approximately +10°C at depth. The agency reported a greater than 90% probability of a very strong El Niño during the 2026–27 Northern Hemisphere fall and winter.

By August, sea-surface temperatures in parts of the eastern equatorial Pacific were near or above +3°C, with a Niño-3.4 weekly index around +1.8°C.

This is precisely why the timing matters.

The planet is not resetting between El Niño events.

Heat accumulates in the climate system. Oceans retain enormous quantities of that energy. Ice sheets lose mass. Permafrost thaws. Forests burn. Coral reefs experience repeated thermal stress. Ecosystems lose resilience.

The next disturbance therefore acts upon a system already pushed closer to its limits.

That is how tipping behavior becomes possible.


Permafrost: The Other Domino

The same basic principle applies to permafrost.

Permafrost is not simply frozen dirt.

It is a massive reservoir of organic carbon accumulated over thousands of years. When frozen ground thaws, microbes gain access to previously locked organic material. They decompose it and release carbon dioxide and, under oxygen-poor conditions, methane.

That creates a feedback:

warming → thaw → microbial decomposition → greenhouse-gas emissions → additional warming → additional thaw.

But that is only one part of the process.

Permafrost is also physically coupled to vegetation, soil moisture, hydrology, fire, snow cover and ground ice.

Once those connections begin changing rapidly, the response can become nonlinear.


The “Compost Bomb” Effect

One of the most striking mechanisms is what can be called the “compost bomb” or self-heating effect.

When previously frozen organic matter thaws, microbial decomposition accelerates. Decomposition is an exothermic process: biological activity releases heat. That heat is not large enough to explain Arctic warming by itself, but locally it can become part of a reinforcing thermal environment.

That warming activates biological processes that themselves produce heat and greenhouse gases inside a system already undergoing thermal destabilization.

The frozen carbon reservoir is effectively being converted from a long-term carbon store into an active component of the carbon cycle.


Water Carries the Heat

Rain and changing hydrology provide another pathway.

Permafrost responds not only to air temperature but to the movement of heat through the ground.

Warm rain can penetrate the active layer and transport heat downward. Changes in snow, soil moisture, drainage and groundwater can alter how efficiently heat is stored and transferred through frozen ground.

The result is a system in which atmospheric warming, precipitation, hydrology and ground temperature interact.

This is particularly important because the response is not necessarily gradual.

Research on abrupt permafrost thaw has shown that collapsing ground, rapid erosion, landslides and thermokarst can expose large quantities of previously protected carbon much faster than gradual thaw models assume. Abrupt thaw may occur across less than 20% of the permafrost zone yet potentially affect roughly half of its stored permafrost carbon.

That is a tipping mechanism.

Not because every square mile of permafrost suddenly disappears, but because a relatively limited area of abrupt thaw can have a disproportionately large effect on the carbon cycle.


Thermokarst: When Frozen Ground Loses Its Structure

Permafrost is also a structural system. Ice binds soil and sediment together. When that ice melts, the ground can collapse.

The result is thermokarst—a landscape of subsidence, ponds, lakes, gullies and collapsing terrain.

This can expose deeper layers of ancient carbon, including carbon-rich deposits such as Yedoma, to oxygen, microbes, water and atmospheric processes.

The important distinction is between gradual thaw and abrupt thaw.

Gradual thaw progressively deepens the seasonally thawed active layer. Abrupt thaw can physically destroy the ground.

That difference matters enormously.

Once the ground collapses, hydrology changes. Lakes form or drain. Slopes destabilize. Sediment moves. Previously protected organic material becomes exposed.

The carbon cycle has effectively changed gears.


Fire Removes the Insulating Blanket

Then there is fire.

The extraordinary Canadian and Siberian wildfires of recent years are not merely consequences of Arctic warming. They can also become mechanisms that accelerate permafrost degradation.

The surface vegetation, moss and peat layer acts as an insulating blanket. Fire removes that blanket. The exposed soil can absorb substantially more solar energy, increasing ground temperatures and deepening the active layer.

The effect can persist for decades.

Research in Canadian permafrost peatlands has found that wildfire impacts on the soil thermal regime can persist for approximately 30 years, with burned areas experiencing warmer and deeper active layers and accelerated thermokarst development.

The relationship works in both directions.

Warming promotes fire.

Fire promotes permafrost thaw.

Thaw can promote soil drying and further fire.

Recent modeling research published in Nature Communications found that rapid permafrost thaw can produce abrupt changes in soil hydrology, surface warming and atmospheric dryness that intensify Arctic and sub-Arctic wildfires, particularly in western Siberia and Canada.

This is not a single feedback loop.

It is a network of feedback loops.


The Zombie-Fire Connection

The most disturbing manifestation is the phenomenon popularly called the “zombie fire.”

Peat and organic soils can continue smoldering beneath the surface after the visible flames disappear. These fires can survive through winter and re-emerge when conditions become favorable.

That means a previous year’s fire can effectively become the seed for the next year’s fire. The system acquires memory.

And that matters because climate tipping behavior often involves precisely this kind of persistence: the system does not return to its previous state when the original disturbance ends.

The fire changes the ground. The changed ground changes the next fire. The next fire changes the ground again.

Meanwhile, the carbon released by both combustion and thaw adds additional greenhouse gases to the atmosphere.

The 2023 Canadian fire season demonstrated the scale of this problem. A Nature study estimated approximately 647 million tonnes of carbon (647 TgC) were emitted by Canadian fires from May through September 2023—comparable to the annual fossil-fuel carbon emissions of a major industrial nation. The burned area was more than seven times the average annual area of the preceding four decades.

The climate system is therefore not merely warming the Arctic.

It is increasingly capable of removing the mechanisms that kept the Arctic frozen.


Then Came Nepal and Tibet

And this brings us to the next level of the argument.

On August 26, 2026, a massive collapse occurred in the Nepal–Tibet border region.

A glacier and associated rock mass collapsed from approximately 5,200 meters, sending ice, rock, sediment and water cascading more than 1,200 meters into the valley below. The resulting event produced a catastrophic flash flood through the Bhotekoshi and Trishuli river systems.

The scale was extraordinary.

By September 3, more than 1,200 people had been reported dead in Nepal, thousands remained missing, entire communities had been destroyed, and thousands of homes had been destroyed or rendered uninhabitable.

It might be premature to claim that the 2026 El Niño directly caused the Nepal–Tibet collapse. The scientific investigation is still developing. But that does not make the event irrelevant to tipping-point dynamics.

Quite the opposite.

It demonstrates what happens when multiple components of a cryospheric system become unstable simultaneously.

Glacier.

Rock.

Water.

Permafrost.

Slope stability.

River system.

Infrastructure.

One failure can trigger another.

That is the essence of a tipping cascade.


The Second Derivative of the Problem

The August 26, 2026 Nepal–Tibet event was something more than simply another climate disaster.

The first derivative is change. The second derivative is acceleration of change.

But there is another level beyond acceleration:

the coupling of changes.

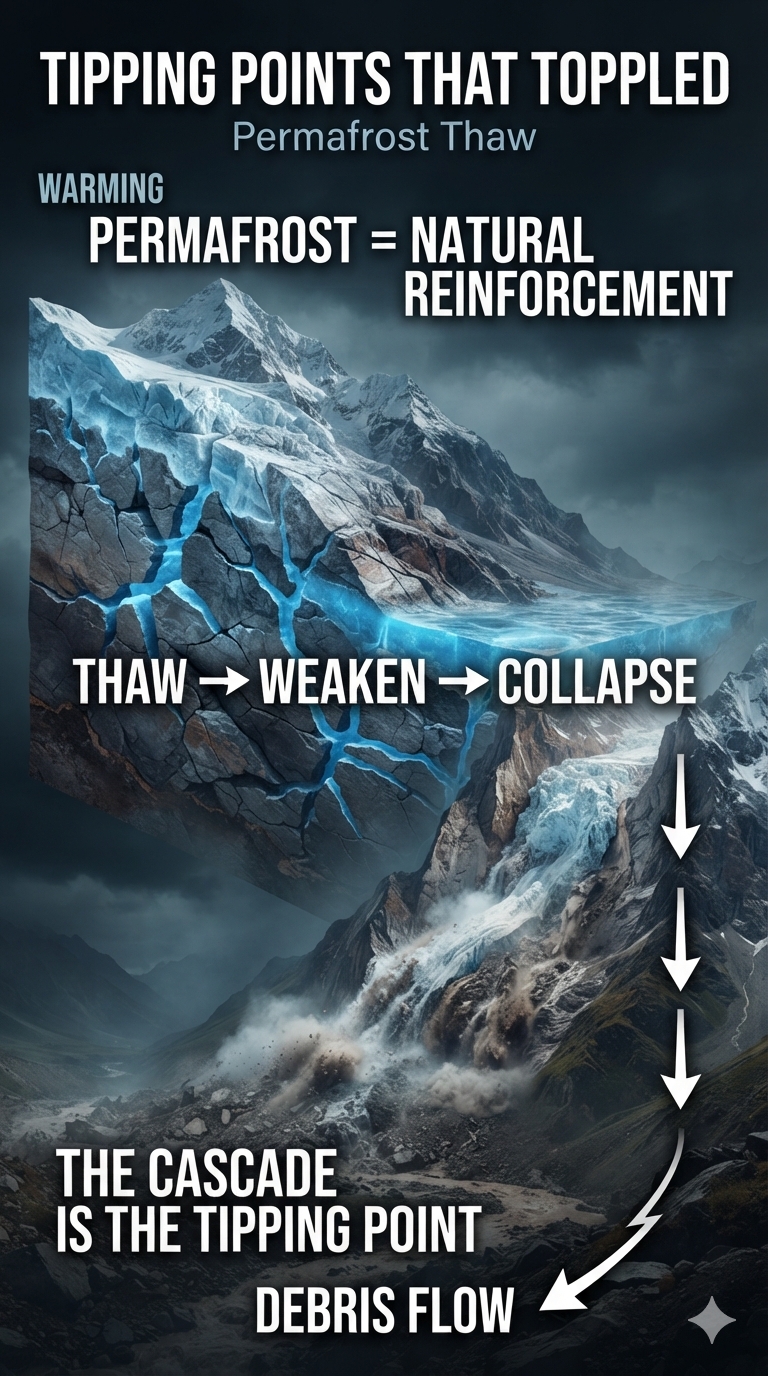
A glacier loses mass. Permafrost warms. Ground ice melts. Water penetrates fractures. The frozen material that once helped bind rock and soil together loses strength. Slopes become unstable. Rock loses support. Glacial ice moves. A glacier, rock mass, or entire mountainside collapses. The collapse mobilizes ice, water, sediment and debris. The resulting torrent can destroy roads, bridges, vehicles, homes and entire sections of river valleys.

One destabilized component triggers another.

That is a tipping cascade.

And this is precisely why treating every tipping point as an isolated phenomenon misses the larger danger.

Permafrost Is the Glue

Following the catastrophic August 26, 2026 bedrock failure and glacier collapse along the Nepal–Tibet border near Langtang Lirung, geomorphologists have increasingly scrutinized the role of high-altitude permafrost in mountain stability.

In high-altitude alpine environments such as the Himalayas, permafrost is not merely frozen soil. It can function as a critical structural component of the mountain itself.

Ice within fractures, rock pores and sediment acts as a natural cement. Frozen ground can increase the mechanical strength of slopes and help stabilize otherwise extremely steep terrain. When that ground warms and the ice melts, the mechanical properties of the mountain change.

The mountain does not simply become warmer.

It becomes structurally weaker.

That distinction is fundamental.

For thousands of years, freezing temperatures helped lock together rock, sediment, ice and soil. Climate warming attacks that system from multiple directions simultaneously. Higher air temperatures warm the ground. Changing snow cover alters the insulation of the surface. Meltwater and rainfall can penetrate fractures. Repeated freeze–thaw cycles weaken rock. And as permafrost ice melts, the frozen bonds that previously helped hold the landscape together disappear.

The result can be progressive destabilization followed by abrupt failure.

This creates a particularly dangerous feedback:

warming → permafrost thaw → loss of structural strength → slope instability → collapse → debris and water mobilization → downstream destruction.

And the process does not necessarily stop at the first collapse. A collapsing glacier can destabilize rock. A rock avalanche can displace enormous quantities of water. Water can erode and destabilize additional slopes. Sediment can transform a river into a rapidly moving debris flow. The debris flow can destroy infrastructure and alter the river channel. A newly formed blockage can create a temporary lake that becomes another hazard when it fails.

In other words, the mountain itself can become a chain reaction.

The Permafrost Connection

This is where the Nepal–Tibet event becomes particularly important to the broader tipping-point argument.

Permafrost is one of the hidden components of the cryosphere. Unlike a retreating glacier, its destabilization is often invisible until the physical structure it supports begins to fail.

You may not see permafrost disappearing. You see what happens after it disappears. You see rockfalls. You see landslides. You see collapsing slopes. You see thermokarst. You see rivers suddenly carrying enormous quantities of sediment. And, in extreme cases, you see entire mountainsides transform from solid terrain into a rapidly moving mixture of rock, ice, water and soil.

That is why the Nepal–Tibet collapse can be viewed as a possible second-order manifestation of cryospheric destabilization.

The first-order effect is warming. The next effect is permafrost degradation. The next is loss of structural integrity. Then comes cascading physical failure. The climate signal has effectively been converted into mechanical energy.

Frozen ground becomes unstable ground.

Stable ground becomes a landslide.

A glacier becomes a flood.

A mountainside becomes a river of debris.

That is what makes tipping cascades so different from ordinary linear climate change. The danger is not simply that each component changes. The danger is that the components are connected. Permafrost can be the glue holding the system together.

Remove the glue, and the pieces do not merely move independently.

They can bring each other down.

This is the second derivative of the problem:

not merely that the climate is changing, and not merely that the rate of change is accelerating, but that increasingly unstable components are beginning to interact in ways that amplify one another.

And when those interactions become visible as collapsing mountains, cascading glaciers, flash floods and debris flows, the tipping point is no longer something we have to imagine.

You can watch it happen.


Climate Energy Becomes Fluidized

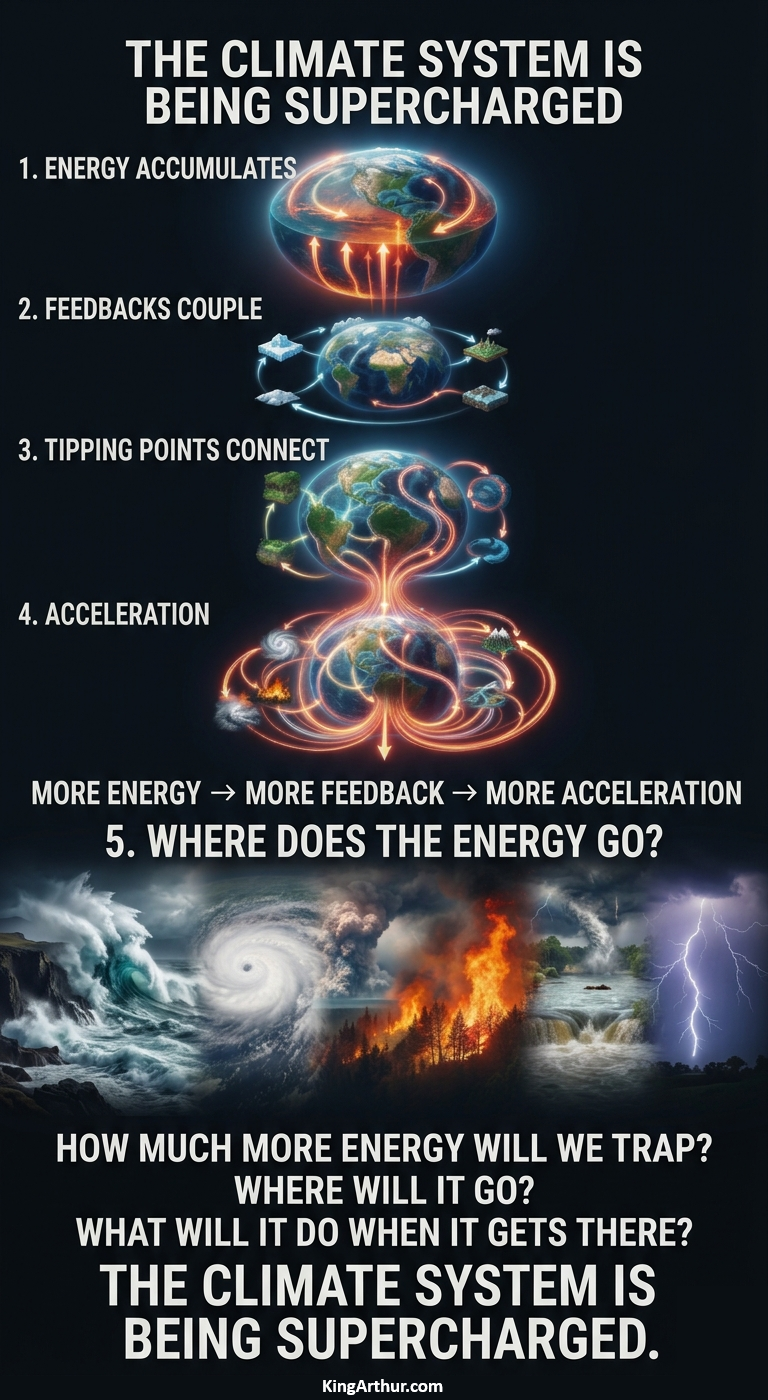
There is something visually profound about events like this. Climate energy is normally discussed in abstract units: joules, watts per square meter, degrees Celsius. But once enough energy accumulates in the Earth system, its consequences become physical.

Ice melts.

Rock fractures.

Slopes collapse.

Water accelerates.

Sediment becomes a moving fluid.

Rivers jump their banks.

Roads disappear.

Bridges are ripped from their foundations.

Cars, homes, trees and entire sections of mountains can become part of a single moving mass.

You can literally watch stored climate energy being converted into motion.

That is the part that makes these events so difficult to dismiss as theoretical.


From the Arctic to Pennsylvania

The connection is not confined to the Arctic.

When smoke from the Canadian wildfires descended into Pennsylvania in both 2023 and 2026, the feedback was no longer an abstract Arctic phenomenon. It became observable from the ground. People who had never seen the Arctic could see the consequences of an increasingly unstable northern climate hundreds or thousands of miles away.

The smoke was a visible atmospheric connection between a rapidly changing high-latitude system and everyday life in the northeastern United States.

That is another characteristic of cascading climate disruption:

distance stops protecting us.


The Dominoes Are Already Moving

This is ultimately “tipping points that toppled” means. A tipping point is often imagined as a single dramatic moment when a system suddenly crosses a line. Earth systems are rarely that simple. They are networks.

Coral reefs are connected to ocean temperature, marine heatwaves, disease, ocean chemistry and ecological recovery.

Permafrost is connected to air temperature, snow, vegetation, soil moisture, microbial activity, hydrology and fire.

Glaciers are connected to temperature, precipitation, meltwater, rock stability, permafrost and downstream hydrology.

These systems interact.

A destabilized system can therefore push another system toward instability.

That is the real danger.

The 2023–2025 coral bleaching catastrophe demonstrated how quickly a global ecosystem can be subjected to unprecedented simultaneous heat stress. The permafrost-fire relationship demonstrates how warming can activate feedbacks that reinforce the original warming. The 2026 Nepal–Tibet catastrophe demonstrates how instability within a cryospheric system can cascade through ice, rock, water and infrastructure.

And the 2026–2027 El Niño is now arriving on top of all of it.

NOAA’s current assessment gives this El Niño a greater than 90% probability of becoming very strong, with a substantial probability of reaching historic strength. We should therefore stop asking only:

“Has a tipping point been crossed?”

The more important question is:

“How many systems are already unstable enough that the next disturbance can push them into a new state?”

Because that is what tipping cascades look like. Not one domino. A row of them. And increasingly, we can watch them fall.

They are no longer merely theoretical.

They are observable.

They are physical.

And they are happening now.
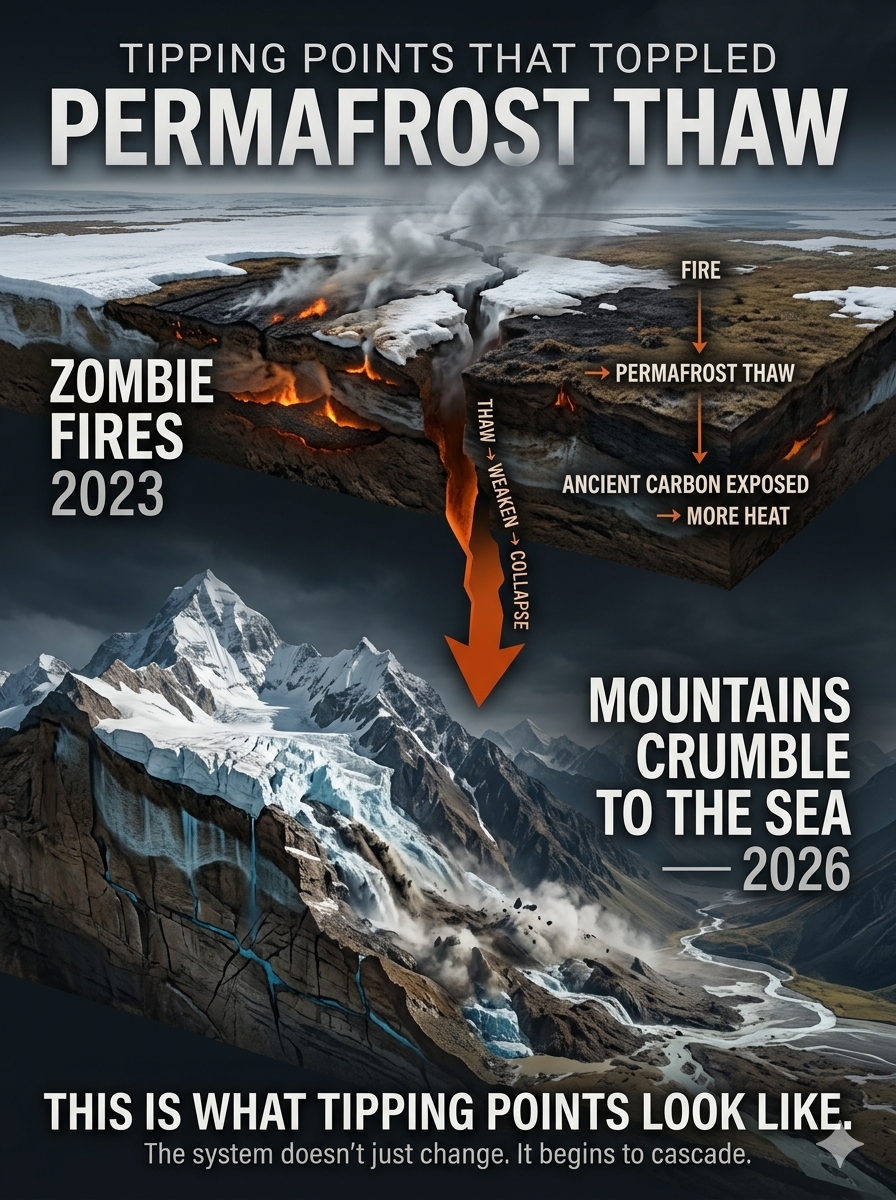
bookmark_borderTipping Point Season: Permafrost Thaw Simplified

by Daniel Brouse

Tonight’s homework assignment: Tipping Point Season.

Now that we’re deep into Tipping Point Season, my first assignment was to identify the most observable tipping points emerging this season and compare them with what we were seeing last season.

Tonight’s publishing is Permafrost Thaw: The Sequel.

The first chapter was the 2023 warning signal: zombie fires—wildfires that persisted underground through winter and re-emerged as the frozen landscape thawed. 🔥

The sequel is 2026: mountains crumble to the sea. 🏔️🌊

This is the “Second Derivative of the Problem”—when permafrost thaw moves beyond a change in temperature and begins changing the physical stability of the landscape itself.

As frozen ground loses its structural strength, rock fractures, slopes destabilize, and glacier ice, rock, water, sediment, and permafrost can become part of the same cascading failure.

The graphic tells that story in two acts:

🔥 2023 — ZOMBIE FIRES STARTED
Permafrost and carbon-rich ground begin releasing stored heat and carbon. A serious positive feedback.

🏔️ 2026 — MOUNTAINS CRUMBLE TO THE SEA
Frozen ground loses its reinforcing function, contributing to slope instability and enormous cascading flows of ice, rock, water, and sediment. The loss of snow, ice, and other reflective surfaces also reduces albedo across large areas, creating another serious positive feedback.

The first warning was underground.

The second became impossible to miss.

This is what tipping points look like—not isolated events, but cascading failures where one destabilization can help trigger another, and each new failure feeds back into the system, accelerating and amplifying the next.

bookmark_borderHOW IS CLIMATE ENERGY HITTING YOU? The First Law of Thermodynamics

by Daniel Brouse

The First Law of Thermodynamics and the Redistribution of Earth’s Excess Energy

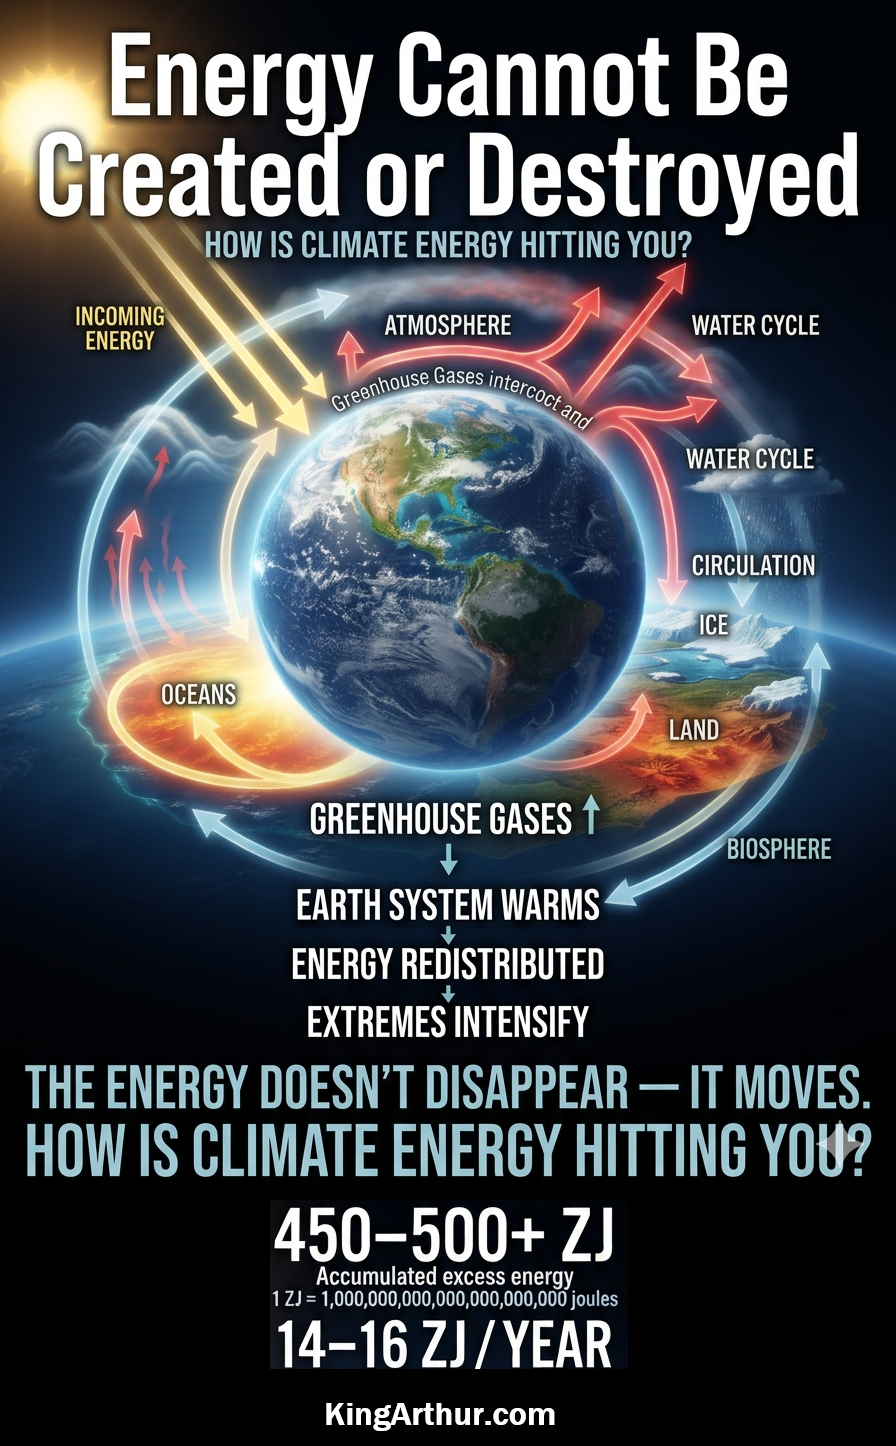
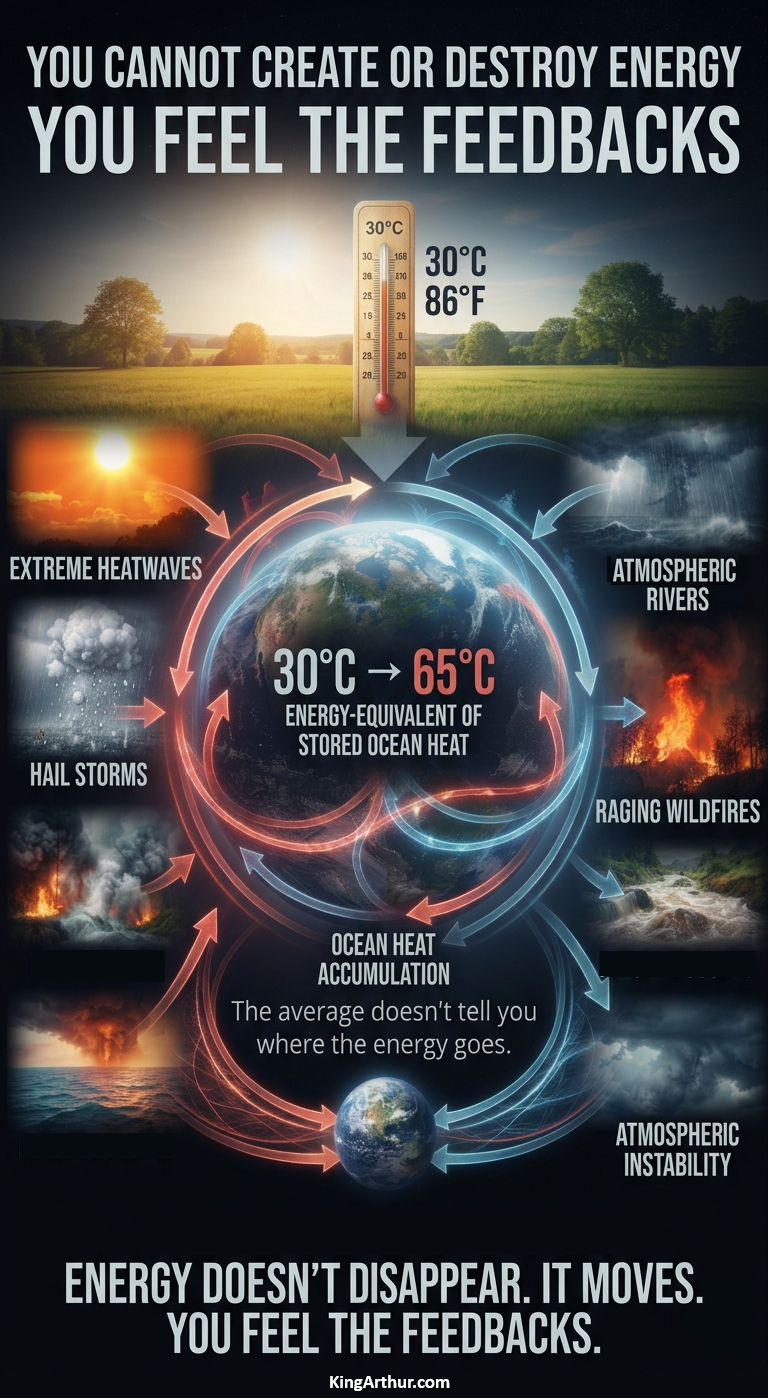
Energy Cannot Be Created or Destroyed

The principle that energy cannot be created or destroyed is known as the Law of Conservation of Energy, or the First Law of Thermodynamics. In simple terms, the total energy within an isolated system remains constant. Energy can change form, move from one place to another, or be stored in different components of the system—but it does not simply disappear.

That principle provides a powerful way to understand today’s changing climate.

Since the beginning of the Industrial Revolution, human activities have fundamentally altered Earth’s energy balance by increasing concentrations of greenhouse gases in the atmosphere. These gases reduce the rate at which infrared energy escapes to space, leaving the climate system with a persistent energy imbalance.

The result is not simply a warmer atmosphere.

The additional energy is being redistributed throughout the Earth system—primarily into the oceans, but also into the atmosphere, land, ice, and biosphere. On the scale of the entire climate system, the accumulated excess energy is enormous: hundreds of zettajoules. One zettajoule (ZJ) is equal to one sextillion joules:

1 ZJ = 1,000,000,000,000,000,000,000 joules

And the rate of accumulation has accelerated dramatically in recent decades. The climate system is now absorbing roughly 14–16 zettajoules of additional energy per year.

That energy cannot simply vanish.

So Where Does It Go?

This is the critical question.

The First Law tells us that the energy must go somewhere. The climate system continuously transforms and redistributes it through processes involving ocean heating, atmospheric circulation, evaporation, water vapor, melting ice, changing pressure patterns, storms, droughts, and biological responses.

In other words, climate change is not merely a temperature problem.

It is an energy-distribution problem.

A warmer ocean can provide additional energy and moisture to the atmosphere. Increased evaporation transfers energy into the water cycle as latent heat. Water vapor itself is a powerful greenhouse gas, creating additional warming feedback. Atmospheric circulation then transports heat and moisture across continents and oceans, sometimes concentrating enormous amounts of energy in particular regions.

The result can be expressed in many different ways:

🌊 More heat stored in the oceans
💨 More water vapor and atmospheric energy
🔥 More intense heat extremes
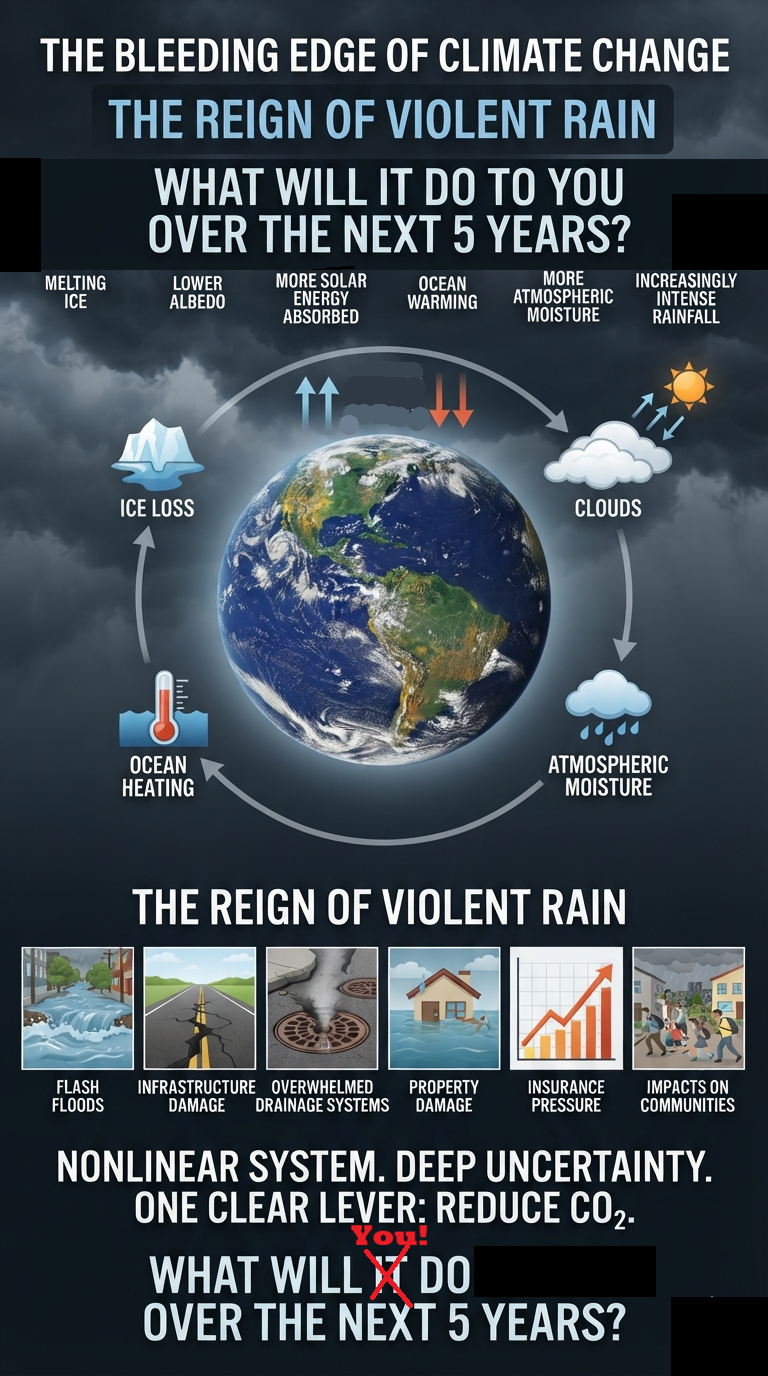
🌧️ Heavier precipitation and flooding
🌵 More rapid drying and flash drought
🌀 More energetic storms
🧊 Accelerated ice loss
🌡️ Longer and more persistent heatwaves
🌊 Rising sea levels and coastal flooding
🌲 Stress on ecosystems and agriculture

These are not separate energy problems. They are different manifestations of the same underlying physical reality.

Climate Energy Does Not Stay Where It Enters

The atmosphere and oceans are coupled components of a planetary system. Energy entering one part of the system can be transported, transformed, stored, and released somewhere else.

A pulse of additional energy absorbed in the tropical Pacific, for example, does not necessarily remain confined to the Pacific. Atmospheric circulation can redistribute heat and moisture across vast distances. Ocean currents can transport heat toward higher latitudes. Changes in evaporation can alter rainfall thousands of miles away. Changes in atmospheric pressure can modify storm tracks and circulation patterns.

This is why the consequences of a warming climate can appear far from the original source of the energy.

The energy is not being destroyed.

It is being rerouted.

The Question We Should Be Asking

The important question is therefore not simply:

“How much has the planet warmed?”

A more revealing question is:

“Where is all of this additional energy going—and how is it being redistributed through the climate system?”

That question shifts our focus from temperature alone to the physics of an increasingly energized planetary system.

The First Law of Thermodynamics gives us the starting point:

Energy cannot be created or destroyed.

But it can be transformed.

It can be transported.

It can be stored.

And it can be released.

The climate system is doing all four.

The question is no longer whether the energy exists.

The question is: How is that energy hitting you?

Public Access Introduction

🌎⚡ ENERGY CANNOT BE CREATED OR DESTROYED

So where does all that extra energy in the climate system go?

It doesn’t disappear.

It moves. 🌊💨💧🌀🧊🌱

The oceans absorb enormous amounts of heat. The atmosphere transports energy and moisture. Evaporation moves latent heat. Storms redistribute energy through intense precipitation. Ocean currents carry heat across the planet. Ice melts. Land heats and dries. Ecosystems respond.

And the greenhouse effect changes the planet’s energy balance—leaving more energy within the Earth system before it can ultimately escape to space.

450–500+ ZJ
🌡️ Accumulated excess energy

14–16 ZJ / YEAR
⚡ Approximate additional energy absorbed annually

The important question isn’t simply “How much has the temperature risen?”

It is:

HOW IS CLIMATE ENERGY HITTING YOU?

Weather. Water. Heat. Flooding. Drought. Ecosystems. Agriculture. Infrastructure. Risk.

The energy doesn’t disappear.

THE ENERGY DOESN’T DISAPPEAR — IT MOVES.

🌎⚡ How is climate energy hitting you?

bookmark_borderHow Is Climate Energy Hitting You? Backyard Megapitfall Traps

by Daniel Brouse

Public Access Introduction

🌎 HOW IS CLIMATE ENERGY HITTING YOU?

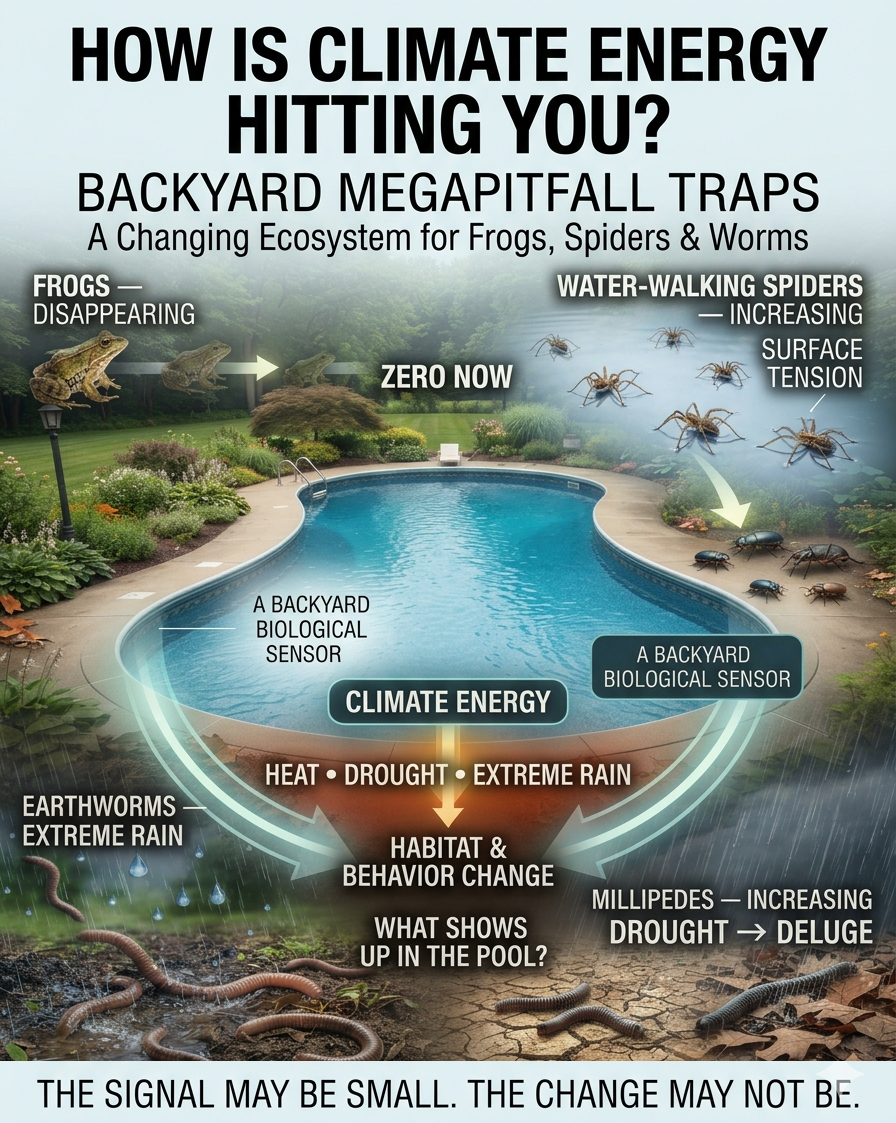
🏊 Backyard Megapitfall Traps: A Changing Ecosystem for Frogs, Spiders & Worms

What can a swimming pool tell us about climate change?

More than you might think.

A backyard pool can unintentionally become a giant ecological trap—and an unexpected biological sensor.

🪱 Earthworms increase after extreme rainfall.

🐛 Millipedes emerge during flash droughts and extreme evaporation.

🕷️ Water-walking spiders are increasing, potentially responding to greater prey availability.

🐸 And the most striking change?

The frogs have disappeared.

What was once a regular cycle of frog rescues and deaths has declined to zero frogs in the pool.

That doesn’t mean a backyard pool can prove climate causation. But it can reveal something important: ecological change leaves fingerprints.

Heat. Drought. Extreme rainfall. Evaporation. Habitat stress. Changing food webs.

These forces don’t remain somewhere far away in a climate model. They reach the backyard.

🌡️ Climate energy → weather extremes → habitat changes → animal behavior → changing wildlife

The pool is small.

The creatures are small.

But the ecological signal may not be.

🔎 Sometimes the first signs of a changing planet are right in your own backyard.


The Experiment

Backyard Megapitfall Traps: A Changing Ecosystem for Frogs, Spiders, and Worms

A swimming pool can unintentionally function as a giant megapitfall trap—an ecological trap that collects animals from the surrounding landscape. What falls into the pool, what survives, and what disappears can provide a surprisingly revealing snapshot of changes taking place in the local ecosystem.

Detection Surveys: Using Pools as Wildlife Traps

When scientists deliberately examine swimming pools to sample local wildlife or detect invasive species, the practice can be described as a swimming-pool detection survey. Because pools are already constructed, filled with water, and often surrounded by terrestrial habitat, they can serve as convenient passive sampling sites for studying urban and suburban biodiversity.

A backyard observation project in southeastern Pennsylvania has produced several striking changes over the past several years. Although a single backyard pool is not a controlled scientific experiment, the patterns are sufficiently noticeable to raise important questions about how changing temperature, precipitation, drought, and habitat conditions may be affecting local wildlife.

1. More Earthworms After Extreme Rainfall

Earthworms have become noticeably more common in the pool following intense rainfall events.

During heavy rain, saturated soils can force earthworms toward the surface. Flash flooding and rapid changes in soil moisture can then transport them across lawns and other surfaces, increasing the likelihood that they end up in the pool.

The connection to hydroclimatic whiplash—rapid swings between very wet and very dry conditions—is particularly interesting. Increasingly erratic precipitation can produce conditions in which soils cycle rapidly between saturation and drying, potentially altering earthworm movement and survival.

2. More Millipedes During Dry and Wet Extremes

Millipedes have also become more noticeable.

During dry periods, extreme evaporation and declining soil moisture can drive millipedes out of their preferred moist environments in search of shelter and water. When intense rainfall follows a period of drought, the resulting rapid change in soil conditions can further disrupt their normal movement patterns.

This combination of flash drought, extreme evaporation, and intense rainfall is another example of hydroclimatic whiplash affecting even the smallest components of the backyard ecosystem.

3. Water-Walking Spiders: An Unexpected Increase

Perhaps the most intriguing observation is not the number of dead spiders in the pool, but the increasing number of living, water-walking spiders.

Many terrestrial animals—voles, earthworms, beetles, and other insects—fall into the pool accidentally and eventually drown. Water-walking spiders are different. Their hydrophobic bodies and specialized legs allow them to exploit the water surface rather than simply becoming victims of the trap.

The pool can therefore function as an intentional hunting ground rather than an accidental death trap.

Surface tension provides the physical mechanism. The spider’s lightweight body and water-repellent structures allow it to distribute its weight across the water surface without breaking through. Rather than being trapped by the pool, these spiders can use it as habitat.

The noticeable increase in water-walking spiders may reflect several factors, including increased prey availability. This observation coincides with a noticeable increase in beetle activity and other potential food sources around the pool. However, despite the increase in beetle activity, there has not been a corresponding increase in beetle carcasses in the pool. One possible explanation is that the growing spider population is consuming more of the available prey before it accumulates as dead insects in the trap. While this remains a hypothesis, the simultaneous increase in spiders and apparent reduction in prey carcasses is an intriguing pattern worth further observation.

4. The Most Striking Change: Where Are the Frogs?

The most dramatic change in this backyard megapitfall record is the disappearance of frogs.

Frog rescues—and frog deaths—were once common occurrences. Over the past several years, however, the number has steadily declined until there have been zero frogs in the pool.

That does not, by itself, establish that climate change caused a local frog disappearance. But it is a striking observation because amphibians are among the world’s most threatened groups of vertebrates, and they are exceptionally sensitive to changes in temperature, moisture, disease, habitat, and water availability.

The disappearance of frogs from one backyard may therefore be worth viewing as a potential local ecological signal rather than simply an absence of frogs in a swimming pool.

Why Are Amphibians So Vulnerable?

Climate change can interact with multiple stresses that already affect amphibians. Four mechanisms are particularly important.

1. Loss and Drying of Breeding Ponds

Many frogs depend on temporary wetlands, vernal pools, shallow ponds, ditches, and other small bodies of water for reproduction.

Changes in precipitation, warmer temperatures, and increased evaporation can cause these habitats to dry earlier. If breeding pools disappear before tadpoles complete metamorphosis, an entire reproductive season can fail.

Repeated failures over several years can eventually eliminate a local population.

2. Terrestrial Dehydration

Frogs have highly permeable skin and depend on moist environments to maintain water balance.

During periods of extreme heat and drought, the landscape between a frog’s refuge and a backyard pool can become increasingly hostile. Hot lawns, dry soil, pavement, and other impervious surfaces can create barriers that frogs cannot safely cross.

Unlike a water-walking spider, a frog cannot simply tolerate prolonged exposure to a dry, overheated landscape.

3. Disease and Chytrid Fungus

Climate and weather can also interact with infectious disease.

Batrachochytrium dendrobatidis (Bd), commonly known as chytrid fungus, infects amphibian skin and has contributed to severe population declines and extinctions around the world.

The relationship between climate and chytrid disease is complex. Temperature and moisture conditions can influence pathogen growth, transmission, and host susceptibility. Climate change can therefore alter the geographic and seasonal conditions under which amphibian diseases spread.

4. Urbanization and Habitat Fragmentation

Climate stress does not occur in isolation.

Suburban development fragments forests, wetlands, and other amphibian habitat into increasingly isolated patches. A small local population may have nowhere to go when drought, extreme heat, disease, or another disturbance strikes.

Once a population disappears from an isolated habitat fragment, recolonization may be difficult or impossible.

A Backyard Window Into a Larger System

The swimming pool is not a climate instrument. It cannot tell us, by itself, why one species increases while another disappears.

But it can function as an unexpected biological sensor.

The pool collects organisms moving through the surrounding environment. Changes in what appears in the water—and what no longer appears—may reflect changes occurring beyond the pool itself.

Earthworms responding to extreme rainfall.

Millipedes responding to drying soils and sudden moisture.

Water-walking spiders exploiting a changing surface environment.

And frogs disappearing altogether.

These observations raise a larger question:

What happens when the energy entering the climate system is redistributed through the biological system?

Climate change does not arrive in our backyards as an abstract global average temperature. It arrives through altered rainfall, flash floods, drought, evaporation, heat, disease, habitat stress, and changing interactions among species.

Sometimes the evidence is visible in a satellite image.

Sometimes it is recorded by a weather station.

And sometimes, surprisingly, it is floating in your swimming pool.

Expert Perspective

The broader amphibian decline is well documented. The U.S. Geological Survey has reported substantial long-term declines in amphibian populations and has highlighted the vulnerability of amphibians to increasing heat and declining water availability.

One USGS analysis estimated an average annual decline in amphibian abundance of approximately 3.8% per year, with continued declines potentially causing species to disappear from large portions of their former ranges.

The lesson from the backyard pool is not that every ecological change can be pinned on climate change. The lesson is that ecological change leaves fingerprints—and sometimes those fingerprints appear in places we never thought to look.

What enters the trap matters. What survives matters. And what suddenly stops appearing may matter most of all.

The increase in earthworms following extreme rainfall, the surge of millipedes during swings between drought and deluge, the growing presence of water-walking spiders, and the disappearance of frogs are not isolated curiosities. Together, they form a changing biological pattern—a small, local record of a system under stress.

The backyard pool may therefore be more than a place where wildlife accidentally dies.

It may be a biological window into a changing climate.

A swimming pool is tiny compared with the planetary climate system. But climate change is not experienced as a planetary abstraction. It is expressed locally—in the soil, in the water, in insects and spiders, in amphibians, and in the species that suddenly become common or disappear altogether.

The megapitfall trap is small. The signal may not be.

What is happening in this backyard may be one tiny piece of a much larger planetary experiment—one that is already unfolding around us.

bookmark_borderHow Is Climate Energy Hitting You? Fluidization Physics

by Daniel Brouse

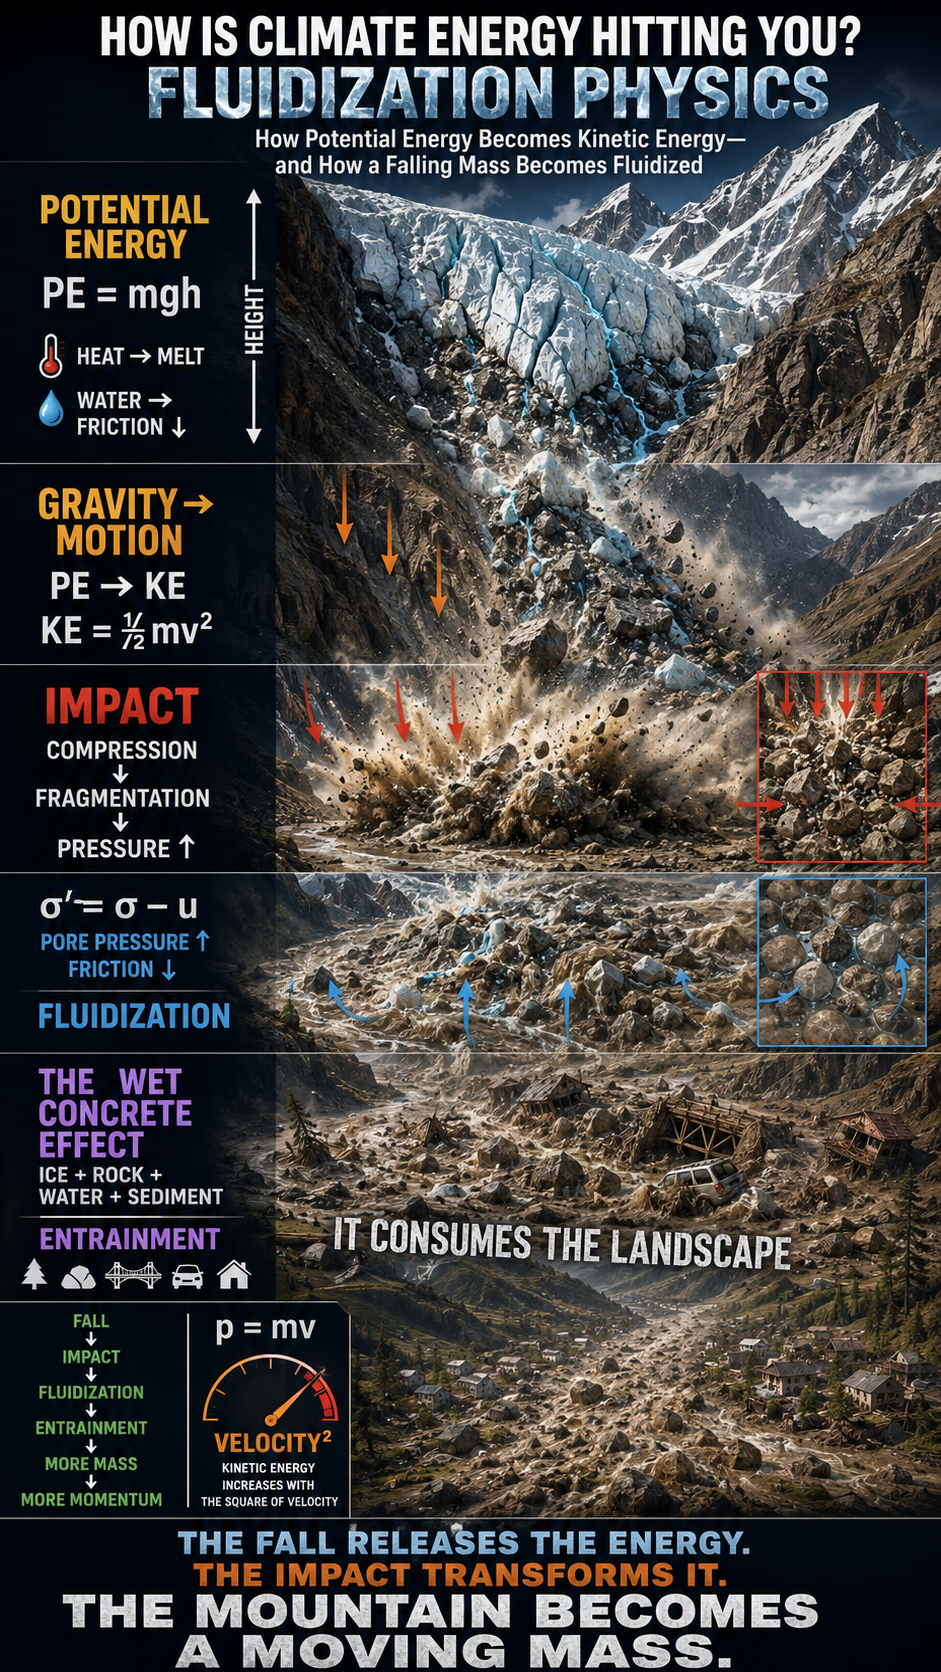
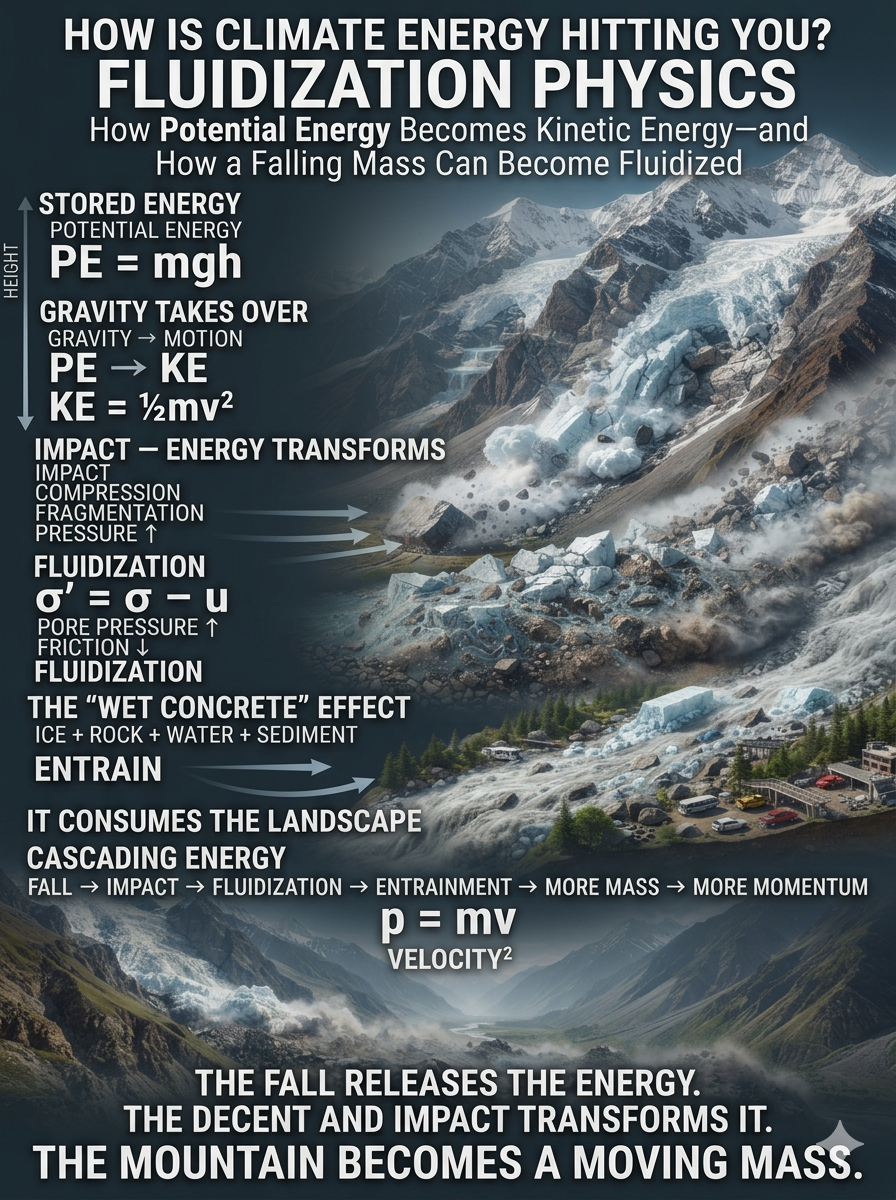
How Potential Energy Becomes Kinetic Energy—and How a Falling Mass Can Become Fluidized

Rocky Rex said, “The ice mass (or composite) came out of a hanging valley that contained a cirque, possibly starting to move as a rotational slump. So there’s a lot of potential energy right at the start of the process.”

That observation gets to the heart of the physics. The collapse itself is a gravitational event. Gravity supplies the immediate energy that drives the mass downward. The climate connection lies in how human-caused warming can alter the physical conditions under which that gravitational energy is released.

Heat can accelerate glacier melt. Meltwater can penetrate fractures and accumulate beneath ice. Rain and meltwater can increase pore-water pressure. Permafrost thaw can weaken previously frozen ground. Warming can therefore change the mechanical stability of ice, rock, soil, and sediment. Climate change does not need to physically push a mountain downhill. It can alter the conditions that determine when that mountain becomes capable of moving.

Then gravity does the rest.

Once the mass begins moving, another fascinating piece of physics takes over: water can actually make a moving granular system more mobile.

We generally think of water as something that slows things down. But water under pressure between particles can reduce the friction holding those particles together. In simplified form:

σ′ = σ − u

where σ′ is effective stress, σ is total stress, and u is pore-water pressure.

As pore-water pressure rises, effective stress falls. As effective stress falls, frictional resistance can decrease. That can make a slope or debris mass substantially more mobile.

This is one reason a wet, saturated mass can behave so differently from the dry rock, soil, and ice from which it originated. The material does not literally turn into water. Instead, water becomes part of a coupled solid-fluid system in which fluid pressure can support and mobilize solid particles.

Under sufficiently energetic and saturated conditions, a granular mass can become partially fluidized, allowing it to flow and transport enormous quantities of additional material.

That is the “wet concrete” effect.

The distinction is important. We are not talking about a solid block of ice simply sliding down a mountain. We are talking about a material system whose physical properties can change dramatically as it accelerates, fragments, mixes with water, and incorporates sediment and other debris.

And once that transformation begins, the physics becomes even more interesting.

The Fall Is Only the Beginning

The fluidization of the mass on the way down is remarkable physics. But the energy transfer at the bottom may be even more consequential.

The material did not strike the valley floor all at once.

The leading edge arrived first.

It collided with the valley floor and surrounding terrain, fractured, compressed, deformed, and began spreading. Behind it, enormous quantities of ice, rock, water, and sediment were still moving downhill.

That means the impact was not a single collision.

It was a cascading sequence of collisions.

The first material to arrive effectively became an impact surface for the material immediately behind it. The incoming mass continued transferring momentum into material that had already slowed, while the valley floor resisted the movement from below.

The basic relationship is:

p = mv

where p is momentum, m is mass, and v is velocity.

Changing the momentum of an enormous mass requires an enormous force. The rate at which that momentum is transferred matters as well:

F = Δp / Δt

The shorter the time over which momentum is transferred, the greater the instantaneous force.

This is why the impact of a massive debris flow is fundamentally different from simply placing the same amount of material on the ground. A stationary mountain weighs an enormous amount, but its weight is distributed through relatively stable structures. A mountain in motion has momentum. When that momentum is suddenly redirected, compressed, fragmented, or stopped, enormous forces are generated.

Four Hundred Million Tons in Motion

Early scientific estimates put the mass of the initial detachment at approximately 400 million metric tons, or about:

4 × 10¹¹ kg

That estimate was derived from the seismic forces generated by the collapse. The scale is difficult to visualize: roughly the equivalent mass of 1,000 Empire State Buildings moving as part of the collapse.

The estimated vertical elevation difference between the initial failure and the valley floor is approximately 1,200–1,300 meters.

That gives us a way to estimate the gravitational potential energy available to the system:

PE = mgh

Using 400 million metric tons and a 1,200-meter elevation loss:

PE ≈ 4.7 × 10¹⁵ joules

At 1,300 meters:

PE ≈ 5.1 × 10¹⁵ joules

That is approximately 4.7–5.1 petajoules of gravitational potential energy before accounting for the enormous energy losses and transformations that occur during a real collapse.

This does not mean that all of that energy became forward-moving kinetic energy. It could not. The collapse fractured ice and rock, deformed the terrain, generated heat and sound, produced seismic waves, increased pore pressure, and drove erosion and entrainment.

But it establishes the scale of the energy reservoir.

The Theoretical Velocity Scale

We can also ask what velocity that elevation difference represents in an idealized gravitational system.

If gravitational potential energy were converted entirely into kinetic energy:

mgh = ½mv²

which gives:

v = √(2gh)

For a 1,200-meter vertical drop, the theoretical free-fall-equivalent velocity is approximately:

153 m/s ≈ 343 mph

For 1,300 meters:

160 m/s ≈ 357 mph

Those numbers should not be interpreted as measured velocities of the actual debris flow. A landslide is not a frictionless free-fall object. Energy is continually consumed by fragmentation, friction, collisions, deformation, terrain geometry, fluid interaction, erosion, and entrainment.

The calculation instead tells us something more fundamental: the elevation difference represents an enormous gravitational energy source.

The actual flow velocity would depend on how efficiently that energy was converted into motion.

The Impact Becomes a Cascade

Now imagine the leading portion of that enormous mass reaching the valley floor.

It does not simply stop.

Some of its kinetic energy is converted into deformation of the ground. Some fractures rock. Some pulverizes ice. Some accelerates water. Some generates turbulence. Some increases pore-water pressure. Some becomes heat and sound. Some is transferred into the material immediately behind it.

And then the next mass arrives.

The process becomes:

Impact → compression → fragmentation → pressure → fluidization → continued motion → secondary impact

Then it happens again.

And again.

The mass behind the leading edge continues arriving with momentum. The material in front is compressed and displaced. Water and sediment are forced through the granular matrix. Pore pressure rises. Effective stress can fall. Friction can decrease. The material can spread and flow rather than simply pile into a stationary heap.

This creates a remarkable transition.

The impact itself can help create the conditions that allow the material to continue moving.

When the Pile Doesn’t Behave Like a Pile

Ordinarily, we expect a large quantity of rock to pile up when it reaches the bottom of a slope. But a heavily saturated, highly fragmented granular mass can behave very differently.

As the incoming material compresses the material beneath it, water trapped between particles can become pressurized. That pressure can temporarily reduce the effective contact forces between particles.

Again:

σ′ = σ − u

Increase u, and effective stress σ′ decreases.

That can reduce frictional resistance and allow the mass to rearrange and move.

Instead of:

rock → impact → pile

the process can become:

rock + ice + water → impact → fragmentation → compression → pore pressure → reduced friction → fluidization → flow

This is why “wet concrete” is such a useful visual description.

The material is still carrying enormous amounts of solid mass, but it can move with characteristics of a fluid.

The Flow Begins Consuming the Landscape

And this is where another critical process—entrainment—takes over.

The moving mass does not simply travel over the landscape.

It consumes the landscape.

As the flow moves downstream, it can erode riverbanks and valley walls, incorporate additional sediment and water, pick up boulders and trees, and destroy and incorporate infrastructure.

Every new piece of material adds mass.

More mass means more momentum at the same velocity:

p = mv

And when the added material is dense rock, it can also substantially change the bulk density and mechanical behavior of the flow.

The flow therefore becomes a changing system.

It starts with one composition at the glacier.

It has another composition halfway down the mountain.

And by the time it reaches the valley, it may contain ice, rock, water, mud, sand, gravel, trees, soil, concrete, vehicles, buildings, and fragments of the valley itself.

The original collapse has become something much larger than the original failure.

Density and Velocity Become the Amplifiers

For a moving flow, one useful way of describing the dynamic pressure scale is:

q = ½ρv²

Here, ρ is the bulk density of the moving mixture and v is its velocity.

Water has a density of approximately:

1,000 kg/m³

A heavily sediment-laden debris mixture might have a bulk density around:

1,500 kg/m³

as an illustrative midpoint.

At the same velocity, the denser mixture therefore has approximately 1.5 times the dynamic-pressure scale of water.

But velocity is even more important because it is squared.

Double the velocity and the dynamic-pressure scale increases by a factor of four.

That is why the combination of mass, density, and velocity is so important.

Water can push.

A dense debris flow can push while simultaneously carrying boulders, trees, ice, vehicles, and structural debris.

The difference is not merely that the water is “stronger.”

The moving material contains vastly more solid mass capable of transferring momentum through direct collision.

A boulder becomes a projectile.

A tree becomes a battering ram.

A vehicle becomes additional moving mass.

A bridge becomes debris that can strike whatever lies downstream.

The flow becomes both the delivery system and the source of additional projectiles.

The Cascading Impact

This is the part of the physics that fascinates me most.

The initial fall converts gravitational potential energy into motion.

The impact converts that motion into crushing, fragmentation, deformation, pressure, turbulence, and heat.

The pressure changes the frictional behavior of the material.

The reduced friction allows continued movement.

The continued movement entrains more material.

The additional material increases the mass of the flow.

The increased mass increases its momentum.

And then that larger moving mass impacts the landscape again.

The cascade becomes:

GRAVITY

↓

ACCELERATION

↓

IMPACT

↓

FRAGMENTATION + COMPRESSION

↓

PORE PRESSURE ↑

↓

EFFECTIVE STRESS ↓

↓

FRICTION ↓

↓

FLUIDIZATION

↓

ENTRAINMENT

↓

MASS ↑

↓

MOMENTUM ↑

↓

MORE IMPACT

This is not perpetual-motion physics. Energy is continually being dissipated. The point is that the energy released by the initial gravitational collapse is being redistributed through many interacting physical processes rather than disappearing at the first impact.

The valley floor becomes part of the energy-transfer system.

The Seismic Energy Is Only One Piece of the Story

The reported seismic signal provides another fascinating comparison.

A magnitude-5.2 seismic event was recorded from the collapse, and early estimates associated the seismic energy with roughly 1,000 tons of TNT equivalent. That corresponds to approximately:

4.2 × 10¹² joules

Compared with the estimated 4.7–5.1 × 10¹⁵ joules of gravitational potential energy associated with a 1,200–1,300 meter elevation loss, the seismic energy represents only a small fraction of the available gravitational energy.

That distinction is essential.

The magnitude-5.2 tremor does not mean that only 1,000 tons of TNT worth of energy existed in the collapse. It describes the portion of energy coupled into seismic waves.

The rest went into the physical destruction and transformation of the system: motion, fragmentation, deformation, erosion, fluidization, turbulence, heat, sound, and downstream transport.

In other words, the earthquake was a signal of the collapse—not a complete measurement of the collapse’s mechanical energy.

From Glacier to Wet Concrete

This is why the event is so interesting from a climate-physics perspective.

The climate connection begins before the mountain moves. Warming can alter glacier mass, meltwater production, permafrost stability, precipitation, soil moisture, and the mechanical conditions within and beneath ice and rock.

But once the failure begins, gravity becomes the immediate energy source.

The falling mass accelerates.

Ice and rock fracture.

Water becomes incorporated.

The impact generates enormous stresses.

Pore pressure rises.

Friction can fall.

The granular material becomes increasingly mobile.

Then the flow begins consuming the landscape.

More sediment.

More water.

More rock.

More trees.

More structures.

More mass.

More momentum.

And the result is no longer simply an ice collapse or a rockslide.

It is a coupled ice-rock-water-sediment system undergoing a rapid mechanical transformation.

A mountain begins as a collection of relatively stable materials.

Gravity sets it in motion.

Energy transforms its structure.

Water changes its friction.

Impact changes its state.

And entrainment turns the landscape itself into additional moving mass.

That is the physics behind the phrase:

Like wet concrete.

It isn’t just a metaphor for something thick and muddy.

It describes a system in which enormous quantities of water and solid material can become mechanically coupled into a dense, mobile mass—one capable of transferring momentum, carrying additional material, and continuing the cascade long after the initial glacier failure has occurred.

The initial fall releases the energy.

The impact transforms it.

Fluidization redistributes it.

Entrainment multiplies the moving mass.

And the resulting flow carries the consequences downstream.

bookmark_borderHow Is Climate Energy Hitting You? A: Like Wet Concrete

by Daniel Brouse

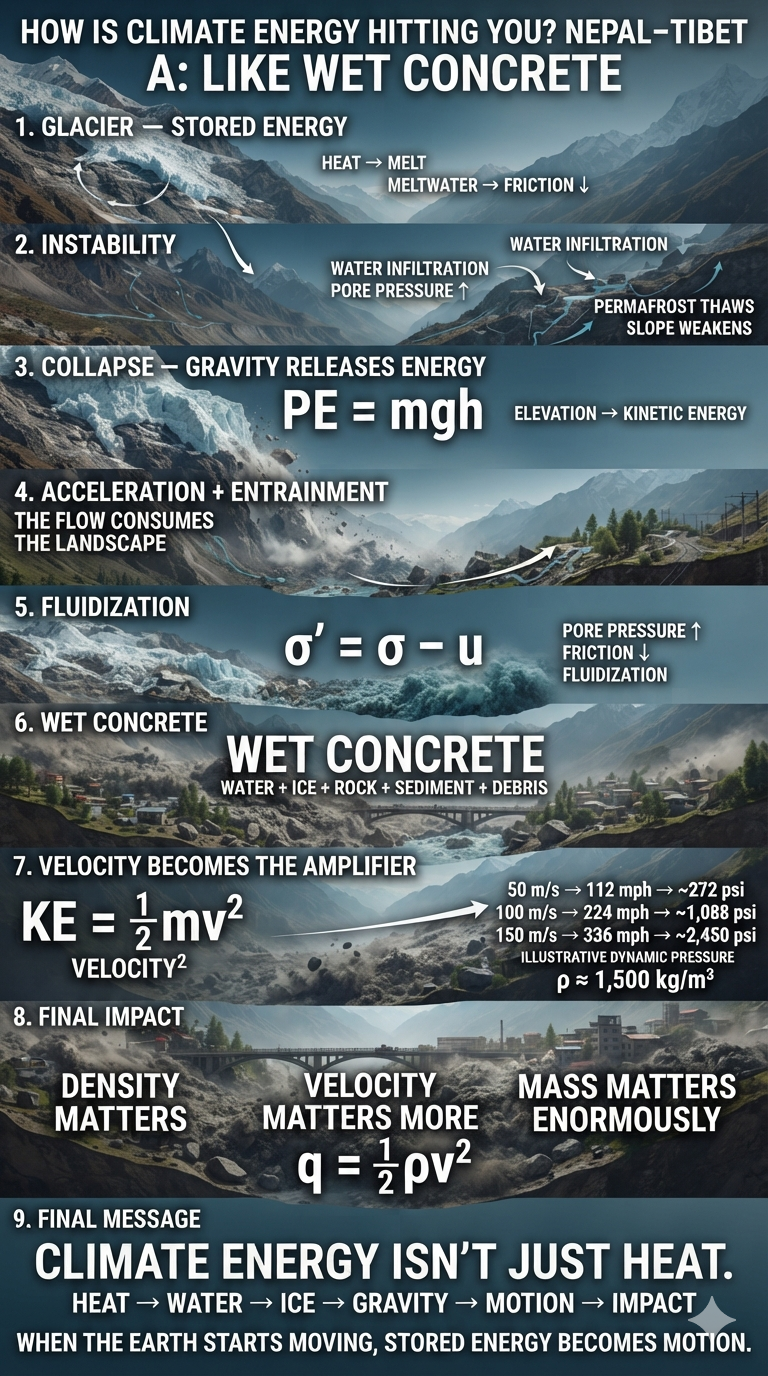
How Is Climate Energy Hitting You Nepal-Tibet?

A: Like Wet Concrete (Fluidize Physics)

Heat melts ice. Meltwater changes friction. Water infiltrates soil. Pore pressure rises. Permafrost thaws. Slopes weaken. Glaciers destabilize. Gravity converts elevation into kinetic energy. Moving water entrains sediment. Sediment increases density. Increasing density increases the potential force of the flow. Velocity increases kinetic energy according to v². And then the landscape itself becomes part of the moving mass.

The Physics of the Langtang Lirung Glacier Collapse

The sequence is more accurately understood as a progression from glacier failure to gravitational acceleration, fragmentation, collision and deformation, water and sediment entrainment, increasing pore-water pressure, reduced effective friction, partial fluidization, and ultimately high-mobility debris-flow propagation.

There was a video of what appeared to be a large boulder rolling along the top of the entrained material, sometimes seeming to bob up and down as the flow moved beneath it. At first, I thought I was simply watching rock being carried by a flood. But the more I watched, the more complicated the physics appeared to be.

The bulk of the larger rock and ice appears to have come through first, driven by the initial collapse, gravity, and the rapidly moving water and debris. In doing so, it essentially carved and scoured a channel through the valley. Then came something very different: an enormous mass of mud, sediment, ice, rock, vegetation, and structural debris—apparently reaching several stories in depth—that overwhelmed and buried villages.

As for whether what we are seeing is rock or ice, it was probably a combination of both. One report described the material as being like “wet concrete,” which is actually a remarkably useful way to visualize what was happening. It captures something that ordinary words like “flood” or “mudslide” don’t fully convey. This wasn’t simply water carrying a little mud. It was a dense, multiphase mixture of water, sediment, rock, ice, vegetation, and everything else it encountered, moving together as a highly energetic mass.

The Bridge Experiment Nobody Intended to Conduct

I also saw video of a bridge collapse that really demonstrated the power of the flow. What amazed me was what initially looked almost like “buoyancy.” The entrainment was so dense and forceful that the bridge appeared to be lifted onto the surface of the moving material, carried downstream, and then used almost like another projectile when it encountered a second bridge. The second bridge appeared to do something similar.

Both structures were ultimately carried downstream, taking out virtually anything and everything in their path. Of course, this isn’t true buoyancy in the simple sense of a bridge floating in water. The physics is more complicated. A dense debris flow can exert enormous upward, lateral, and drag forces on an object. A structure can become partially supported, displaced, rotated, or entrained by the moving mass beneath and around it. Once a structure becomes part of the flow, it is no longer simply an obstacle. It becomes debris—and that debris becomes part of the destructive machinery of the flow.

That is the remarkable thing about these events. Water, sediment, rock, ice, trees, buildings, bridges, and pieces of the riverbank can become mechanically coupled into one enormous moving system. The density increases. The mass increases. The momentum increases. And the destruction compounds.

The Physics Begins With Gravity

The most important number in understanding this event may not be the one-kilometer distance over which the material traveled. It may be the approximately 1,200–1,300 meters of elevation that the collapsing mass lost between the glacier and the valley floor.

The lower section of the unnamed glacier was reportedly located at approximately 5,200 meters—about 17,000 feet—on the northern slopes of the Mount Langtang Lirung massif. The Lhende Khola valley floor lies roughly 3,900–4,000 meters above sea level. That means the system had approximately 1,200–1,300 meters of vertical gravitational head.

That is an enormous amount of stored gravitational energy.

The gravitational potential energy of a mass is:

PE = mgh

where m is mass, g is gravitational acceleration, and h is the vertical elevation difference.

For every kilogram of material, a 1,200–1,300 meter elevation loss represents approximately 11,800–12,800 joules of gravitational potential energy. If all of that energy could somehow be converted perfectly into kinetic energy, the corresponding free-fall-equivalent velocity would be:

v = √(2gh)

For a 1,200-meter drop, that produces approximately 153 m/s, or 343 mph. For a 1,300-meter drop, it produces approximately 160 m/s, or 357 mph.

Those numbers are startling, but they need to be understood correctly. They do not mean that the debris actually struck the valley floor at 343–357 mph. They represent an idealized upper-bound velocity scale—the speed a mass would acquire if gravitational potential energy were converted perfectly into kinetic energy without energy losses.

A real glacier collapse is nothing like free fall. Energy is consumed by fracturing ice and rock, deformation, friction, collisions, turbulence, air resistance, terrain geometry, erosion, entrainment, and the conversion of organized gravitational motion into chaotic motion within the debris mass. The actual velocity would therefore have been substantially lower and would have varied throughout the event.

But the calculation is still important because it tells us how much energy gravity made available to the system.

When Ice, Rock, Water, and Debris Become One Moving System

The original material at the top was probably heterogeneous. There could have been ice, snow, rock, sediment, water, and other material mixed together. As the mass accelerated, it was subjected to enormous stresses. Ice fractured. Rock fractured. Sediment was stripped from the landscape. Water was incorporated into the moving material. Trees and vegetation were uprooted. Structures and riverbank material were entrained.

Every collision changed the composition of the flow.

This is where the term “entrainment” becomes extremely important. The moving mass doesn’t simply travel over the landscape. It consumes the landscape. It picks up additional sediment, rock, water, vegetation, soil, and structures along the way. That increases the mass of the flow while simultaneously changing its physical properties.

Once the material becomes heavily saturated, another process becomes critically important: pore-water pressure.

Water Can Reduce Friction

This is one of the strangest aspects of the physics. We generally think of water as something that slows things down. But water under pressure between particles can reduce the friction holding those particles together.

In simplified form:

σ′ = σ − u

where σ′ is effective stress, σ is total stress, and u is pore-water pressure.

As pore-water pressure rises, effective stress falls. As effective stress falls, frictional resistance can decrease. That can make a slope or debris mass dramatically more mobile.

This is one reason why a wet, saturated mass can behave very differently from the dry rock, soil, and ice from which it originated. The material doesn’t literally turn into water. Instead, the water becomes part of a coupled solid-fluid system in which fluid pressure helps support and mobilize the solid particles. Under sufficiently energetic conditions, a granular mass can become partially liquefied or fluidized.

That is the “wet concrete” effect.

Another Lubrication Effect: Meltwater Beneath the Ice

There is also the possibility of basal lubrication beneath moving ice. Meltwater accumulating beneath a glacier can reduce basal friction and permit basal sliding, sometimes dramatically increasing the mobility of the ice.

That makes footage showing substantial water emerging from beneath the glacier particularly interesting. If meltwater was present beneath the ice, it could have contributed to the initial mechanical instability. If water was also available downstream, it could subsequently become incorporated into the collapsing ice-rock mass.

This creates the possibility of a coupled sequence: meltwater can reduce basal friction and increase glacier movement; movement can contribute to collapse; collapse releases gravitational potential energy; acceleration causes fragmentation and entrainment; and increasing water content and pore pressure can subsequently reduce internal friction and promote fluidization.

This is not one process. It is several physical processes interacting with one another.

The Ground Itself Can Become Part of the Flow

There is another important factor. Thawing permafrost and destabilized soil and peat can weaken the material that normally helps hold mountain slopes together. Add unusually warm conditions and significant precipitation preceding the event, and you potentially have several destabilizing mechanisms operating simultaneously: meltwater infiltration, increasing water pressure, reduced basal friction, thawing ground, weakened sediment and rock, and gravity acting on a huge mass of ice and rock.

That is why I am hesitant to characterize an event like this simply as an “ice collapse” or a “rockslide.” It appears more useful to think of it as a coupled ice-rock-water system in which one failure mechanism can trigger another.

What Happened to the Ice?

The ice-water mixture near the top of the fall may have been predominantly ice. But after a 1,200–1,300 meter descent, followed by rapid fragmentation, collision, deformation, mixing, and entrainment, the material at the bottom would have been physically very different from the material at the top.

That doesn’t mean all of the ice necessarily melted during the descent. There is not enough information to make that claim. But the ice could have been extensively fractured and broken apart, while meltwater and pre-existing water became mixed with rock, sediment, and debris.

The composition of the moving mass could therefore have changed rapidly as it descended. By the time it reached the valley floor, the system could contain a complex mixture of water, ice, fine sediment, sand, gravel, large rocks, trees, soil, and structural debris.

The result can look almost like a giant mass of wet concrete.

And that visual description isn’t merely poetic. It reflects the fact that the material can have a density much greater than water while simultaneously behaving as a highly mobile fluid-solid mixture.

An Estimate of the Force of the Flow: The Damage and the Impact

The simplest starting point for thinking about the destructive pressure of a moving mass is dynamic pressure:

q = ½ρv²

The density of the individual components varies enormously. Water has a density of approximately 1,000 kg/m³; ice about 917 kg/m³; wood roughly 400–700 kg/m³; wet sediment roughly 1,500–2,000 kg/m³; concrete and masonry roughly 2,200–2,400 kg/m³; and rock approximately 2,500–3,000 kg/m³.

But the flow is not one of these materials. It is a mixture.

For a water-rich ice/water/debris flow containing substantial sediment and rock, a reasonable illustrative bulk-density range might be approximately 1,200–2,000 kg/m³. For calculations, approximately 1,500 kg/m³ is a useful illustrative midpoint.

That is about 50 percent denser than water.

And density matters because:

q ∝ ρv²

Velocity is squared. That is the critical point.

If velocity doubles, dynamic pressure increases by approximately four times. The same principle applies to kinetic energy:

KE = ½mv²

If velocity doubles, kinetic energy also increases by a factor of four.

This is why velocity is such a powerful amplifier of destructive energy.

Using the illustrative bulk density of 1,500 kg/m³, a flow moving at 50 m/s—about 112 mph—would have a dynamic pressure of approximately 1.9 MPa, or roughly 272 psi. At 100 m/s, about 224 mph, the calculated dynamic pressure rises to approximately 7.5 MPa, or roughly 1,088 psi. At 150 m/s, about 336 mph, it reaches approximately 16.9 MPa, or roughly 2,450 psi.

At the same velocity, a 1,500 kg/m³ debris mixture has 1.5 times the dynamic pressure, momentum density, and kinetic energy density of water. But its destructive potential can be substantially greater because the flow also carries solid mass—boulders, trees, ice, vehicles, structures and sediment—that can strike, crush and penetrate objects rather than simply flow around them.

The underlying relationship: density matters, velocity matters even more, and mass matters enormously.

The Energy Doesn’t Disappear When the Flow Hits

When the moving mass reaches the valley floor, the kinetic energy has to go somewhere. It cannot simply vanish. It is transformed into crushing, fracturing, deformation, heating, melting, turbulence, particle collisions, pore-water pressure, erosion, lateral spreading, and the acceleration of additional material.

And that is where the destruction can become self-reinforcing.

A moving rock strikes the ground and fractures. The fragments become part of the flow. The flow picks up more sediment. Water pressure rises. The material becomes more mobile. More material is entrained. More mass is now moving.

Structures are struck. Structures break apart. Their components become additional debris. The flow becomes both the delivery mechanism and the source of new projectiles.

This is why the damage can propagate far beyond the location of the original glacier failure.

The Three-Story-Deep Problem

When you see villages buried beneath what appears to be an enormous layer of mud, it can look almost as though the ground itself has turned into solidifying concrete or quicksand.

That visual impression makes sense. A deep, water-saturated debris flow can behave nothing like ordinary soil. It can be dense enough to support and transport very large objects while simultaneously being fluid enough to flow around buildings, trees, vehicles, bridges, and terrain.

The surface can look deceptively solid. But underneath, the material may still be moving.

That creates an extraordinarily dangerous environment for rescuers. The footage of rescue teams moving carefully across the surface—sometimes crawling on their bellies—is a powerful illustration of this physical reality. The surface is not necessarily solid ground. It may be the upper surface of a dense, unstable, water-saturated debris mass.

A person standing on it is not necessarily standing on stable earth.

They may be standing on the moving aftermath of a mountain.

Climate Energy Is Not Just Heat

This is where the event gives me a completely different perspective on climate change physics.

When we talk about climate change, we often talk about temperature. But temperature is only one part of the energy story.

Climate energy can move through the Earth system as water, ice, air, sediment, and rock.

Heat melts ice. Meltwater changes friction. Water infiltrates soil. Pore pressure rises. Permafrost thaws. Slopes weaken. Glaciers destabilize. Gravity converts elevation into kinetic energy. Moving water entrains sediment. Sediment increases density. Increasing density increases the potential force of the flow. Velocity increases kinetic energy according to v². And then the landscape itself becomes part of the moving mass.

That is the larger lesson.

The climate system doesn’t have to “create” the energy of a landslide. Gravity already provides the energy. Climate change can alter the conditions that determine when, where, and how that gravitational energy is released.

A warmer atmosphere can increase the amount of water available to the system. Melt can add water. Rain can add water. Thawing ground can remove structural stability. Water pressure can reduce friction. And once a mountain begins moving, gravity takes over.

That is what I mean by:

How Is Climate Energy Hitting You?

Sometimes it arrives as heat.

Sometimes as water.

Sometimes as ice.

Sometimes as a flood.

And sometimes, after passing through enough interconnected physical processes, it arrives as something that looks like wet concrete moving down a mountain.

That is climate energy in motion.


Public Access Version

How Is Climate Energy Hitting You Nepal-Tibet?
A: Like Wet Concrete

My homework assignment for tonight was born from curiosity about the Nepal-Tibet glacial collapse.

What was in the mixture? How did it change as it moved? Did the enormous amount of energy involved cause it to fluidize?

The answer appears to be yes.

What began as a mixture of ice, rock, water, and sediment transformed into an extremely dense, rapidly moving mass—something remarkably like wet concrete.

This is where “entrainment” becomes critical.

The moving mass doesn’t simply travel over the landscape.

It consumes the landscape.

It picks up sediment, rock, water, vegetation, soil, trees, and structures along the way. That increases the mass of the flow while simultaneously changing its physical properties.

Water increases pore pressure. Pore pressure reduces friction. Reduced friction increases mobility. Increased mobility produces more entrainment.

It becomes a feedback loop: more water, more mobility, more mass, more destructive energy.

And that is what grabbed my attention.

Climate energy isn’t just heat.

Heat melts ice. Water changes friction. Gravity converts elevation into kinetic energy. And once the Earth starts moving, the landscape itself can become part of the moving mass.

That’s how climate energy can hit you:

Like wet concrete.

bookmark_borderSea-Level Rise: Rubbing Salt in the Wound

by Daniel Brouse and Sidd Mukherjee

How Is Climate Energy Hitting You?

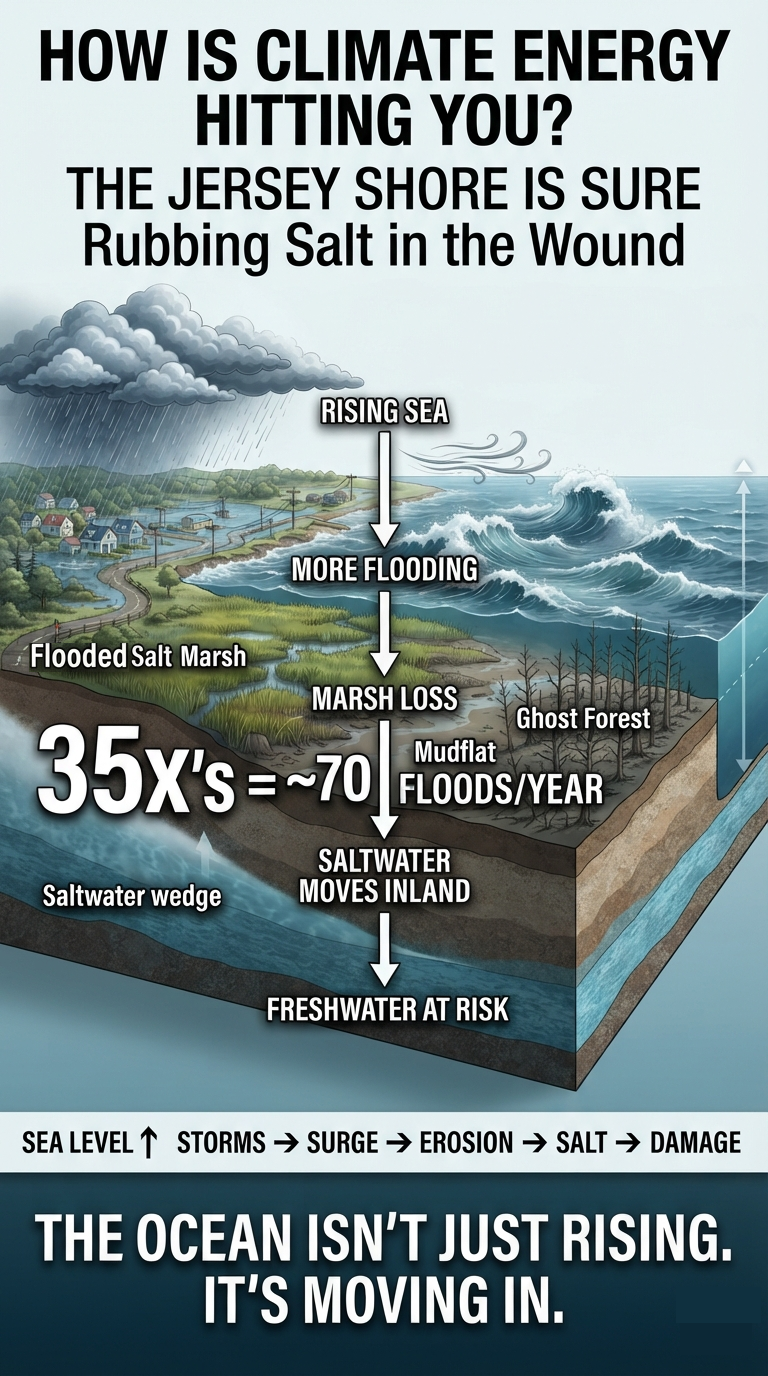
The Jersey Shore Is Sure

Sea-Level Rise: Rubbing Salt in the Wound

Sea-level rise is not simply a matter of the ocean getting higher. Climate change is altering the physical forces that move water toward and onto the shoreline. Rising seas, changing atmospheric pressure, stronger winds, altered ocean circulation, storm surge, king tides, and saltwater intrusion can interact to turn gradual sea-level rise into a much more immediate coastal threat.

A Real-World Warning: The Wetlands Institute

The experience of The Wetlands Institute in Stone Harbor, New Jersey, provides a striking example of how quickly coastal conditions can change.

The institute’s Salt Marsh Trail reportedly flooded only a few times a year around 2000. Over the past five years, flooding has averaged nearly 70 times annually. The institute is closing its headquarters on September 7, 2026, to begin a major coastal-resilience transformation.

The response includes raising the Salt Marsh Trail by two to three feet using clean dredged material, temporarily relocating operations and educational programs, and pursuing a broader campaign to replace and elevate the existing campus buildings.

This is more than an inconvenience. Increasingly frequent inundation can fundamentally alter the coastal ecosystem itself.

The Climate Shift

  • Accelerated sea-level rise: Sea levels along parts of the New Jersey coast are rising faster than the global average.
  • Marsh degradation: Repeated inundation can overwhelm salt-marsh vegetation, converting productive marsh into mudflats and eventually open water.
  • Wildlife disruption: More frequent flooding threatens habitats used by marsh-dependent birds and can interfere with diamondback terrapin nesting.
  • Infrastructure exposure: Roads, buildings, trails, drainage systems, and utilities face increasingly frequent flooding even without a major storm.

The critical point is that the climate signal is not experienced as a smooth, uniform rise in water level. It is experienced as more frequent encounters with water.


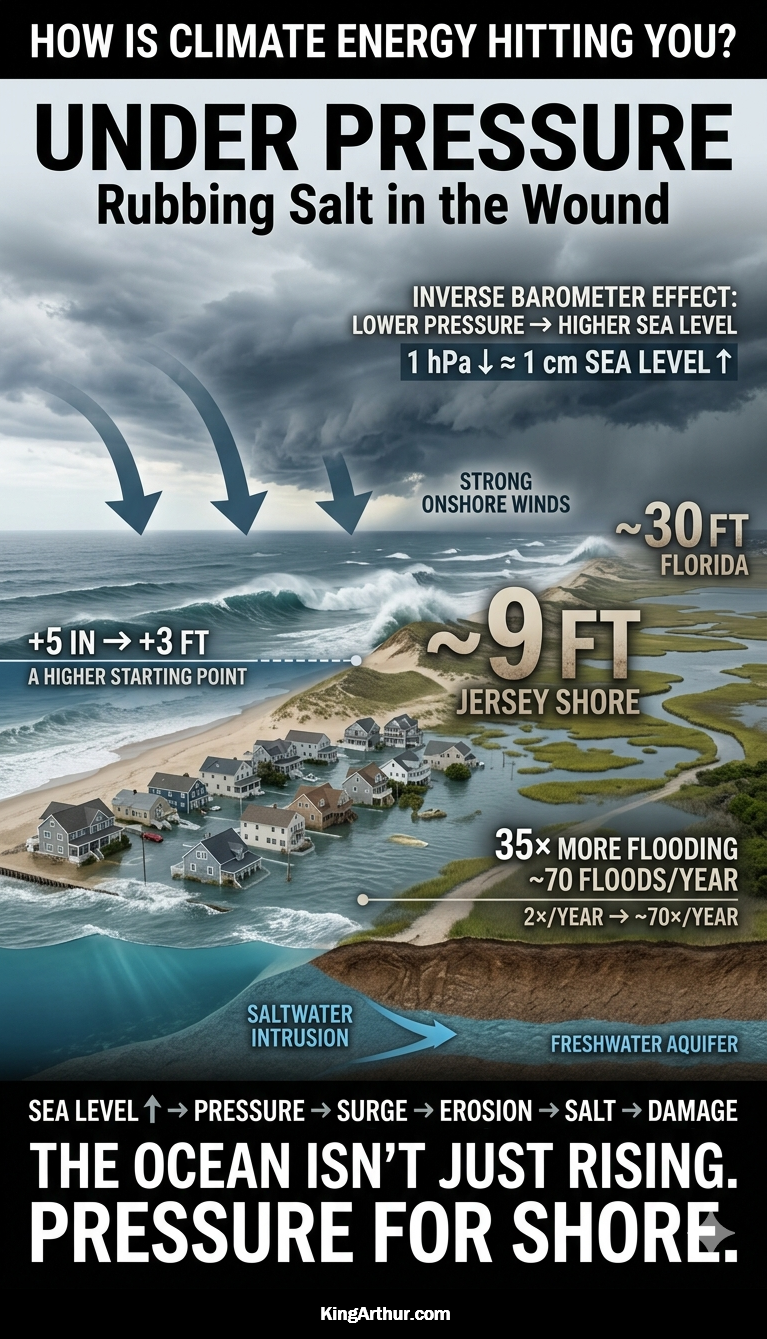
1. The Inverse Barometer Effect: Atmospheric Pressure Pushes the Ocean

Atmospheric pressure exerts physical force on the ocean surface. When a deep low-pressure system moves over the coast, the reduced atmospheric weight allows the ocean surface to rise.

The approximate relationship is:

A 1-hectopascal (hPa) decrease in atmospheric pressure produces roughly a 1-centimeter rise in sea level.

A very deep storm can therefore raise the local ocean surface substantially before the effects of wind-driven storm surge are even considered.

This is known as the inverse barometer effect.

Climate change does not simply “raise the sea.” It can alter the atmospheric conditions that determine how that elevated ocean is distributed along the coastline at any particular moment.

Inverse Barometer Effect Examples

Storm typeApprox. pressure near coastPressure drop from 1013 hPaInverse-barometer rise
Ordinary coastal storm990–1000 hPa13–23 hPa5–9 in
Strong nor’easter970–985 hPa28–43 hPa11–17 in
Very strong coastal storm950–965 hPa48–63 hPa19–25 in
Sandy-type extreme~945 hPa~68 hPa~27 in / 2.2 ft
Exceptional low-pressure event930–940 hPa73–83 hPa29–33 in / 2.4–2.8 ft

The Combined Impact

The inverse barometer effect combines with wind stress, coastline shape, bathymetry, wave setup, tides, and storm track can produce much larger water-level changes. Hurricane Sandy’s actual coastal water levels were dramatically higher because the pressure effect was combined with enormous wind-driven surge, wave action, tide, and the storm’s exceptionally favorable track. At Sandy Hook, water reached about 8.9 feet above ground level, while the storm produced major surge throughout the central and northern Jersey Shore.

An additional 5 inches to 3 feet of sea-level rise represents a new baseline of climate energy impacting coastal communities. The inverse barometer effect then combines with wind stress, coastline shape, bathymetry, wave setup, tides, and storm track to produce much larger water-level changes. The result can be extreme coastal flooding, with observed water levels reaching roughly 9 feet above ground level along parts of the Jersey Shore and as much as 30 feet in parts of Florida during major storms.


2. Wind and Wave Energy: Turning Pressure Gradients Into Coastal Damage

Atmospheric pressure gradients—the differences between areas of high and low pressure—drive winds.

When those gradients become stronger, winds can become stronger and more persistent. Strong winds transfer energy to the ocean, generating larger waves and increasing wind setup, the piling of water against the coast.

The consequences can include:

  • Higher water levels along exposed shorelines
  • Larger and more destructive waves
  • Increased dune erosion
  • Offshore transport of beach sand
  • Overtopping of coastal defenses
  • Greater storm-surge penetration

The shoreline therefore experiences not only a higher baseline sea level but also increasingly energetic ways of moving that water around.


3. Altered Ocean Circulation: When Water Piles Up

Changes in large-scale atmospheric circulation can alter ocean currents and regional sea levels.

The relationship between the Gulf Stream, the North Atlantic circulation, winds, and coastal sea level is particularly important along the U.S. East Coast. Changes in ocean circulation can redistribute enormous volumes of water, producing dynamic sea-level changes that may differ substantially from the global average.

In simplified terms, when ocean circulation changes, water can accumulate against a coastline rather than being transported away from it.

That means a community can experience a rapid increase in local relative sea level even when the global mean is changing much more slowly.


4. Compound Coastal Flooding: When Everything Arrives Together

The most dangerous coastal flooding occurs when multiple processes reinforce one another.

Imagine a high tide occurring while:

  • Global sea level is already elevated.
  • A low-pressure storm raises the ocean through the inverse barometer effect.
  • Strong onshore winds push additional water toward land.
  • Large waves increase water levels and erode dunes.
  • Heavy rainfall overwhelms drainage systems.
  • Rivers are already elevated and cannot discharge efficiently.

These processes can combine into compound flooding.

The problem is not simply that the water is higher. The problem is that multiple pathways for moving water onto the land are operating simultaneously.

Salt marshes normally provide a natural buffer. But repeated inundation and erosion can eventually overwhelm the marsh itself. Once protective wetlands deteriorate, more wave energy reaches infrastructure, creating a feedback loop of increasing exposure and increasing damage.


Saltwater Intrusion: When the Ocean Moves Underground

Sea-level rise has another consequence that is much less visible than coastal flooding: saltwater intrusion.

Saltwater intrusion occurs when seawater moves into freshwater systems, including groundwater aquifers, rivers, wetlands, agricultural soils, and drinking-water supplies.

Two forces are especially important:

  1. Rising sea level increases the hydraulic pressure and inland reach of seawater.
  2. Drought and reduced groundwater recharge weaken the freshwater pressure pushing outward toward the sea.

Together, these forces can shift the boundary between freshwater and saltwater inland.

Research has projected that saltwater contamination could affect a very large proportion of coastal aquifers by 2100, although the extent varies substantially by geography, aquifer characteristics, groundwater use, and future climate conditions.


How the Saltwater Wedge Moves Inland

Under normal conditions, rainfall replenishes groundwater. Freshwater flows toward the coast and maintains a hydraulic gradient that helps resist seawater intrusion.

Because freshwater is less dense than seawater, a freshwater lens can exist above denser saltwater beneath coastal areas.

But the balance can shift.

1. Underground Aquifer Intrusion

As sea level rises, the hydraulic pressure exerted by seawater increases. At the same time, climate-driven drought and higher temperatures can reduce groundwater recharge in some regions.

Less freshwater flowing toward the ocean means less outward pressure resisting seawater.

The underground saltwater boundary can therefore migrate inland.

This process can occur largely out of sight until a well begins producing water with elevated salinity.

2. Surface and Vertical Infiltration

Storm surge, king tides, and coastal flooding can push seawater onto land.

If that water remains on the surface, it can infiltrate downward through soils and shallow geological formations, contaminating groundwater.

Repeated flooding is especially important because a single event may be temporary, while dozens of inundation events each year can progressively alter soil and groundwater chemistry.

3. The “Highway Effect”

Human modifications to coastal landscapes can provide pathways for seawater to travel inland.

Agricultural drainage ditches, shipping channels, tidal creeks, canals, and other engineered waterways can connect coastal waters with areas that were historically protected by natural terrain.

When sea level rises or storm surge moves inland, these channels can function as highways for saltwater.


The Ecological and Economic Consequences

Saltwater intrusion does not stop at the shoreline.

Ghost Forests

As saltwater enters coastal soils and groundwater, freshwater-dependent trees can die from prolonged salt stress. The result can be stands of dead trees known as ghost forests.

These landscapes provide visible evidence that the boundary between marine and terrestrial ecosystems is moving inland.

Agricultural Damage

Salt deposited on agricultural land can accumulate in the root zone.

Excessive soil salinity interferes with plants’ ability to absorb water and can reduce crop productivity. Persistent salinization can make valuable coastal farmland increasingly difficult—or eventually impossible—to farm without expensive remediation and freshwater management.

Infrastructure Corrosion

Saltwater and brackish groundwater are highly corrosive.

Repeated exposure can accelerate deterioration of underground pipes, electrical infrastructure, concrete, foundations, roads, and other infrastructure.

The damage can occur beneath the surface long before it becomes visually obvious.

Drinking-Water Threats

Coastal communities that depend on groundwater face a particularly serious vulnerability.

Pumping already lowers groundwater levels around wells. If the freshwater table is lowered too far, the hydraulic gradient resisting seawater intrusion weakens further.

This can create another feedback:

More pumping → lower freshwater pressure → greater saltwater intrusion → less usable freshwater.


The Larger Picture: Climate Energy Does Not Disappear

Sea-level rise is one expression of a much larger physical process.

The additional energy accumulating in the climate system does not simply produce a higher average temperature. Energy moves through the atmosphere, ocean, land, ice, and biosphere.

Along the coast, that energy can appear as:

Higher baseline sea level → more frequent tidal flooding → stronger storm impacts → erosion → wetland loss → saltwater intrusion → infrastructure damage → freshwater stress.

The critical distinction is between average conditions and actual events.

A few inches of average sea-level rise may sound modest. But those inches can determine whether a high tide remains below a road or flows across it. They can determine whether a storm surge is absorbed by a functioning marsh or reaches buildings and infrastructure.

The climate system does not deliver its additional energy evenly.

It delivers it through water, wind, waves, heat, storms, erosion, flooding, and ecological disruption.

And along the coast, the ocean is increasingly finding more ways to come ashore—and stay there.

bookmark_borderTaking the Temperature of Climate Change

by Daniel Brouse and Sidd Mukherjee

Bend Over

Much of the world is focused on 1.5°C.

One reason the public has become so focused on this number is its simplicity. A 1.5°C (2.7°F) increase sounds like a straightforward, easily understood concept. It also doesn’t sound particularly frightening. After all, what’s the big deal about a couple of degrees of warming? Some people even portray it as potentially beneficial.

Scientists take a very different view.

There are many ways to look at climate change. At the micro level, millions of individual feedbacks are operating throughout the Earth system—between the atmosphere, oceans, ice, land, ecosystems, and human systems. At the macro level, all of those interactions combine to form a single, interconnected climate system.

The critical question is not simply how much the planet warms, but what happens as warming changes the system itself.

Understanding how these feedbacks interact—and, more importantly, how they amplify one another—is at the bleeding edge of climate science. The climate system is not a simple thermostat in which each additional degree produces a proportionally larger but otherwise predictable effect. It is a complex, nonlinear system capable of crossing thresholds and shifting into fundamentally different states.

That is why 1.5°C matters.

The 1.5°C threshold identified in the Paris Agreement—and the roughly 2°C level generally regarded as an even more dangerous boundary—is not important because the difference between 1.4°C and 1.5°C is somehow magical. These numbers matter because increasing global temperatures raise the probability of triggering major climate tipping points.

And once tipping points begin to activate, the question of whether warming ultimately reaches 2°C, 3°C, or even 4–7°C becomes much less relevant for two fundamental reasons:

First, tipping points can initiate self-reinforcing feedbacks that continue driving change even after the original forcing changes.

Second, the impacts do not necessarily increase gradually with temperature. They can accelerate, compound, and cascade as interconnected systems begin to destabilize.

In other words, 1.5°C is not a destination. It is not merely a warning sign or an alarm. It is a tripwire.

A warning sign tells you that danger is ahead. An alarm tells you that danger may already be present. A tripwire is different: it marks a threshold at which crossing the line can trigger a chain of events that becomes increasingly difficult to control or reverse.

That is the critical distinction that can be lost when climate change is reduced to a single temperature number.

The real danger lies not in the number itself, but in what the Earth system is doing as we move beyond it.

We are not simply adding another fraction of a degree to a static planet. We are increasing the energy entering a dynamic, interconnected system—and that additional energy is altering the very processes that determine how the system responds.

The question, therefore, is not simply, “How many degrees warmer will Earth become?”

The more important question is:

“What happens as we cross the tripwires?”

1. The Ocean Holds Most of the Energy Imbalance

The ocean holds most of the excess energy accumulating in the climate system. A deep-ocean study has revealed that even the deepest layers of the ocean are warming at a measurable rate.

The oceans absorb and store more than 90% of the excess heat trapped by greenhouse gases. In 2025, a tiny increase—one-tenth of a degree—was observed. That seemingly insignificant change represents an enormous amount of additional stored thermal energy. This represents an amount of stored thermal energy roughly equivalent to a 2°C increase in the atmosphere and surface system.

If the accumulated ocean heat were distributed across land surfaces, it would equate to an estimated 35°C increase in land temperatures—a level that would make much of the planet uninhabitable.

This illustrates how the oceans have been masking the full extent of the Earth’s energy imbalance, acting as a temporary thermal buffer while simultaneously undergoing changes of their own, including increased stratification, circulation changes, and ecosystem disruption.

The entire Pacific Ocean is running approximately 1.6°C above its long-term average—roughly six standard deviations above the mean. In climate science, deviations of this magnitude are virtually off the charts, underscoring just how far outside what we would consider normal variability the climate system has moved.

2. Tipping Points Take Over the Coupling and Acceleration

Tipping points can fundamentally change how the climate system responds by coupling positive and negative feedbacks across multiple components of the Earth system.

The overriding concern for humanity should not simply be the average surface temperature. It should be how the millions of interconnected feedbacks within the climate system will respond.

We have a pretty good understanding of some of these feedbacks. For many others, we don’t.

One of the simplest examples is the albedo effect.

The physics of albedo is straightforward: bright, reflective surfaces send a portion of incoming solar energy back into space, while darker surfaces absorb more of it. Less ice means more exposed dark surfaces, more absorbed energy, and therefore more warming.

But the system quickly becomes much more complicated.

How does changing albedo affect cloud formation, particularly over the tropics? And what happens to the climate if those clouds increase—or decrease?

Low clouds are especially important because they can reflect substantial amounts of incoming sunlight back into space. If tropical low clouds diminish, the ocean could absorb significantly more solar energy, accelerating warming.

This is where the bleeding edge of climate science begins.

Clouds are arguably the largest remaining uncertainty in our understanding of climate sensitivity. They can reflect incoming solar radiation, producing a cooling effect, while high, thin clouds can allow incoming sunlight through while trapping outgoing heat.

Which effect dominates—and how that balance changes as the planet warms—is one of the great unanswered questions in climate science.

Our expectation is that the climate system could eventually approach a new equilibrium around +4°C above the preindustrial baseline, perhaps over the course of a couple of centuries. That would imply roughly +2–3°C this century, with additional warming continuing into the next.

The important point is that climate change is not a simple linear equation.

It is a massively interconnected system in which a change in one component can alter another, which then feeds back into the first.

Ice affects albedo. Albedo affects heating. Heating affects clouds. Clouds affect radiation. Radiation affects ocean temperatures. Ocean temperatures affect evaporation and atmospheric moisture. And the cycle continues.

Conclusion

What matters most for human habitability is not simply the temperature we measure at the surface. It is the amount of energy remaining in the climate system and how that energy is redistributed.

If the temperature “only” rises 2°C while energy accumulation continues, the surface temperature becomes much less informative by itself. What becomes increasingly urgent is how that additional energy—measured in joules—is redistributed to your location.

The most obvious example is the supercharged water cycle.

For every 1°C increase in temperature, air can hold approximately 7% more water vapor. The atmosphere doesn’t care about the global average temperature. Many places can experience temperatures 10°C above their local average. That creates the potential for dramatically greater atmospheric moisture and, consequently, more intense rain, hail, and snow events when that moisture is released.

And indeed, we are seeing extreme flood events occurring with increasing frequency, including events described as having return periods of hundreds of years. Hail has also become one of the largest sources of insurance claims affecting homes, automobiles, and agriculture.

While the long-term equilibrium matters, there is a much more immediate question.

What happens to you over the next five years?

We are already seeing rainfall becoming more intense and, in many places, more destructive—violent. A warmer atmosphere can hold more water vapor, increasing the potential for extreme precipitation. The question isn’t simply how hot the planet might become over the next 50 years.

The more immediate question is:

What is the violent rain going to do to your home, your community, your infrastructure, your insurance—and you—over the next five years?

That is where climate change stops being a distant projection and starts becoming a personal reality.

Welcome to the future. Climate change is accelerating—and the acceleration itself is accelerating.

As tipping points become increasingly coupled and reinforce one another, the amount of energy moving through the climate system is accelerating—and the rate of acceleration itself is increasing.

At this point, the question is no longer simply, “How many degrees warmer will the planet become?”

The more important questions are: How much additional energy are we going to continue trapping? Where is all that energy going? And what will it do when it gets there?

We are already beginning to see the answers—in floods, heatwaves, flash droughts, wildfires, hailstorms, extreme precipitation, and increasingly volatile swings between opposing extremes.

These are not separate problems.

They are different manifestations of an increasingly energized climate system.

The planet does not experience climate change as a number on a thermometer.

It experiences it as energy moving through the system.

And that energy has to go somewhere.

The climate system is being supercharged.

The question is no longer whether that energy will affect us.

The question is where it will hit—and what it will do when it gets there.

Postscript: Where Does All That Energy Go?

Q: I don’t quite understand part of the paper. What does a “35 degree increase” in temperature mean? Where I live, a summer day can be around 30 degrees Celsius. Would this mean a summer day at around 65 degrees? (30+35=65). Wouldn’t that be lethal?

A: Good question. The answer is yes—and no. That’s actually part of the point of the paper.

A 65°C temperature at your location would obviously be lethal. But the 35°C figure is an energy-equivalent thought experiment, not a prediction that your local summer temperature would simply go from 30°C to 65°C.

The bigger problem with using average temperatures is just that—they are averages. An average of 65°C across a large area could mean one location is 30°C, another is 40°C, and another is far beyond either. The distribution of that energy matters far more to human habitability than the average itself.

And that’s where I don’t expect all of the already stored energy to behave “on average.” I don’t know exactly how that energy will hit you. It could manifest as violent rainfall, hail, heatwaves, wildfires, flash droughts, or any number of other energy transfers we haven’t fully anticipated.

But as long as that energy remains trapped in the Earth system, it doesn’t simply disappear. It continues moving through the system and interacting with everything else. You cannot create or destroy energy—you can only experience its feedbacks.

And yes, we would have to adapt. If conditions outside became routinely lethal, people might increasingly move underground or into heavily climate-controlled environments to survive.

In any event, an average of 65°C would be pretty close to hell—whether you’re experiencing it alive or studying it after the fact. 😏

bookmark_borderThe Bleeding Edge of Climate Change

by Daniel and Sidd

While Sidd was in town, I took some notes. Somehow, they turned into this:

Climate Change: The Big Picture

There are many ways to look at climate change. From a micro perspective, there are millions of individual feedbacks operating throughout the Earth system. From a macro perspective, there is the climate system as a whole.

Understanding how those feedbacks interact—and, more importantly, how they feed back into one another—is at the bleeding edge of climate science.

One of the simplest examples is the albedo effect. The physics of ice is straightforward: bright, reflective ice sends a portion of incoming solar energy back into space, while darker ocean absorbs it. Less ice means more absorbed energy and, therefore, more warming.

But the system quickly becomes much more complicated.

How does changing albedo affect cloud formation, particularly over the tropics? And what happens to the climate if those clouds increase—or decrease?

The low clouds are especially important. They can reflect substantial amounts of incoming sunlight back into space. If tropical low clouds diminish, the ocean could absorb significantly more solar energy, accelerating warming.

This is where the bleeding edge begins.

Clouds are arguably the largest remaining uncertainty in our understanding of climate sensitivity. They can both reflect incoming solar radiation and trap outgoing heat. Which effect dominates—and how that balance changes as the planet warms—is one of the great questions in climate science.

My expectation is that the climate system could eventually approach a new equilibrium around +4°C above the preindustrial baseline, perhaps over the course of a couple centuries. That would imply roughly +2–3°C this century, with additional warming continuing into the next.

But that remains uncertain.

The important point is that climate change is not a simple linear equation. It is a massively interconnected system in which changes in one component can alter another, which then feeds back into the first. Ice affects albedo. Albedo affects heating. Heating affects clouds. Clouds affect radiation. Radiation affects ocean temperatures. Ocean temperatures affect evaporation and atmospheric moisture. And the cycle continues.

Everything is nonlinear.

Yet uncertainty about the exact trajectory does not mean uncertainty about what we should do.

The clearest lever we have is still the same: reduce CO₂ emissions and slow the accumulation of greenhouse gases in the atmosphere.

And while the long-term equilibrium matters, there is a much more immediate question.

What happens to you over the next five years?

We are already seeing rainfall becoming more intense and, in many places, more destructive—violent. A warmer atmosphere can hold more water vapor, increasing the potential for extreme precipitation. The question isn’t simply how hot the planet might become over the next 50 years.

The more immediate question is:

What is the violent rain going to do to your home, your community, your infrastructure, your insurance—and you—over the next five years?

That is where climate change stops being a distant projection and starts becoming a personal reality.

bookmark_borderMoney Moves People: Why Demand Destruction May Be the Fastest Path Beyond Fossil Fuels

by Daniel Brouse

2026: The New Economic Reality

Money moves people.

The climate costs of fossil-fuel dependence are increasingly outweighing its benefits—not in some distant future, but here and now. We are moving beyond arguments about what climate change might cost decades from today. Across the Western world, climate impacts are already imposing costs of hundreds of billions of dollars in real time.

Insurance is only one part of the story.

Infrastructure, agriculture, transportation, labor productivity, public health, energy systems, and financial markets are all beginning to absorb the cost of a destabilizing climate. The economic question is therefore changing. It is no longer simply:

“What will climate change cost us?”

It is increasingly:

“How much are we willing to pay to preserve an energy system that is becoming progressively more expensive to maintain?”

Climate Stress Is Becoming an Economic Stress Test

The physical infrastructure of the global economy is already being affected.

Maersk CEO Vincent Clerc has warned that climate change is putting increasing pressure on European waterways and that substantial infrastructure investment will be needed to keep the Rhine operating as a critical transportation artery.

But the economic importance of waterways extends far beyond shipping.

Rivers, lakes, and reservoirs are also critical components of the energy, industrial, agricultural, municipal, and ecological systems that support modern economies.

When water levels fall or water temperatures rise, power plants can be affected directly. Thermoelectric and nuclear power plants rely heavily on water for cooling. If river flows become too low, or water temperatures become too high, operators may be forced to reduce generation or temporarily shut down units because sufficient cooling capacity is no longer available or because thermal discharge limits are exceeded.

That creates an economic chain reaction:

Lower river flows or higher water temperatures
↓
Reduced cooling capacity
↓
Reduced power generation
↓
Tighter electricity supplies
↓
Higher electricity prices and grid stress
↓
Higher operating costs for industry and consumers

The same waterways that transport fuel, raw materials, agricultural products, chemicals, and manufactured goods can therefore also be essential to producing the electricity needed to move and manufacture those goods.

Water is simultaneously a transportation system, cooling system, industrial input, agricultural resource, and ecological asset.

When that system becomes unstable, multiple economic sectors can be affected at the same time.

Low water levels can also restrict the movement of coal, oil, natural gas, grain, chemicals, construction materials, and other bulk commodities. Barges may have to reduce their loads or make more trips to transport the same volume of goods. In some cases, alternative transportation by rail or truck becomes necessary, increasing fuel consumption, congestion, labor costs, and emissions.

Flooding creates the opposite problem.

Excess water can damage ports, locks, bridges, rail connections, roads, warehouses, industrial facilities, and electrical infrastructure. A waterway can therefore become economically disruptive at both extremes—too little water and too much water.

Agriculture is similarly exposed. Rivers and reservoirs provide irrigation, livestock water, and municipal supplies. Persistent drought can reduce agricultural output while increasing competition among farmers, cities, industry, ecosystems, and energy producers for increasingly scarce water.

There is also a less visible economic cost: water temperature itself is becoming an economic variable.

Warmer rivers can reduce their ability to absorb additional heat from industrial processes and power-plant cooling systems. At the same time, warmer water can stress aquatic ecosystems, fisheries, and drinking-water systems, creating additional regulatory, treatment, and ecological costs.

This produces a broader economic concept that is often missed in conventional disaster accounting:

Waterway disruption is not a single-sector problem. It is a systems problem.

The Rhine and Danube are not simply waterways. They are components of Europe’s economic infrastructure. They connect ports, factories, power plants, farms, cities, mines, warehouses, rail networks, and consumers. When climate conditions interfere with their operation, the economic consequences propagate through the system. A river does not have to disappear to create an economic crisis. It only has to become less reliable. And reliability is one of the most valuable—and often least visible—assets in a modern economy.

The Economic Toll of Extreme Weather

Global extreme weather and natural disasters are generating enormous economic losses. Recent estimates from the International Chamber of Commerce, insurers including Swiss Re, and disaster-loss tracking organizations show that severe convective storms, wildfires, floods, and other extreme events are producing annual losses measured in the hundreds of billions of dollars.

The first half of 2026 alone has already produced approximately $100 billion in global economic losses, while the cumulative economic toll over the past decade has reached roughly $2 trillion, according to recent assessments.

And the year is not over.

The second half of the year normally includes the peak of the North Atlantic hurricane season, creating the potential for another substantial wave of losses.

The Major Economic Drivers

Escalating annual losses.
Global disaster losses continue to accumulate at extraordinary levels. The combined economic losses from 2022 and 2023 alone have been estimated at roughly $451 billion.

The concentration of U.S. losses.
The United States remains a major source of global insured catastrophe losses. By June 2026, the country had already experienced 12 billion-dollar weather and climate disasters, with estimated losses totaling approximately $31.9 billion.

Severe convective storms.
Hail, tornadoes, straight-line winds, and other severe thunderstorms have become an increasingly persistent source of financial losses. The United States recorded a record 21 billion-dollar severe-convective-storm events in 2025.

Extreme heat and productivity.
The economic damage from climate change is not limited to destroyed buildings and infrastructure. Heat reduces worker productivity, particularly in construction, agriculture, manufacturing, and outdoor occupations. Global heat-related productivity losses have been estimated at roughly 1% of world GDP annually—around $1 trillion.

The long-term U.S. bill.
U.S. billion-dollar weather and climate disasters have generated cumulative damages exceeding $3 trillion since systematic tracking began in 1980.

The Trajectory Is the Story

Recent U.S. disaster statistics illustrate the increasing economic burden:

YearBillion-Dollar EventsEstimated DamageMajor Loss Drivers
202523~$115 billionSevere storms, wildfires
202427~$182.7 billionSevere storms, tropical cyclones, extreme heat
202328$145+ billionSevere storms and other extreme events

The important point is not that every individual disaster can be attributed exclusively to climate change.

The economic signal emerges from the frequency, intensity, persistence, and cumulative cost of extreme conditions.

Climate change does not need to create every storm, flood, drought, or wildfire to transform the economics of risk. It only needs to increase the probability, severity, or duration of damaging events enough to alter the cost structure of society.

That is already happening.

“Demand Destruction” Is Our Friend

This brings us to one of the most powerful—and least appreciated—economic mechanisms in the energy transition:

Demand destruction.

The International Energy Agency has projected that global oil demand will decline more sharply than previously expected in 2026, forecasting a reduction of approximately 1.6 million barrels per day.

The significance extends beyond the number itself.

As an economist, I am less concerned with establishing a specific date by which the world must eliminate fossil fuels than I am with changing the economic forces that sustain fossil-fuel demand.

That distinction matters.

People do not necessarily change because someone wins an argument about climate science. They change because incentives change. Prices change. Risk changes. Availability changes. And eventually, behavior changes.

Money Moves People

I am unlikely to change the minds of the roughly 20% of Americans who are ideologically committed to policies that accelerate fossil-fuel dependence.

But that leaves the vast majority of the population. And economics can do much of the work. Integrated Climate Stewardship begins with reducing unnecessary consumption.

Consumerism drives energy demand, resource extraction, pollution, waste, and habitat destruction. Every unnecessary unit of consumption represents another demand for energy and materials somewhere in the global economy.

Consume less, and demand falls.

Demand falls, and the economic incentive to produce falls.

That is the mechanism.

The Economics of Personal Climate Stewardship

Today, only a small fraction of Americans appear to be pursuing a deliberately structured net-zero lifestyle through continuous behavioral reductions, efficiency improvements, and intentional balancing. But this does not mean the model cannot scale. The critical question is how climate stewardship is presented.

If reducing climate impact is framed exclusively as sacrifice, people resist. If it is framed as economic self-interest, the equation changes.

What happens when people discover that reducing unnecessary consumption can save them thousands of dollars a year?

What happens when energy efficiency lowers household expenses?

When smaller vehicles reduce fuel, maintenance, and insurance costs?

When reducing waste means buying fewer things that do not provide meaningful value?

When local production and durable goods become economically attractive?

When conservation becomes synonymous with financial resilience?

The behavior does not have to begin with ideology.

It can begin with a household budget.

Vote With Your Dollars

This is where the remaining majority of the population becomes economically important.

When millions of people begin making purchasing decisions based on cost, durability, efficiency, resilience, and environmental impact, they collectively alter demand.

When demand changes, markets respond. When fossil-fuel demand declines, the economic incentive to extract, refine, transport, and sell fossil fuels declines with it. This is fundamentally different from waiting for governments to impose every change from the top down. It is a bottom-up economic transition.

People do not have to agree about everything.

They do not have to become climate activists.

They do not even have to agree about climate policy.

They simply have to discover that some forms of consumption are no longer worth what they cost.

The Feedback Loop

The process can become self-reinforcing:

Lower unnecessary consumption
↓
Lower household costs
↓
Lower energy and resource demand
↓
Reduced fossil-fuel demand
↓
Lower economic incentive for fossil-fuel expansion
↓
Greater investment in alternatives and efficiency
↓
Further reductions in fossil-fuel demand

This is an economic feedback loop.

And unlike many climate-policy debates, it does not require everyone to agree on the destination before beginning the journey.

Demand Destruction Is the Transition

The transition away from fossil fuels is often described as a supply problem:

How quickly can we replace coal, oil, and natural gas?

But there is another side of the equation.

How quickly can we reduce the demand that makes fossil-fuel extraction profitable?

That may ultimately be the more powerful question.

We do not need to convince every person to become an environmentalist.

We need to make lower-carbon choices increasingly rational economic choices.

The climate crisis is already generating enormous costs. Insurance premiums are rising. Infrastructure is being stressed. Agricultural productivity is being disrupted. Heat is reducing labor capacity. Extreme weather is destroying capital. Supply chains are becoming more vulnerable.

These costs are not theoretical.

They are appearing on balance sheets, household budgets, insurance statements, government budgets, and corporate earnings reports.

The economic system is beginning to receive the bill.

And money moves people.

Demand destruction is not the enemy of the energy transition.

Demand destruction is the transition.