bookmark_borderLow-Level Cloud Feedback: The Unknown Mega-Multiplier

by Daniel Brouse and Sidd Mukherjee

Simplified Introduction

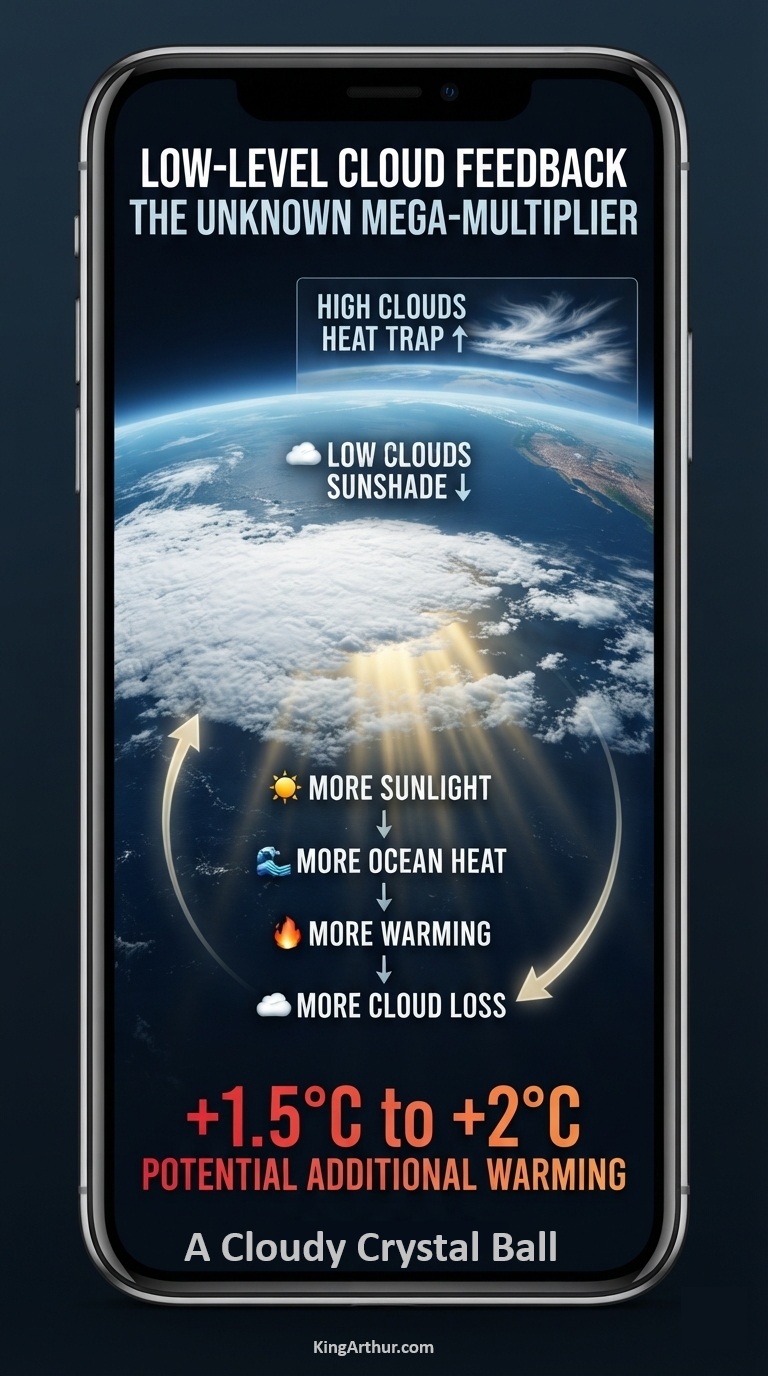
☁️🌎 LOW-LEVEL CLOUD FEEDBACK: THE UNKNOWN MEGA-MULTIPLIER

What if one of Earth’s most important climate amplifiers is something we still don’t fully understand?

Low-level marine clouds are more than weather. They are a planetary sunshade—reflecting enormous amounts of incoming sunlight back into space.

But what happens if that sunshade starts to disappear?

🔥 As the climate warms, low-level clouds over the Pacific may thin, weaken, and potentially reach a tipping point where marine stratocumulus cloud decks fragment.

Less reflective cloud cover means more sunlight reaches the dark ocean.

More absorbed solar energy means more warming.

And more warming can further disrupt the clouds.

That is a feedback loop.

But the bigger concern is what happens when this feedback couples with other warming feedbacks already accelerating across the Earth system.

🌀 Warming
↓
☁️ Low clouds diminish
↓
☀️ More solar energy enters the ocean
↓
🌊 Ocean warming accelerates
↓
🔥 Further climate warming
↓
☁️ More cloud disruption

Leading research suggests that the loss of low-level cloud albedo could contribute an additional 1.5°C to 2°C of global warming.

That would not be a minor correction to the climate trajectory.

It may be The Mega-Multiplier. In a tipping point scenario where clouds completely break up under extreme emission tracks, it could trigger a catastrophic, abrupt warming spike.

The climate system is not a collection of isolated feedbacks.

It is a coupled, nonlinear system in which feedbacks can interact, reinforce one another, and accelerate change.

☁️ The clouds may be one of the biggest unknowns.

And the Pacific may be where we need to look.

Read the full paper and explore the feedback cascade:

The Mega-Multiplier

The dynamic role of clouds is widely recognized as the single largest source of uncertainty in modern climate modeling. Cloud feedbacks can act as both blankets, trapping Earth’s heat, and sunshades, reflecting sunlight back into space.

As global warming has entered a faster decadal phase, leading research indicates that changes to both high- and low-level cloud structures are shifting toward a strong, positive warming-amplification loop.

1. High-Level Clouds: The Expanding Heat Trap

High-level clouds, such as cirrus clouds, reside above 20,000 feet. Composed primarily of ice crystals, they are relatively thin and transparent to incoming solar radiation, allowing sunlight to pass through them. However, they are highly effective at absorbing the outgoing longwave infrared radiation—heat—emitted from Earth’s surface and re-radiating it back downward.

The Anvil Cloud Expansion: Deep convective storms in the tropics create massive, fan-shaped high clouds known as tropical anvil clouds. As the upper troposphere warms and shifts, these clouds are expected to remain at higher, colder altitudes. Because they are colder, they radiate less heat out to space, increasing their efficiency as a planetary heat trap.

The High-Cloud Shift: Furthermore, climate models suggest that warming causes high-level clouds to shift toward higher latitudes, or poleward. This migration redistributes the heat-trapping effect over areas that are already experiencing accelerated melting, like the Arctic, compounding regional warming trends.

2. Low-Level Clouds: The Diminishing Planetary Sunshade

While high clouds act as greenhouse blankets, low-level clouds—specifically marine stratocumulus decks that sit below 6,000 feet—act as Earth’s primary solar sunshade. They cover roughly 20% of the subtropical oceans and reflect up to 30% to 60% of incoming sunlight back into space.

The shrinking of these low-level cloud decks, particularly over the northeast and southeast Pacific Ocean, is the focal point of intense scientific concern.

The Mechanics of Pacific Cloud Loss

Low-lying marine stratocumulus clouds depend heavily on a fragile thermal balance. They are sustained by a process called cloud-top radiative cooling, in which the tops of the clouds radiate heat out into space, cooling the air within the cloud layer. This cooling causes the air to sink, creating a convective loop that draws moisture up from the warm ocean surface below to maintain the cloud deck.

Global warming disrupts this system in two powerful ways:

Atmospheric Opacity: High concentrations of greenhouse gases render the lower atmosphere more opaque to infrared radiation. This traps heat above the clouds, warming their tops and stifling the cloud-top radiative cooling required to drive convection.

Enhanced Evaporation and Turbulence: As sea-surface temperature (SST) rises, the layer of dry air above the marine boundary layer grows warmer. This induces stronger turbulence that entrains—pulls down—dry, warm air from above, rapidly evaporating the thin cloud layer.

The Feedback Cascade

[Trapped Heat at Cloud Tops]
                 │
                 ▼
[Stifled Radiative Cooling]
                 │
                 ▼
[Weakened Convection / Increased Evaporation]
                 │
                 ▼
[DISAPPEARING LOW CLOUDS]
                 │
                 ▼
[More Sunlight Absorbed by Dark Ocean]
                 │
                 ▼
[Accelerated +1.5°C Warming]

The +1.5°C Climate Amplifier

Groundbreaking thermodynamic simulations, notably led by researchers at Caltech’s Linde Center, have revealed that low-level clouds possess a critical tipping point.

If greenhouse gas concentrations continue to rise unchecked, marine stratocumulus decks over the Pacific could reach an instability threshold where they fragment and dissolve into scattered, shallow cumulus clouds. Without the vast reflective white sheets to shield the ocean, the dark tropical and subtropical waters would absorb massive amounts of solar energy.

Calculations indicate that the loss of this cloud albedo feedback alone could add an additional 1.5°C to 2°C of global warming. In a tipping point scenario where clouds completely break up under extreme emission tracks, it could trigger a catastrophic, abrupt warming spike.

Even short of a total breakup, observational data from satellites indicates that a gradual thinning of these clouds is already underway. This slow degradation is believed to be a major factor behind the recent acceleration in Earth’s total energy imbalance and ocean heat uptake.

The Unknown Mega-Multiplier

Cloud feedback is different from many other climate feedbacks because the direction, magnitude, and interactions of cloud changes remain exceptionally difficult to constrain.

The fundamental physics are clear: clouds can either reflect incoming solar energy back into space or trap outgoing heat within the climate system. But their response to a warming planet depends on where clouds form, how high they are, how thick they become, how long they persist, how they interact with atmospheric moisture and circulation, and how those changes couple with other climate feedbacks.

That creates the possibility of a multiplier effect.

A reduction in low-level Pacific clouds allows more solar energy to enter the ocean. Additional ocean warming changes evaporation, atmospheric circulation, and moisture transport. Those changes can alter cloud formation and persistence, potentially producing further reductions in reflective cloud cover. At the same time, changes in high-level clouds can increase the retention of outgoing heat.

The result is not simply more warming.

It is a potentially coupled feedback cascade:

Warming → cloud changes → altered albedo and heat retention → more absorbed energy → additional warming → further cloud changes.

This is why low-level cloud feedback may represent one of the most consequential uncertainties in the future climate trajectory.

If Pacific low-level cloud cover continues to diminish, the planet loses part of its natural solar shield at precisely the time that greenhouse-gas concentrations are increasing and other climate feedbacks are accelerating.

The question is no longer simply whether clouds respond to warming.

The critical question is whether warming is pushing the cloud system toward a threshold where the loss of low-level marine cloud albedo becomes a self-reinforcing source of additional global warming.

If so, low-level cloud feedback could become the unknown mega-multiplier—a climate feedback capable of coupling with other tipping elements and accelerating an already nonlinear Earth-system response.
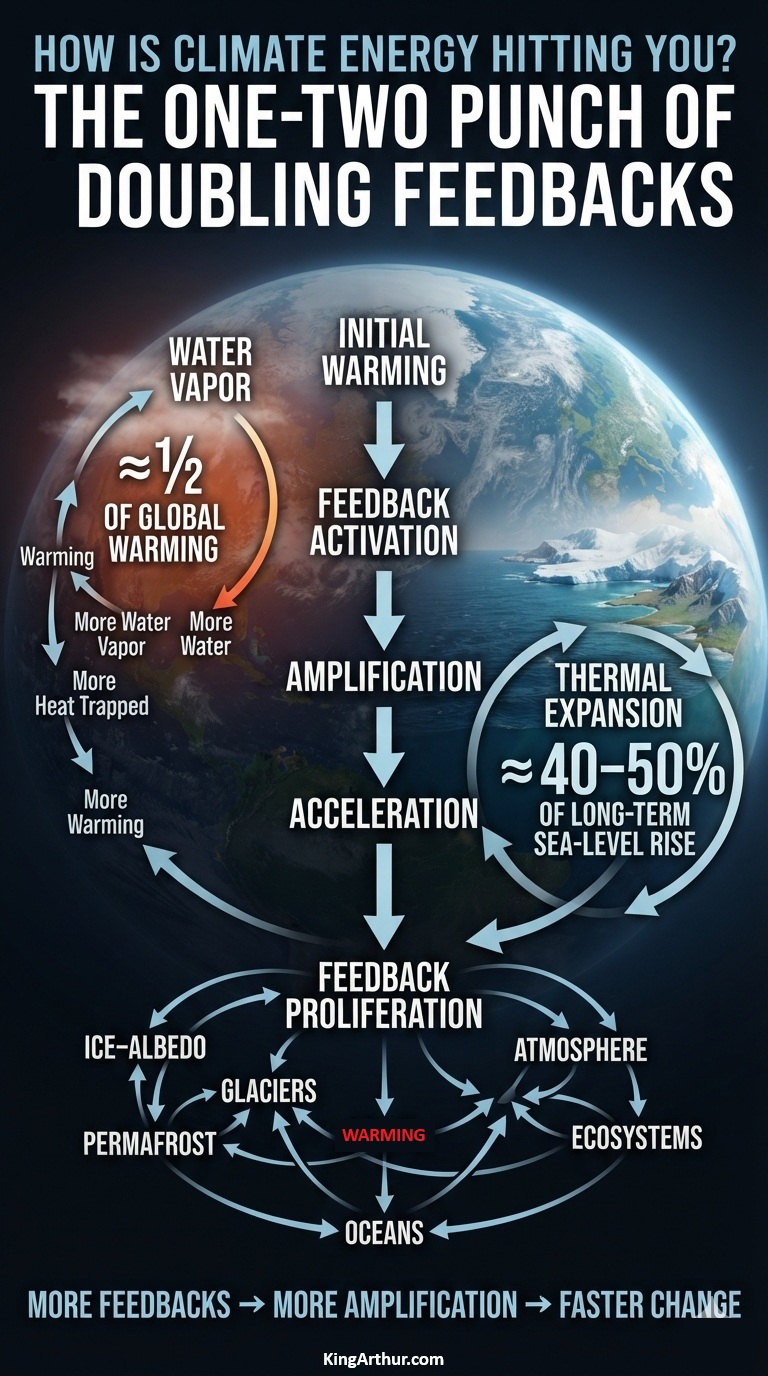
bookmark_borderHow Is Climate Energy Hitting You? The One-Two Punch of Doubling Feedbacks

by Daniel Brouse

The One-Two Punch of Doubling Feedbacks

Climate feedbacks are processes in which an initial change in Earth’s climate system triggers additional changes that amplify or dampen the original change. Positive feedbacks amplify the initial warming caused by greenhouse-gas emissions, accelerating climate change beyond what the initial forcing alone would produce.

As Earth’s climate system warms and destabilizes, millions of emerging feedback interactions are becoming active across the atmosphere, oceans, cryosphere, land, and living systems. Many of these interactions are now being observed for the first time in human history. As individual feedbacks activate, strengthen, and interact with one another, they create new pathways for amplifying climate change and accelerating Earth-system change.

Two important climate-system responses illustrate this one-two punch: water-vapor amplification and ocean thermal expansion.

Water Vapor: The First Punch

Water vapor is Earth’s most important natural greenhouse-gas feedback.

As the atmosphere warms, it can hold more water vapor. Because water vapor is itself a powerful greenhouse gas, additional atmospheric moisture traps more outgoing infrared radiation, causing further warming. That additional warming allows the atmosphere to hold still more water vapor.

It is a reinforcing cycle:

Warming → more water vapor → more heat trapped → more warming

Water-vapor feedback is Earth’s greatest climate amplifier. As temperatures rise, the atmosphere holds more water vapor, which traps additional heat and amplifies the initial warming. Water-vapor feedback is responsible for approximately half of the global warming observed since the 1990s, making it one of the most powerful mechanisms accelerating Earth-system warming.

Thermal Expansion: The Second Punch

The ocean delivers a different kind of climate response.

More than 90% of the excess heat accumulating in the Earth system is absorbed by the ocean. As seawater warms, it expands, increasing ocean volume and contributing to global sea-level rise.

This process is called thermal expansion or steric sea-level rise.

Thermal expansion has historically contributed roughly 40% to 50% of long-term global sea-level rise, with the remainder coming primarily from melting glaciers and ice sheets. The exact contribution varies over time and depends on the period and measurement method.

The process is straightforward:

Ocean warming → seawater expands → sea level rises → coastal erosion + increased basal melting → more meltwater → further sea-level rise

The One-Two Punch

The water-vapor and thermal-expansion processes demonstrate two different ways excess climate energy can double the impact of climate change. Water-vapor feedback can approximately double the warming impact of greenhouse-gas emissions, while thermal expansion can approximately double the sea-level-rise impact by adding substantial additional sea-level rise beyond the contribution from melting land ice alone.

Water vapor amplifies warming.

Thermal expansion raises the oceans.

And neither operates in isolation.

As warming increases, additional feedbacks can become activated or strengthened—including ice-albedo feedback, permafrost carbon release, glacier and ice-sheet loss, and changes in ocean and atmospheric circulation.

The result is not a simple linear response.

More warming → more feedbacks → more warming → greater physical impacts

That is the one-two punch of climate feedbacks: the initial energy imbalance changes the climate system, while reinforcing processes can amplify the consequences.

The question is no longer simply “How much has Earth warmed?”

The more consequential question is:

“What is that additional climate energy doing to the Earth system—and how quickly are the feedbacks making it worse?”

bookmark_borderHow Is Climate Energy Hitting You? Water Vapor

by Daniel Brouse

Water Vapor: The Steam Engine Multiplier

Water vapor is the greatest climate amplifier, acting as Earth’s most powerful natural feedback mechanism.

While greenhouse gases such as carbon dioxide (CO₂) and methane (CH₄) are the primary drivers of human-caused climate change, water vapor amplifies and multiplies their warming effects.

This amplification operates through a continuous, compounding feedback loop:

Initial Warming: Human activities release greenhouse gases, primarily through the burning of fossil fuels, which warms the atmosphere.

Increased Evaporation: A warmer atmosphere can hold more moisture. For every 1°C of warming, the atmosphere’s water-holding capacity increases by about 7%.

Amplified Greenhouse Effect: Water vapor is itself a greenhouse gas. As atmospheric moisture increases, it traps more of the heat radiated from Earth’s surface, producing additional warming. The result is a powerful feedback cycle: warming increases evaporation and atmospheric moisture; increased water vapor traps more heat; and that additional heat promotes further evaporation and moisture accumulation.

Water Vapor as a Warming Multiplier

Of the global warming experienced since 1990, water vapor is responsible for roughly half of it.

Water vapor did not start the fire, but it has helped make the fire burn hotter. Over the last 36 years, atmospheric water vapor has increased by roughly 5%, increasing the amount of outgoing thermal radiation retained by the climate system. In this sense, water vapor has effectively doubled the intensity of the warming driven by human fossil-fuel emissions.

To offset the warming effect caused by water-vapor amplification since 1990, human-driven greenhouse-gas emissions would have to drop by approximately 50% relative to our post-1990 accumulation rate.

The important distinction is that water vapor is primarily a feedback, rather than the initial forcing. Humans increase the concentration of long-lived greenhouse gases; the resulting warming changes the hydrological cycle; and water vapor then amplifies that initial warming.

That is what makes water vapor so important to understanding climate energy.

How Water Vapor Drives Extreme Weather

The impacts of increased atmospheric water vapor extend far beyond global temperature. They are expressed through some of the most disruptive forms of extreme weather.

The “Loaded Dice” Effect for Heavy Rainfall

Because the atmosphere holds roughly 5% more moisture today than it did in 1990, storms have a larger reservoir of water available to them. This changes the character of rainfall. The same storm systems can produce more intense and concentrated downpours, dramatically increasing the risk of flash flooding.

More atmospheric moisture means that when the atmosphere finally releases that stored water, the release can be extreme.

Supercharged Tropical Cyclones

Water vapor does not simply provide the raw material for rain; it also acts as fuel for tropical cyclones.

When water vapor condenses into liquid rain within a hurricane, it releases a massive amount of latent heat. This heat warms the surrounding air, causing it to rise faster and lowering surface pressure. The resulting pressure changes can intensify the storm’s circulation and increase wind speeds.

In other words, the same water cycle that supplies rainfall can also supply additional energy to powerful storms.

Atmospheric Rivers

Atmospheric rivers are narrow, thousands-of-miles-long plumes of intense moisture transport through the atmosphere—often described as “rivers in the sky.”

As global atmospheric moisture increases, these systems can transport enormous quantities of water. When they make landfall, particularly against mountainous terrain, they can produce extreme precipitation and catastrophic flooding.

California and the U.S. West Coast have experienced some of the most visible consequences of these powerful moisture-transport systems.

The Warm-Air / Dry-Soil Paradox

Perhaps one of the most important consequences of increased atmospheric moisture is the apparent paradox that a warmer, wetter atmosphere can contribute to both heavier rainfall and more severe drying.

When it is raining, additional atmospheric moisture can provide storms with more water to release. When it is not raining, warmer air increases evaporative demand. The atmosphere effectively acts like a stronger sponge, drawing moisture from soils and vegetation through evaporation and transpiration. The result can be accelerated drying between precipitation events.

This creates a volatile cycle:

More moisture → heavier rainfall → runoff and flooding → drying → increased evaporation → drought stress → wildfire risk.

The atmosphere can therefore move rapidly between extremes of water abundance and water scarcity.

The Regional Picture

The impact of increasing atmospheric moisture is not distributed evenly across the planet. While global average atmospheric moisture has risen by roughly 5% since 1990, individual regions can experience much larger changes.

Mid-latitude and coastal regions can experience particularly sharp increases in extreme one-day or hourly precipitation totals as warmer air and moisture-rich storm systems interact.

Arid inland regions can experience intensified evaporation without a corresponding increase in rainfall, worsening water scarcity and increasing drought stress.

This regional contrast is critical. Climate change is not simply making the planet “wetter” or “drier.” It is increasing the energy available to the hydrological cycle and, in many places, increasing the volatility between wet and dry extremes.

The Steam Engine Multiplier

Water vapor is therefore more than another greenhouse gas in the atmosphere. It is a dynamic component of Earth’s climate system that responds rapidly to temperature changes and feeds energy back into the system.

Carbon dioxide and methane provide much of the initial forcing from human activity.

Water vapor responds to that warming.

Then water vapor amplifies the warming.

That amplified warming alters evaporation, precipitation, soil moisture, storms, and atmospheric circulation.

Those changes can produce additional extremes, creating another layer of feedback throughout the Earth system.

The climate signal is consequently not simply a thermometer reading.

It is an energy cycle.

Warming → evaporation → water vapor → heat retention → additional warming → intensified hydrological extremes.

Water vapor is the steam engine multiplier: not the spark that started the process, but one of the mechanisms that can make the entire system run increasingly harder as the planet warms.

bookmark_borderHow Is Climate Energy Hitting You? Indonesia’s Orangutans

by Daniel Brouse

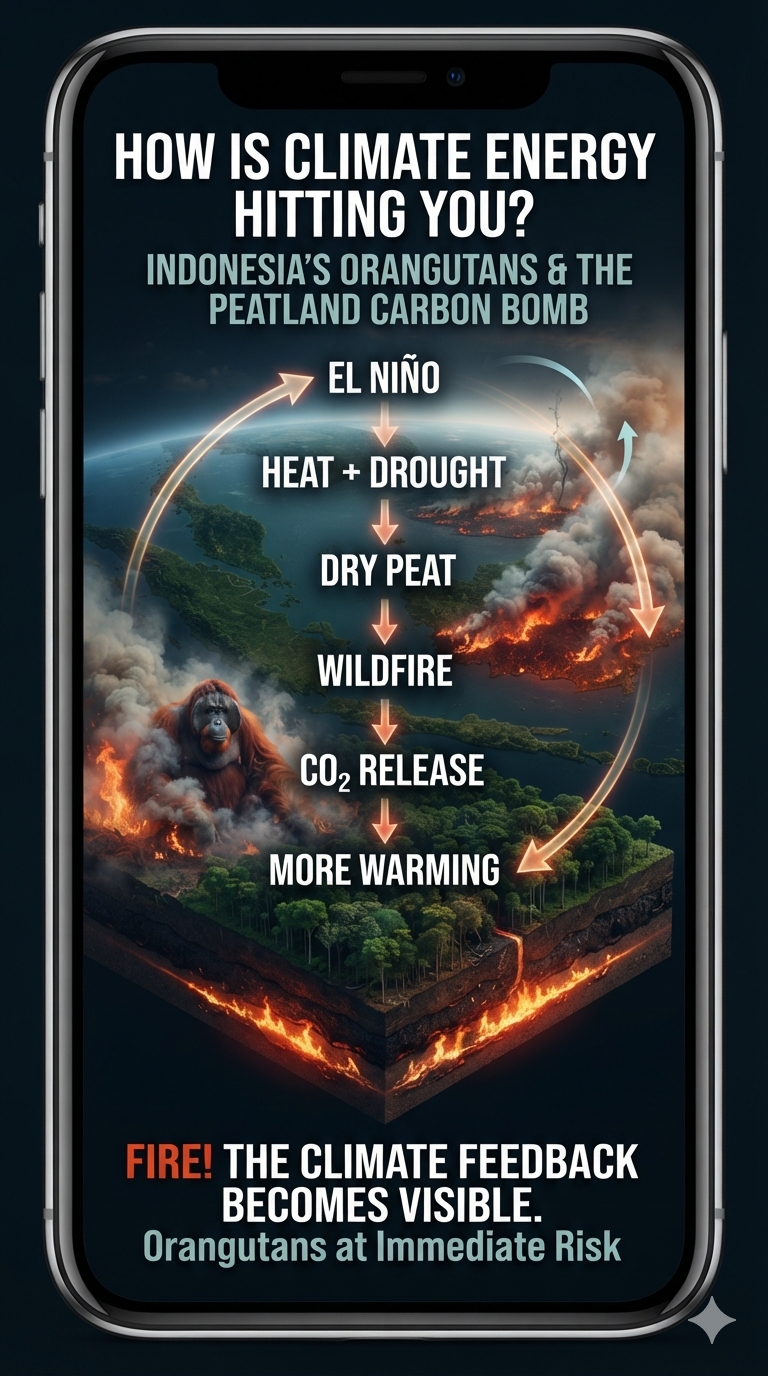
Indonesia’s Orangutans and the Peatland Carbon Bomb

Indonesia is experiencing a dangerous convergence of climate stress, extreme drought, human land-use change, and wildfire across Sumatra and Borneo. As of September 2026, satellite observations indicate that more than 200,000 hectares have burned, releasing enormous quantities of greenhouse gases while blanketing large portions of Southeast Asia in toxic smoke and haze.

For Indonesia’s orangutans, this is more than a wildfire crisis. It is an accelerating ecosystem crisis in which climate change, drought, deforestation, and peatland destruction reinforce one another.

The Climate Change Feedback Loop

Climate change does not have to ignite a wildfire to make a fire catastrophe more likely. Instead, warming can intensify the environmental conditions that allow fires to spread, burn longer, and become increasingly difficult to control.

Indonesia’s recurring dry seasons are strongly influenced by natural climate variability, particularly El Niño. But a warmer climate can load the system with additional heat and alter the background conditions under which these natural cycles operate. During an exceptionally strong El Niño, prolonged drought and extreme heat can turn already vulnerable landscapes into tinderboxes.

That becomes particularly dangerous in Indonesia’s peatlands.

The Peatland Carbon Bomb

Indonesia contains vast tropical peatlands—wetlands formed from layers of partially decomposed organic material accumulated over thousands of years. When these ecosystems remain saturated, the waterlogged peat is relatively resistant to burning.

But decades of drainage and conversion for agriculture, palm-oil production, pulpwood plantations, roads, and other development have transformed many peatlands into something fundamentally different: enormous stores of carbon sitting above the water table.

Once dried, peat can ignite and continue smoldering underground. A surface fire may disappear while combustion continues below ground, allowing fires to persist for weeks or months and re-emerge far from the original ignition point.

The result is a powerful positive feedback:

Drought → dry peat → wildfire → carbon emissions → more atmospheric warming → greater climate stress

Peat fires are also major sources of fine particulate pollution, creating severe health impacts across Indonesia and neighboring countries. Unlike an ordinary forest fire, a peat fire can continue consuming carbon-rich soil beneath the surface, releasing greenhouse gases long after the visible flames have disappeared.

From Forest Fire to Climate Feedback

The significance extends far beyond the individual fire.

When forests and peatlands burn, carbon that had been stored in vegetation and soil for centuries or millennia is rapidly transferred into the atmosphere. The resulting greenhouse-gas emissions contribute to additional warming, while the loss of forest reduces the ecosystem’s capacity to store carbon in the future.

This creates another reinforcing loop:

Forest and peatland destruction → carbon release → atmospheric warming → greater drought and heat stress → increased fire vulnerability

The system can therefore begin amplifying itself.

The Orangutan Connection

Orangutans are among the most visible casualties of this feedback system. Their remaining habitat is concentrated primarily in the forests and peatlands of Borneo and Sumatra. When these landscapes are cleared, drained, fragmented, or burned, orangutans lose not simply individual trees but entire interconnected ecosystems on which their survival depends.

Fire can kill animals directly, separate populations, destroy food sources, and further fragment already shrinking habitat. Smoke and prolonged drought add additional stress.

The orangutan therefore provides a remarkably tangible way to understand climate energy.

The heat accumulating in the Earth system does not remain an abstract number on a graph. It manifests through drought, altered rainfall, drying wetlands, wildfire, habitat destruction, ecosystem collapse, and ultimately the loss of living organisms.

A Global Feedback

The danger does not end at Indonesia’s borders.

Between September 1 and September 7, 2026, reported wildfire emissions were estimated to have increased dramatically, with approximately 19.7 million tons of carbon dioxide released during that period. If confirmed, such emissions demonstrate how rapidly a regional ecological disturbance can become part of the global climate system.

Indonesia’s peatlands are effectively biological carbon reservoirs. When they remain wet and intact, they help keep carbon out of the atmosphere. When they are drained and burned, they can become carbon sources instead.

That is the paradox of the peatland carbon bomb:

The ecosystem that once stored carbon becomes an engine for releasing it.

Climate Energy Is Coming Back Around

This is what makes Indonesia’s wildfire crisis so important in understanding climate change.

Climate energy moves through the Earth system. The atmosphere warms. Oceans redistribute enormous quantities of heat. Atmospheric circulation changes. Drought and precipitation patterns shift. Vegetation becomes stressed. Wetlands dry. Fire releases stored carbon. Carbon dioxide and other greenhouse gases increase atmospheric energy retention.

The process is not a simple straight line from warming to fire.

It is a feedback system.

Warming → drought → fire → carbon release → more warming → greater vulnerability

And in Indonesia, that feedback is colliding with one of the planet’s most biologically important ecosystems.

The orangutan is not separate from the climate system.

Neither is the peat beneath its feet.

The fire is where the climate feedback becomes visible.

bookmark_borderTipping Point Season: Mountain Glaciers at the Edge

by Daniel Brouse

🏔️ SIMPLIFIED INTRODUCTION: MOUNTAIN GLACIERS AT THE EDGE

Mountain glaciers are disappearing faster.

But the bigger danger may be what happens to the mountains when the ice disappears.

Record global heat and the powerful 2023–2024 El Niño helped drive extraordinary glacier mass loss worldwide. Now, with another potentially powerful El Niño developing against an already overheated climate, the consequences extend far beyond shrinking glaciers.

Extreme heat melts glacier ice.

Permafrost thaws.

Mountain slopes weaken.

Rain replaces snow.

Atmospheric rivers deliver enormous amounts of water.

Landslides block rivers.

Temporary lakes form.

And those lakes can suddenly burst downstream.

The danger is no longer simply ICE LOSS.

It is SYSTEM INSTABILITY.

This is what happens when multiple climate-sensitive systems begin moving together—and feedbacks start turning one disturbance into another.

Tipping Point Season: Mountain Glaciers at the Edge

The mountain isn’t just losing ice.

The mountain is changing.


The Full Report

The combination of the powerful 2023–2024 El Niño and record-breaking global heat severely accelerated the loss of mountain glaciers worldwide, producing some of the largest glacier mass-balance deficits ever recorded. What makes this period particularly important is not simply the amount of ice being lost, but the way extreme heat, altered precipitation, permafrost thaw, and increasingly volatile hydrology are beginning to interact across high-mountain environments.

2023–2024: A Global Glacier Mass-Loss Shock

Data compiled by the World Glacier Monitoring Service (WGMS) and the United Nations illustrate the extraordinary scale of recent glacier deterioration. The compounding effects of human-induced climate change and the 2023–2024 El Niño contributed to exceptionally severe melting conditions.

Record-breaking global mass loss

During the 2023 hydrological year, glaciers experienced a record-breaking global mass loss equivalent to approximately 1.1 meters of ice thickness. The total loss was roughly 600 gigatons of water, making 2023 the largest annual glacier mass loss recorded since systematic measurements began in 1976.

The deterioration continued in 2024. The 2024 hydrological year ranked as the fourth-worst year on record, with glaciers losing another approximately 450 billion tonnes of ice. It also marked the third consecutive year in which all 19 glacier regions monitored globally experienced a net mass loss.

The significance of these numbers extends beyond the glaciers themselves. Mountain glaciers function as frozen reservoirs, storing water that is gradually released into downstream river systems. Their rapid depletion therefore represents both a cryospheric transformation and a growing threat to water security, ecosystems, agriculture, hydropower, and communities downstream.

Tropical Glaciers: Exceptionally Vulnerable

Tropical glaciers, particularly those in the Andes and Indonesia, are exceptionally sensitive to changes in precipitation and temperature. The 2023–2024 El Niño amplified those vulnerabilities.

In the Peruvian Andes, research on the Quelccaya Ice Cap has shown how El Niño can suppress wet-season snowfall, replacing it with warmer and drier conditions. Fresh snow normally provides a highly reflective surface that returns much of the incoming solar energy back to space. When snowfall fails and bare glacier ice is exposed, the darker surface absorbs substantially more solar energy.

This creates a powerful feedback: less snowfall means less reflective snow cover; less reflective snow means greater absorption of solar energy; greater energy absorption accelerates melting and exposes still more bare ice.

Indonesia’s Puncak Jaya glaciers face an even more precarious future. These rare tropical glaciers were already critically endangered, and drought and temperature anomalies associated with El Niño accelerated the timeline toward potential disappearance.

European Alps and North American Ranges

El Niño does not directly control the climate of every mountain region. Its effects are superimposed on a much larger background trend of human-driven global warming.

In the European Alps, persistent and intense summer heatwaves produced severe glacier degradation. Melting occurred even at elevations above approximately 3,100 meters—heights that historically provided substantially greater protection from summer heat.

The North Cascades of the United States experienced a similar pattern. In areas such as North Cascades National Park, monitored glaciers continued to lose mass through both 2023 and 2024, consistent with a broader regional trend in which glacier melt rates have increased dramatically over recent decades.

The important signal is therefore not simply that glaciers are retreating. It is that the elevation, duration, and intensity of melting are changing. Ice that once remained protected through the summer is increasingly being exposed to temperatures capable of transforming both the surface and the internal structure of mountain glaciers.

The 2023–2024 Glacier Signal

Metric / RegionImpact from 2023–2024 Heat and El Niño
Global Mass Loss2023 was the worst year on record, with approximately 600 Gt of ice lost. 2024 ranked fourth-worst. All 19 monitored glacier regions experienced net loss.
Tropical GlaciersReduced seasonal snowfall combined with extreme heat exposed darker bare ice, accelerating thinning and shortening extinction timelines.
Mid-Latitude GlaciersExtreme high-elevation temperatures pushed the melt zone upward, exposing previously protected ice to rapid melting, fracturing, and structural deterioration.
Sea-Level ContributionGlacier mass loss adds freshwater directly to the oceans, compounding sea-level rise driven by thermal expansion and other sources.

But the story does not end with glacier retreat.

The more consequential question is what happens when a warming atmosphere begins to destabilize the mountains surrounding and supporting those glaciers.

2026–2027: From Glacier Loss to Mountain Instability

The emerging 2026–2027 El Niño is occurring against an already unprecedented background of global warming. If the event develops with the exceptional strength currently being discussed, its influence will not be confined to ocean temperatures or atmospheric circulation.

High-mountain environments are particularly vulnerable because they sit at the intersection of several climate-sensitive systems: glaciers, snowpack, permafrost, steep rock faces, atmospheric circulation, and rapidly responding river networks.

The result can be a chain reaction in which one disturbance increases the probability or severity of another.

1. The Nepal–Tibet Glacial Collapse

The catastrophic disaster reported along the Nepal–Tibet border on August 26, 2026, provides a stark example of how extreme heat can intersect with high-altitude geological instability.

A massive section of glacier collapsed at approximately 5,200 meters, triggering an enormous avalanche of ice, rock, and mud that moved into the Trishuli and Bhotekoshi River valleys. The resulting destruction affected communities and critical infrastructure, including hydropower facilities and border transportation routes.

The thermal environment preceding the collapse is particularly significant. Meteorological analysis reportedly found prolonged and exceptional warmth at the elevation of the glacier, with temperatures averaging approximately 5°C (41°F) over a six-day period. Such temperatures are extraordinary at 5,200 meters and illustrate how extreme atmospheric warmth can penetrate environments historically protected by elevation.

The lesson is larger than a single glacier failure.

When temperatures rise far enough, high altitude is no longer the same form of protection it once was.

2. Feedback Mechanism: Permafrost Thaw and Slope Failure

Glacier retreat is only one component of high-mountain destabilization. Permafrost provides another critical structural control.

Permafrost consists of permanently frozen soil, rock, and ice. In steep mountain terrain, frozen water can act as a form of geological glue, binding fractured rock and stabilizing slopes.

Extreme warming attacks that structural support.

As temperatures rise, permafrost can thaw progressively deeper into mountain slopes. Ice within fractures melts, reducing the cohesion between rock surfaces. Water can then penetrate deeper into the fractured rock, while repeated freeze-thaw cycles and changing hydraulic pressures further weaken the structure.

The result can be slope failure.

A destabilized glacier, hanging ice mass, or fractured rock face may collapse as a single event, but the material released does not necessarily remain an avalanche of ice. It can entrain enormous quantities of rock, soil, sediment, and meltwater.

What begins as a glacier or rock failure can therefore become a high-speed debris flow or mudslide carrying millions of tonnes of material downstream.

This is a critical transition: climate change is not simply removing ice from mountains; it can alter the mechanical stability of the mountains themselves.

3. Feedback Mechanism: Supersized Atmospheric Rivers

The other half of the problem is water.

El Niño reorganizes global atmospheric circulation and changes the distribution of heat and moisture across the planet. Warmer ocean surfaces provide greater evaporation potential, increasing the amount of water vapor available to the atmosphere.

That additional atmospheric moisture can feed powerful atmospheric rivers—long, narrow corridors transporting enormous quantities of water vapor.

When these systems encounter mountain ranges, the consequences can become extreme.

Instead of falling as snow, warm atmospheric rivers can produce rain at elevations that historically received substantial snowfall. This creates a particularly dangerous combination: rain-on-snow events occurring simultaneously with already accelerated glacier and snowpack melt.

4. The Hydro-Thermal Double Whammy

Rain falling on snow and ice does more than add water.

Rain transfers sensible and latent heat directly into the snowpack and glacier surface. At the same time, the enormous volume of rainfall can rapidly increase runoff.

The result is a hydro-thermal double whammy:

Heat accelerates melting while water accelerates runoff.

Mountain drainage systems can become overwhelmed as rainfall, snowmelt, and glacier melt converge. Steep terrain magnifies the response, sending water and sediment rapidly into narrow valleys.

If landslides or debris flows block those valleys, temporary lakes can form behind natural dams of rock, ice, and sediment. Such impounded water can subsequently breach the blockage, generating devastating downstream floods, including glacial lake outburst floods (GLOFs).

The hazard therefore moves through the system:

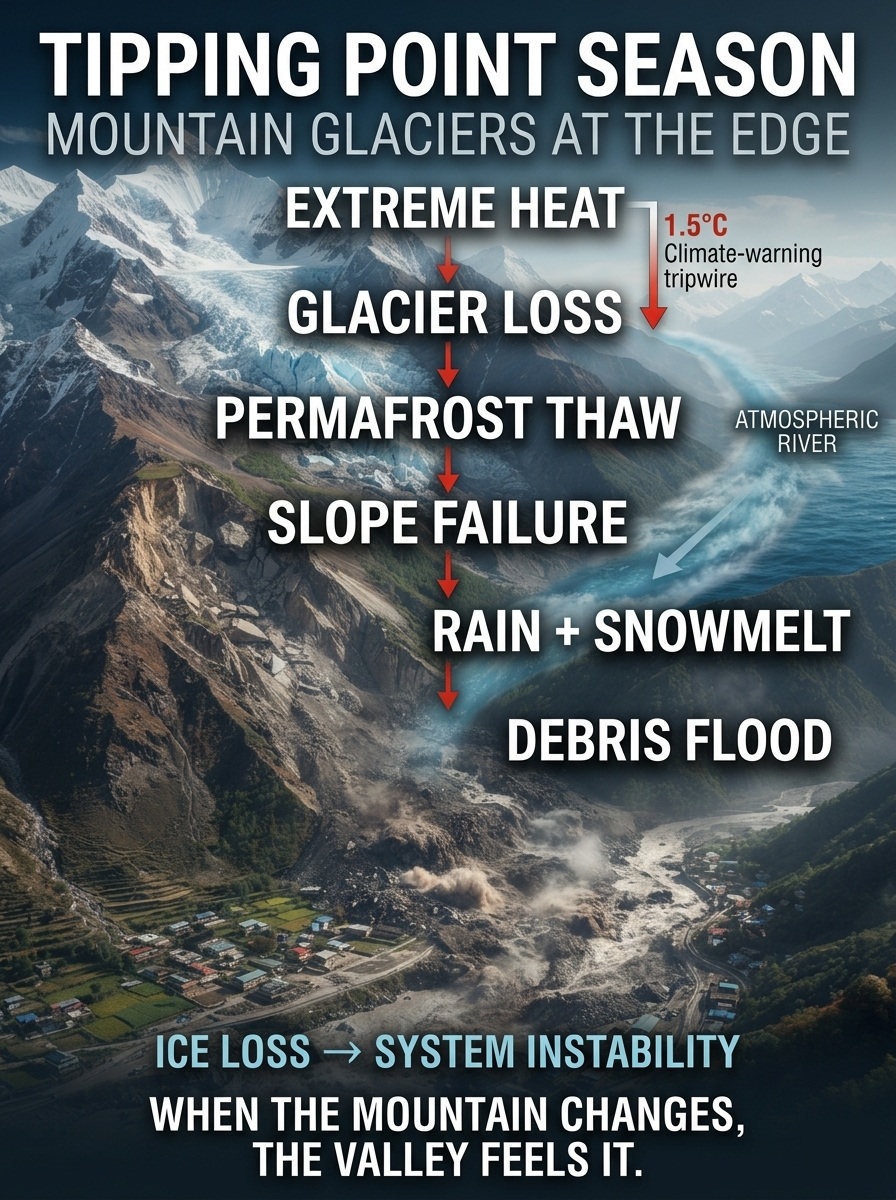
Heat → glacier melt → permafrost thaw → slope failure → debris flow → river blockage → temporary lake → sudden flood.

One climate disturbance can become a cascade of physical disturbances.

The Compounding Cycle of Mountain Hazards

Climate DriverDirect Physical ChangeResulting Environmental Hazard
Record Ambient HeatExtreme high-elevation temperatures accelerate surface melting and weaken glacier structures.Rapid ice loss, glacier destabilization, and structural collapse.
Permafrost ThawIce binding rock and soil begins to melt, weakening the mountain’s internal structure.Whole-slope failures, massive rockfalls, and debris-laden mudslides.
El Niño–Driven MoistureWarmer oceans increase evaporation and atmospheric moisture availability.More powerful atmospheric rivers and extreme precipitation events.
Rain-on-Snow EventsWarm rainfall adds heat and water directly to mountain snow and ice.Accelerated melt, rapid runoff, flooding, and landslides.
Cascading HydrologyLandslide and debris-flow material blocks narrow river channels.Temporary lakes and potentially catastrophic glacial lake outburst floods.

Tipping Point Season

The most important signal may therefore not be the disappearance of an individual glacier.

It may be the increasing synchronization of multiple mountain processes.

Glacier loss changes surface reflectivity and water storage. Permafrost thaw weakens mountain slopes. Extreme heat raises the elevation of the melt zone. Atmospheric rivers deliver greater quantities of warm precipitation. Rain-on-snow events accelerate runoff. Landslides alter river channels. Temporary lakes form behind unstable debris dams. Those lakes can subsequently fail.

Each process can amplify another.

This is what makes mountain glacier loss a potential tipping-point problem. The danger is not necessarily one dramatic threshold at which a glacier suddenly disappears. The danger is a system in which multiple thresholds are approached simultaneously, feedbacks proliferate, interactions strengthen, and individual disturbances begin producing consequences far beyond their original location.

The mountain system becomes increasingly nonlinear.

A glacier that once functioned primarily as a frozen reservoir can become a source of floodwater. Permafrost that once stabilized a mountain slope can become a liability when it thaws. Snow that once stored water safely through the winter can become a mechanism for rapid runoff when warm rain falls on it. A landslide that once would have been a localized geological event can block an entire river and create a secondary flood disaster.

The result is a shift from ice loss to system instability.

That may be the larger lesson of Tipping Point Season: climate change is not simply making glaciers smaller. It is changing the physical relationships among ice, rock, water, atmosphere, and gravity.

And when those relationships begin changing together, the mountain can stop behaving like the mountain we knew.

bookmark_borderTipping Point Season: Comingling Tipping Points and Proliferating Feedbacks

How Coupled Climate Feedbacks Are Accelerating Earth-System Change

By Daniel Brouse

Simplified Introduction to:

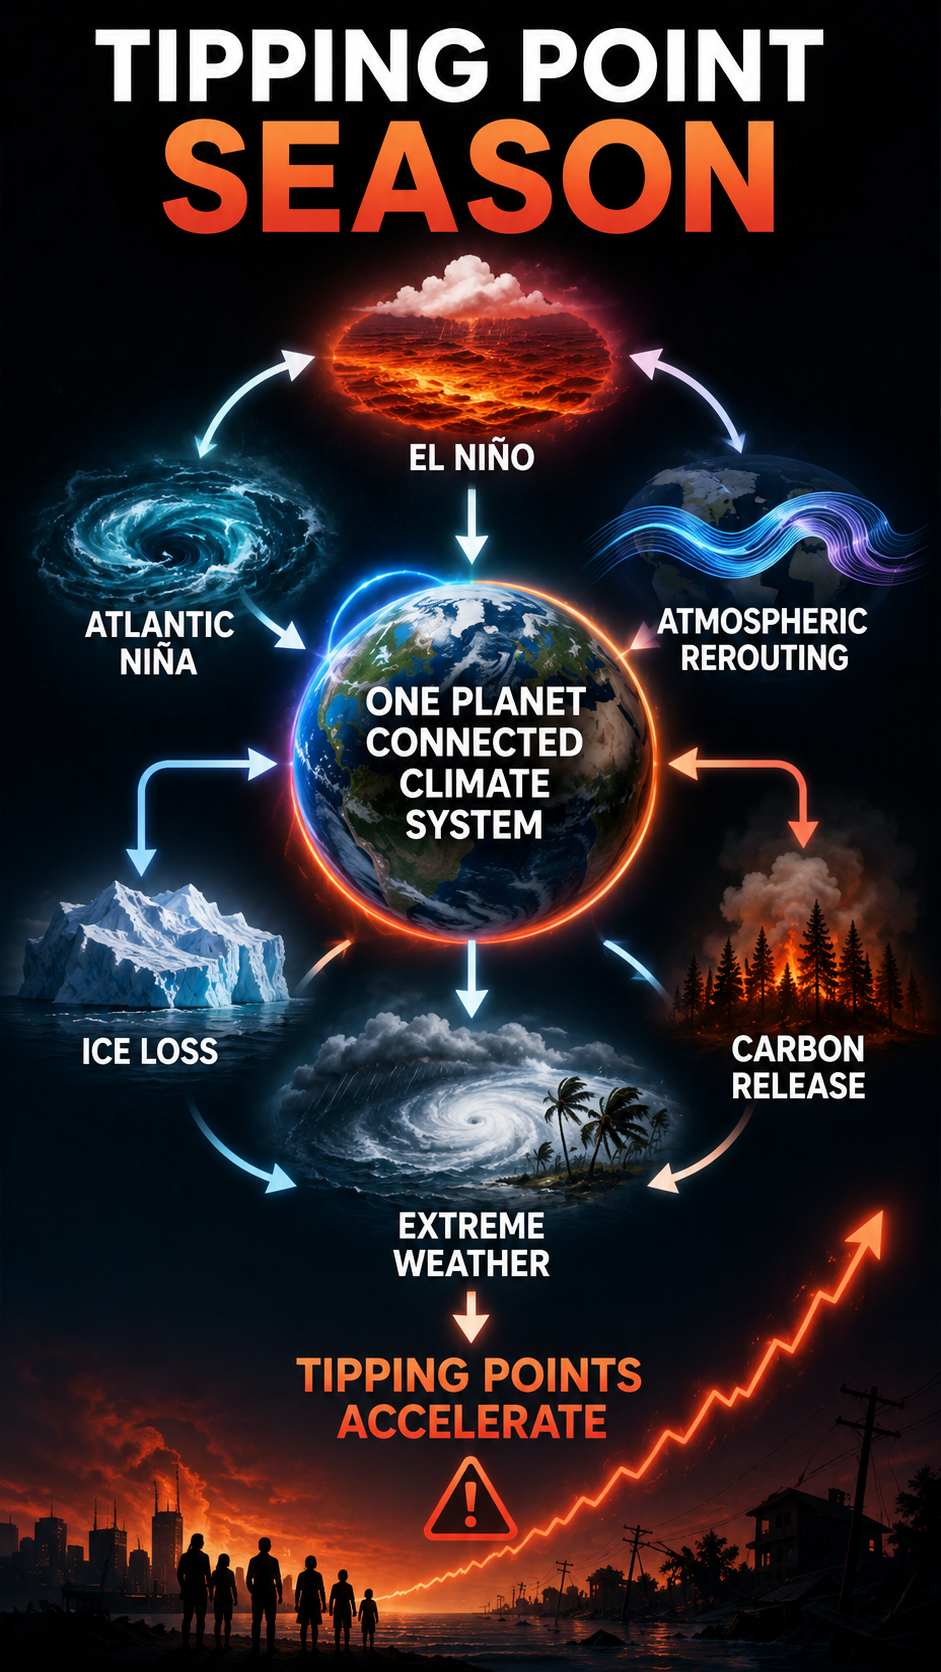
🌎 TIPPING POINT SEASON

Tipping points are not necessarily isolated events waiting to happen one at a time.

Several have already begun moving together.

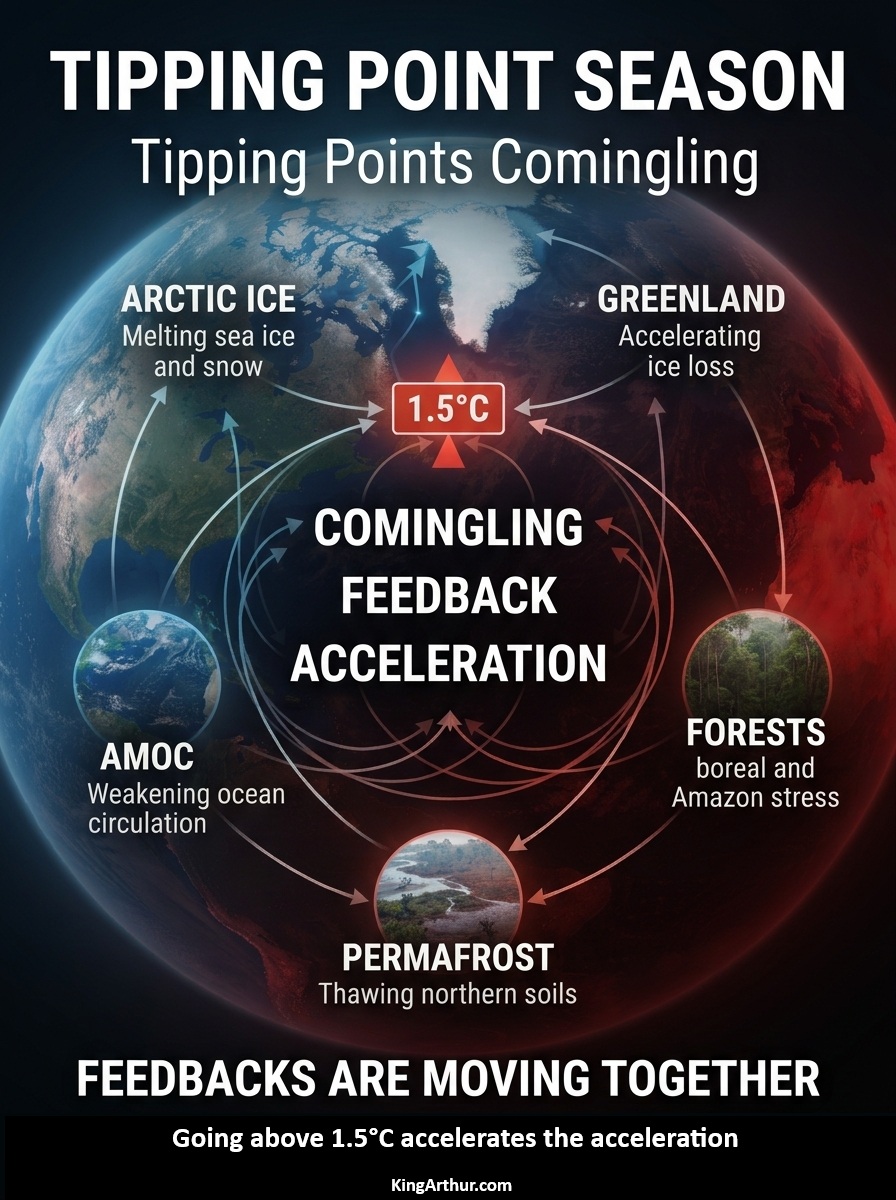
Ice loss changes albedo. Arctic warming alters atmospheric circulation. Greenland melt adds freshwater to the North Atlantic. Permafrost thaws and releases greenhouse gases. Forests are stressed by heat, drought, and fire. Ocean and atmospheric systems respond.

The important question is no longer simply: When will a tipping point occur?

It is: What happens when multiple tipping elements begin interacting with one another?

Tipping points come together. Feedbacks proliferate. Interactions strengthen. And acceleration emerges.

The climate system begins to change faster and in more complex ways than its individual pieces can be understood in isolation.

That is the idea behind the paper:

Tipping Point Season: Comingling Tipping Points and Proliferating Feedbacks

How Coupled Climate Feedbacks Are Accelerating Earth-System Change

The greatest danger may not be one tipping point suddenly toppling.

It may be several moving together.

🌡️ 1.5°C is not a magical switch.

It is a tripwire into a climate system where more interconnected components are being pushed toward critical states.

Tipping Point Season has begun.


Comingling Tipping Points

The climate system has entered a new phase. The significance of the first sustained period in which global temperatures repeatedly exceeded 1.5°C above the pre-industrial baseline during 2023–2024 is not simply the number itself, but what is happening around that number. Across the planet, multiple components of the Earth system are simultaneously experiencing unprecedented or rapidly intensifying stress. Polar ice is disappearing, Arctic amplification is accelerating, permafrost is thawing, ocean heat content continues to rise, extreme marine heatwaves are becoming more consequential, and tropical forests are being stressed by increasing heat and drought. These are not isolated phenomena. They are interacting.

The central climate question is therefore changing. It is no longer sufficient to ask when an individual tipping point will be crossed. We must ask whether multiple tipping elements are already beginning to influence one another strongly enough to create a self-reinforcing cascade. The evidence increasingly indicates that they are. This is the comingling tipping points: a condition in which multiple vulnerable Earth-system components are changing simultaneously, altering the boundary conditions experienced by other components and strengthening feedbacks between them. The result is feedback proliferation. One change creates another, that change alters another part of the system, and the resulting response feeds back into the original disturbance. The climate system begins to behave less like a collection of separate components and more like a tightly coupled network. As coupling increases, the rate of change can increase with it.

1.5°C Is Not a Switch. It Is a Tripwire.

The 1.5°C threshold should not be imagined as a magical switch that suddenly activates every climate feedback. Climate feedbacks have always existed. What changes as warming increases is their strength, frequency, geographic extent, persistence, and interaction with other feedbacks. At approximately 1.5°C of global warming, numerous tipping elements become increasingly vulnerable, including Greenland ice-sheet instability, West Antarctic ice-sheet instability, Arctic sea-ice loss, permafrost thaw, boreal forest degradation, Amazon rainforest degradation, AMOC weakening, coral-reef collapse, and mountain-glacier loss.

These systems are connected through the atmosphere, oceans, cryosphere, biosphere, and hydrological cycle, and that connectivity matters. A warmer Arctic changes atmospheric temperature gradients; changing gradients alter circulation; circulation changes precipitation, drought, storm tracks, and heat transport; those changes affect forests, soils, glaciers, snowpack, and oceans. Ice loss changes albedo and freshwater delivery, while freshwater changes ocean density and circulation. Forest degradation changes carbon uptake and atmospheric moisture recycling, while permafrost thaw releases additional greenhouse gases. Each response changes the conditions under which the others operate. This is not theoretical coupling. It is the physical architecture of the climate system.

The El Niño Accelerator

ENSO provides another mechanism by which an already-warmed climate system can experience rapid additional warming. During El Niño, heat stored in the tropical Pacific is redistributed toward the atmosphere and higher latitudes, producing a temporary but potentially enormous pulse of global surface warming. A major 2026–2027 El Niño would therefore not be occurring in the climate system of the twentieth century; it would be occurring on top of a much warmer baseline.

That distinction is crucial because the same El Niño forcing applied to a cooler climate and a highly warmed climate does not necessarily produce the same system response. Background conditions have changed, and a strong El Niño can push global temperatures substantially above the 1.5°C level and potentially toward or beyond 1.6°C for extended periods. The danger is not that El Niño creates anthropogenic warming. Rather, an exceptionally warm baseline combined with a powerful natural climate oscillation can push already-stressed tipping elements closer to critical states simultaneously. A climate pulse can therefore become a trigger.

From Individual Tipping Points to Comingling Tipping Points

Consider the sequence already emerging across the polar climate system: polar amplification → weakened equator-to-pole temperature gradient → altered atmospheric circulation → accelerated Arctic and Greenland ice loss. That initial sequence immediately activates multiple feedbacks.

The ice–albedo feedback begins when ice loss exposes darker ocean and land surfaces. Those surfaces absorb more solar energy, producing additional regional warming and further ice loss: ice loss → darker ocean and land surfaces → greater solar absorption → additional warming → additional ice loss ↺. The Arctic consequently changes from a highly reflective surface toward a darker, increasingly heat-absorbing system.

At the same time, a melt–elevation feedback can develop as an ice sheet loses mass and elevation. Lower ice-sheet surfaces are exposed to warmer atmospheric conditions, increasing surface melting and producing further elevation loss: ice loss → lower ice-sheet elevation → exposure to warmer air → increased surface melting → additional elevation loss ↺. Arctic warming also alters the vertical temperature structure of the lower atmosphere, contributing to a lapse-rate feedback in which changes in the vertical temperature gradient can reduce atmospheric cooling efficiency near the surface and promote additional warming: Arctic warming → altered lapse rate → reduced atmospheric cooling efficiency near the surface → additional near-surface warming → additional ice and snow loss ↺.

These are not three independent feedbacks operating in isolation. They interact. The resulting cryospheric response can then connect to the ocean through accelerated Greenland melt and increased freshwater input into the North Atlantic. Freshwater can reduce salinity and density, contributing to AMOC weakening. Ocean circulation then connects back to the atmosphere through altered North Atlantic heat transport, pressure fields, and storm tracks. Atmospheric circulation can consequently reorganize, increasing jet-stream waviness and creating conditions favorable to persistent blocking.

The resulting sequence can extend into slower-moving Rossby waves, persistent blocking and omega blocks, prolonged heat domes, drought, stalled atmospheric rivers, and extreme precipitation. The consequence is hydroclimatic whiplash, in which the same atmospheric circulation regime can produce drought in one region and catastrophic flooding in another, sometimes in rapid succession. The components are no longer simply responding independently to global warming; they are modifying one another’s operating environment.

Feedback Proliferation

Once multiple tipping elements become coupled, the number of potential feedback pathways increases dramatically. A single change can propagate through several systems simultaneously. Consider the sequence: polar amplification → atmospheric circulation change → ice loss → albedo reduction → additional warming → Greenland melt → freshwater input → ocean circulation disruption → atmospheric circulation change → precipitation redistribution → drought and flood extremes → ecosystem stress → carbon-cycle disruption → additional greenhouse forcing → additional warming.

Now introduce permafrost. Warming → permafrost thaw → microbial decomposition → CO₂ + CH₄ release → additional greenhouse forcing → additional warming ↺. Add boreal forests: warming + drought + wildfire → forest degradation → reduced carbon uptake + carbon release → additional warming ↺. Add the Amazon: warming + drought + fire → reduced evapotranspiration → disrupted rainfall recycling → greater drought stress → forest degradation → carbon release → additional warming ↺. Add Antarctica: ocean warming → ice-shelf weakening → accelerated West Antarctic ice loss → sea-level rise → coastal and cryospheric stress.

The system is now operating as a network of interacting positive feedbacks. This is why the phrase feedback proliferation is more useful than simply listing individual feedbacks. The critical issue is not the existence of one feedback, but the rapidly expanding number of ways in which feedbacks can connect.

The Feedbacks Are Accelerating

Acceleration is particularly important because a climate system experiencing a given external forcing does not necessarily produce a constant rate of response. If feedbacks strengthen as warming increases, the response itself can accelerate. This creates a fundamental distinction between a linear response—forcing → proportional response—and a coupled nonlinear response in which forcing → response → feedback → stronger response → stronger feedback → acceleration.

This acceleration is increasingly visible in observations. Ocean heat has accumulated to extraordinary levels, marine heatwaves are becoming more intense and persistent, Arctic warming is occurring at multiple times the global average rate, Greenland is losing ice mass, Antarctica is losing ice mass, permafrost is thawing, extreme precipitation is intensifying as a warmer atmosphere carries more moisture, heat extremes are becoming more severe, and drought and wildfire are degrading major carbon-storing ecosystems.

These are not simply independent records of a warming planet. They are evidence of a planet whose internal responses are becoming increasingly consequential. The critical observation is not merely that each indicator is changing, but that multiple indicators are changing simultaneously across interconnected subsystems, with some changes occurring at accelerating rates. That is a signature of a system becoming increasingly nonlinear.

Water Vapor: The Fastest Amplifier

The water-vapor feedback demonstrates how rapidly a positive feedback can operate. Water vapor is the most abundant greenhouse gas in Earth’s atmosphere and provides one of the strongest and fastest positive feedbacks in the climate system. The Clausius–Clapeyron relationship indicates that the atmosphere can hold approximately 7% more water vapor for every 1°C of warming, assuming relative humidity remains broadly similar.

The sequence is straightforward: warming → increased atmospheric moisture → stronger greenhouse trapping → additional warming ↺. Water vapor does not provide the original forcing; it amplifies it. This feedback operates rapidly, on timescales ranging from days to weeks, and affects the entire atmospheric system. A warmer atmosphere also means that when moisture is transported into storm systems, more water can potentially be released as extreme precipitation. The same thermodynamic process that increases atmospheric heat retention can therefore contribute to more intense precipitation extremes, allowing one feedback to influence multiple hazards.

Ice–Albedo: The Arctic Heat Engine

The cryosphere provides another rapidly reinforcing feedback. Snow and ice reflect incoming solar radiation, while dark ocean and land surfaces absorb it. As Arctic ice disappears, the sequence becomes ice loss → reduced albedo → increased solar absorption → regional warming → additional ice loss ↺.

The Arctic is therefore not simply responding to global warming; it is increasingly participating in the amplification of regional warming. This is particularly important because Arctic amplification alters the temperature contrast between the poles and lower latitudes. That contrast is one of the fundamental drivers of atmospheric circulation, meaning that changes in the polar temperature structure can propagate outward into the mid-latitude atmosphere. The feedback does not stop at the Arctic. It travels.

Permafrost: The Carbon Feedback

Permafrost represents a slower but potentially persistent feedback. Frozen northern soils contain enormous quantities of organic carbon accumulated over thousands of years. When those soils thaw, microorganisms gain access to previously frozen organic matter. Depending on environmental conditions, decomposition releases carbon dioxide and methane.

The sequence is therefore warming → thaw → decomposition → greenhouse-gas release → additional warming ↺. Unlike water vapor, this feedback can continue long after the initial warming event, making it a potential bridge between short-term climate acceleration and long-term carbon-cycle destabilization.

Boreal Forests: From Carbon Sink to Carbon Stress

Boreal forests are increasingly exposed to compound stress from heat, drought, insects, disease, and wildfire, with these stresses capable of interacting rather than simply occurring independently. A forest weakened by drought becomes more vulnerable to fire, fire releases stored carbon, and the loss of forest cover reduces future carbon uptake. The resulting feedback is warming → drought + fire → forest degradation → reduced carbon uptake + carbon release → additional atmospheric warming ↺.

The significance lies in the possibility of a transition from a carbon-absorbing ecosystem toward one that increasingly contributes carbon to the atmosphere. That transition would not be instantaneous, nor would it occur uniformly across the boreal zone, but the direction of the feedback is clear: increasing climate stress can progressively weaken an important carbon sink.

Amazon: The Rainfall-Recycling Feedback

The Amazon provides an even more tightly coupled example because the forest does not merely receive rainfall; it helps generate and recycle it. Through evapotranspiration, vegetation transfers enormous quantities of water back into the atmosphere. Repeated drought and heat stress can weaken this mechanism, creating a potentially dangerous feedback: warming → drought → forest stress → reduced evapotranspiration → reduced rainfall recycling → greater drought → forest degradation → carbon release ↺.

The forest therefore becomes both a victim and a participant in the warming process. The more the ecosystem is degraded, the more its ability to sustain the hydrological processes on which it depends can be compromised, while the carbon released through degradation and fire can add further greenhouse forcing.

The Comingling Cascade

When these systems are considered together, the emerging picture is fundamentally different from a simple list of tipping points. It can be represented as a connected cascade:

POLAR AMPLIFICATION → ARCTIC ICE LOSS → ICE–ALBEDO AMPLIFICATION → GREENLAND ICE LOSS → FRESHWATER INPUT → AMOC STRESS → ATMOSPHERIC CIRCULATION REORGANIZATION → JET-STREAM WAVINESS + PERSISTENT BLOCKING → HEAT DOMES + DROUGHT + STALLED ATMOSPHERIC RIVERS → HYDROCLIMATIC WHIPLASH → AGRICULTURAL + INFRASTRUCTURE + ECOSYSTEM + PUBLIC-HEALTH STRESS → PERMAFROST THAW → CO₂ + CH₄ RELEASE → ADDITIONAL GREENHOUSE FORCING → BOREAL FOREST DEGRADATION → CARBON LOSS + WILDFIRE → AMAZON DROUGHT + FOREST DEGRADATION → ADDITIONAL CARBON RELEASE → ADDITIONAL WARMING → FEEDBACK INTO THE ENTIRE SYSTEM.

This is no longer adequately described as a series of isolated tipping points. It is a tipping cascade, and the cascade is capable of feeding back into itself.

The Speed of the System Is Changing

This may be the most important implication. The climate system is not simply moving toward a warmer equilibrium; it is increasingly exhibiting faster transitions between states. Heat accumulates, ice responds, water vapor amplifies, atmospheric circulation reorganizes, extreme precipitation intensifies, drought stresses ecosystems, wildfire releases carbon, permafrost thaws, and ocean circulation responds. Each process operates on a different timescale, but those timescales overlap, and that overlap creates opportunities for comingling.

A slow process such as ice-sheet destabilization can interact with a faster process such as atmospheric circulation. A seasonal event such as El Niño can temporarily push a slower-moving tipping element toward a threshold. A wildfire can rapidly convert a carbon sink into a carbon source, while a marine heatwave can stress an ecosystem already weakened by long-term warming. The climate system therefore contains multiple clocks, and as warming increases, those clocks increasingly begin to interact.

A New Way of Thinking About 1.5°C

The importance of 1.5°C is therefore not that crossing it suddenly turns the climate system into something entirely different. Its importance is that it places an increasing number of interconnected systems into a zone of elevated vulnerability. The relevant question is not simply whether we crossed 1.5°C, but how many systems are now being pushed toward critical states, how strongly those systems are interacting, whether their feedbacks are strengthening, and whether the rate of change is increasing.

Most importantly, we must ask whether we are beginning to see the Earth system respond to itself.

There is growing evidence that the answer is yes. Human emissions remain the primary driver of contemporary global warming, but the climate system does not remain passive after that forcing occurs. It responds. That response creates feedback. Feedback creates amplification. Amplification changes the conditions experienced by other systems. Those systems respond, and their responses feed back again.

That is the central danger of comingling tipping points.

From Tipping Points to Tipping Point Season

The old conceptual model was relatively simple: human emissions → warming → impacts. The emerging model is more complicated: human emissions → warming → tipping-element stress → feedback activation → system interaction → amplification → additional warming and disruption → additional feedback activation.

The Earth system is becoming an active participant in the trajectory we have initiated. This does not mean that climate change has become independent of human emissions. It means that the consequences of those emissions are increasingly being amplified by the physical and biological systems they have destabilized.

That is why the distinction between climate forcing and climate response is becoming increasingly important. We are no longer dealing solely with the question of how much additional warming humans will cause. We must also contend with how much additional change the warming already imposed can generate through Earth-system feedbacks.

That is the beginning of Tipping Point Season: not a season defined by one spectacular threshold, but a season defined by comingling—multiple tipping elements, multiple feedbacks, multiple timescales, multiple cascading pathways, and an increasingly observable acceleration in the response of the Earth system.

The greatest danger may therefore not be that one tipping point suddenly topples, but that several have already begun moving together. Tipping points are beginning to come together, feedbacks are proliferating, interactions are strengthening, and acceleration is emerging across interconnected Earth-system components. The climate system is consequently beginning to change faster and in more complex ways than its individual pieces can be understood in isolation.

That is the climate challenge we now face: not simply tipping points, not simply feedbacks, but tipping points comingling and feedbacks accelerating one another.

bookmark_borderHow Is Climate Energy Hitting You? Coatesville, PA: Hydroclimatic Whiplash

by Daniel Brouse

Coatesville, PA: Hydroclimatic Whiplash — Dying of Thirst in a Flood

The climate problem can arrive through your water tap.

Pennsylvania American Water issued a mandatory water conservation order on Sunday, September 6, 2026, affecting approximately 23,000 customer connections across the Coatesville water system.

Residents were ordered to reduce water consumption by 10% to 15% and temporarily limit their use of water to essential purposes. The affected system includes Coatesville, Atglen, Parkesburg, South Coatesville and surrounding communities in Chester and Lancaster counties.

At first glance, a mandatory water conservation order sounds like a drought story.

It isn’t.

This is something more revealing:

There was too much water—arriving too quickly—and the water system could not process it normally.

Pennsylvania American Water reported that recent weather-related changes in local water sources increased the amount of treatment required at the plant, placing additional demand on filtration systems and temporarily reducing treatment capacity.

The result is a striking example of hydroclimatic whiplash:

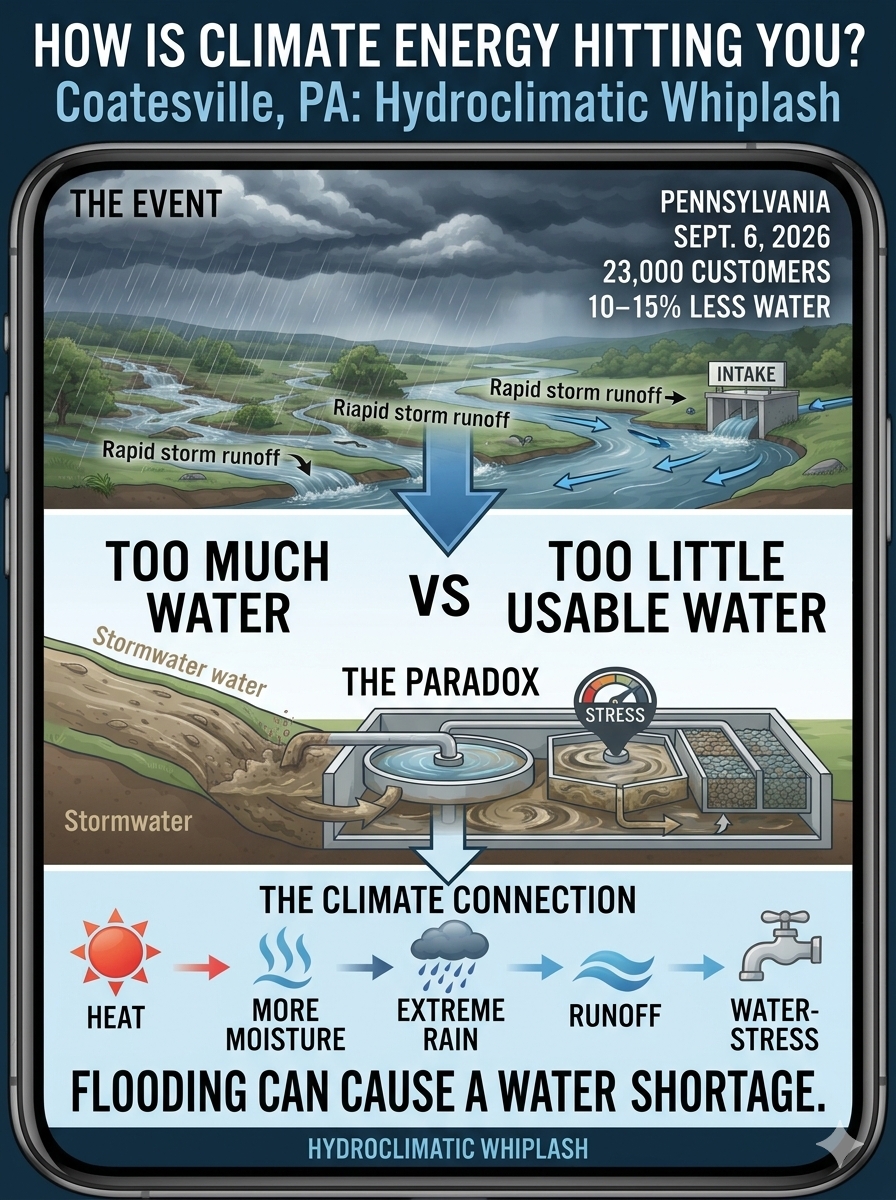
Heavy rainfall → rapid runoff → degraded raw-water quality → increased treatment burden → reduced treatment capacity → mandatory conservation.

In other words:

You can have water everywhere and still have a water shortage.


WHAT IS HYDROCLIMATIC WHIPLASH?

Hydroclimatic whiplash occurs when the hydrologic system swings rapidly between extremes—such as drought and intense rainfall, low flows and flooding, or water scarcity and overwhelming runoff.

The important point is that these extremes do not have to occur months or years apart. The transition itself can become the problem. A landscape stressed by heat and dry conditions can suddenly receive intense rainfall. Instead of that rainfall becoming a stable supply of usable water, much of it can move rapidly across the landscape and into streams. That runoff can carry sediment, organic material and other substances into the water supply.

The result is paradoxical:

The landscape is flooded with water while the community is told to conserve water.

This is not a contradiction in the physics.

It is a consequence of the difference between water being present and water being available as reliable, treated drinking water.


HOW IS CLIMATE ENERGY HITTING YOU?

This is where the Coatesville event becomes more than a local water-system story.

Climate change is fundamentally an energy problem.

A warmer atmosphere and warmer land surface alter evaporation, atmospheric moisture, precipitation intensity and the movement of water through the hydrologic cycle. That additional energy does not simply produce “more rain” or “less rain.” It can produce greater volatility.

Longer dry periods can increase the amount of moisture available to the atmosphere when moisture eventually returns. Heavy precipitation can then arrive in concentrated bursts, producing rapid runoff rather than a gradual recharge of soils, groundwater and reservoirs.

That creates a dangerous sequence:

Heat → drying → atmospheric moisture loading → intense precipitation → runoff → flooding → water-quality disruption.

And then, unexpectedly:

Flooding → water-treatment stress → reduced drinking-water capacity → conservation order.

That is hydroclimatic whiplash.


1. THE FIRST HIT: HEAT AND ATMOSPHERIC ENERGY

The story begins before the rain falls.

Heat increases evaporation from soils, vegetation and surface waters. A warmer atmosphere can also hold more water vapor. That matters because precipitation is not simply a question of whether clouds exist. It is a question of how much moisture and energy are available when atmospheric conditions produce rainfall.

A warmer climate therefore changes the hydrologic operating environment. The atmosphere becomes capable of moving larger quantities of water through the system. But that water does not necessarily arrive when or where communities need it.


2. THE SECOND HIT: RAIN ARRIVES AS A SHOCK

Heavy rainfall can overwhelm the landscape’s ability to absorb water. Instead of slowly infiltrating into soil and groundwater, water rapidly becomes runoff. Streams rise. Banks overflow. Sediment is mobilized. Organic material is flushed from the watershed.

The same rain that looks like an enormous addition to the regional water supply can therefore create an immediate problem for the water-treatment system.

This distinction is crucial:

Floodwater is not drinking water.

A reservoir or stream can contain enormous quantities of water while the fraction that can be economically and reliably converted into potable water temporarily falls.


3. THE THIRD HIT: WATER QUALITY BECOMES WATER AVAILABILITY

This is where the Coatesville event becomes particularly important. Pennsylvania American Water did not announce the conservation order because its customers suddenly consumed all the available water. The problem was that weather-related changes in local water sources increased the treatment burden and temporarily reduced the plant’s treatment capacity. That means the limiting factor shifted. The community did not necessarily run out of water. It encountered a temporary shortage of treatable water capacity. That distinction is becoming increasingly important in a changing climate.

Water infrastructure is engineered around expected ranges of conditions. But when the conditions themselves become more volatile, the infrastructure can be stressed from both directions.

Too little water can be a problem.

Too much water can also be a problem.

And rapid movement between the two can be worse still.


THE INFRASTRUCTURE PROBLEM

Most water systems were designed around historical hydrologic patterns. Treatment facilities have specific capacities. Filtration systems have operating limits. Pumping systems have design requirements. Reservoirs and intakes are built around expected ranges of water quantity and quality. But climate change changes the conditions under which these systems operate.

A treatment plant does not care whether the water arriving at its intake is technically “more water.” It cares about whether that water can be processed reliably.

When a storm rapidly changes raw-water conditions, the plant may have to work harder to produce the same quantity of finished drinking water. And if treatment capacity temporarily falls below normal demand, conservation becomes a tool for balancing the equation.

That is precisely what happened in the Coatesville system.


THE PARADOX: FLOODING CAN CREATE WATER SCARCITY

This is perhaps the most important lesson from Coatesville.

We often think about water security in a simple equation:

Drought = not enough water.

But climate disruption creates a more complicated equation:

Water security = quantity + quality + timing + infrastructure capacity.

You can have enormous quantities of water and still have a water-security problem if:

  • the water arrives too quickly,
  • the water is contaminated with sediment or organic material,
  • treatment requirements suddenly increase,
  • filtration capacity becomes constrained,
  • infrastructure cannot process the incoming water,
  • or the timing of supply does not match the timing of demand.

This is why calling every water problem a “drought” misses part of the story.

The emerging problem is increasingly hydrologic instability.


FROM FLOOD TO FAUCET

The path from atmospheric energy to your kitchen faucet can be surprisingly short:

Climate energy

↓

More evaporation and atmospheric moisture

↓

Heavy precipitation

↓

Rapid runoff

↓

Sediment and organic material enter waterways

↓

Raw-water quality deteriorates

↓

Treatment requirements increase

↓

Filtration capacity is reduced

↓

Available treated-water supply falls

↓

Mandatory conservation

↓

You turn on the faucet—and climate change has arrived at your house.

This is what the “How Is Climate Energy Hitting You?” framework is designed to reveal.

Climate change does not always appear as a dramatic temperature record or a catastrophic storm.

Sometimes it appears as a notice from your water utility telling you to use less water because it just rained too much.


WHY THIS MATTERS BEYOND COATESVILLE

The Coatesville event is local. The underlying mechanism is not necessarily local.

As climate volatility increases, communities can increasingly experience combinations that historically seemed contradictory:

Drought and flooding. Water scarcity and extreme rainfall. Low groundwater and overflowing streams. Dry soils followed by flash flooding. Too much raw water and not enough treated water.

These are not mutually exclusive conditions. They can occur sequentially—or even simultaneously in different parts of the same watershed. That makes traditional definitions of “water availability” increasingly inadequate.

The question is no longer simply:

How much water do we have?

It is becoming:

Can we capture it, store it, treat it and deliver it when people need it?


THE CLIMATE-ENERGY CONNECTION

The deeper lesson is that climate change is altering the rate at which the hydrologic system operates. That rate matters. A gradual rainfall event gives soil, vegetation, streams, reservoirs and treatment systems time to respond. An extreme rainfall event compresses enormous amounts of water movement into a short period. The faster the system is forced to respond, the more likely it is that one component becomes the bottleneck.

That is why climate impacts increasingly need to be understood as dynamic systems problems, rather than isolated weather events.

The Coatesville treatment plant is one component. The watershed is another. The atmosphere is another. The community is another.

They are connected.

When the atmosphere changes the amount, intensity and timing of water entering the watershed, the consequences propagate through the entire system.


WHAT DOES THIS MEAN FOR YOU?

The practical lesson is simple:

Climate resilience is not only about preparing for drought.

It is about preparing for volatility. Water systems need to be capable of handling:

more intense rainfall

larger swings in streamflow

rapid changes in raw-water quality

higher treatment demands

temporary reductions in treatment capacity

and simultaneous pressure from heat, drought and population demand.

For residents, the impact can be surprisingly mundane. A conservation order. A water-use restriction. A warning from your utility. A temporary disruption in normal service. A higher infrastructure bill.

Or simply the realization that the water coming down from the sky cannot necessarily be converted into the water coming out of your faucet.


THE BIGGER PICTURE

Coatesville provides a remarkably clear example of why “How Is Climate Energy Hitting You?” begins with everyday systems rather than abstract global averages.

The atmosphere absorbs additional energy. That energy changes evaporation and atmospheric moisture. Rainfall becomes more extreme. Runoff becomes more abrupt. Water quality changes. Treatment becomes more difficult. Infrastructure reaches its operational limits. And the final consequence can be delivered directly to your home:

Use less water.

That is the climate signal. Not because the community is necessarily running out of water. But because the climate system has temporarily made the water harder to process.

Hydroclimatic whiplash in one sentence:

The same storm that puts too much water on the ground can temporarily leave a community with too little water it can safely deliver through the tap.

That is what happens when climate energy moves through a coupled atmosphere–watershed–infrastructure system.

And it is increasingly how climate change becomes personal.

bookmark_borderHow much land do I need for my own shit?

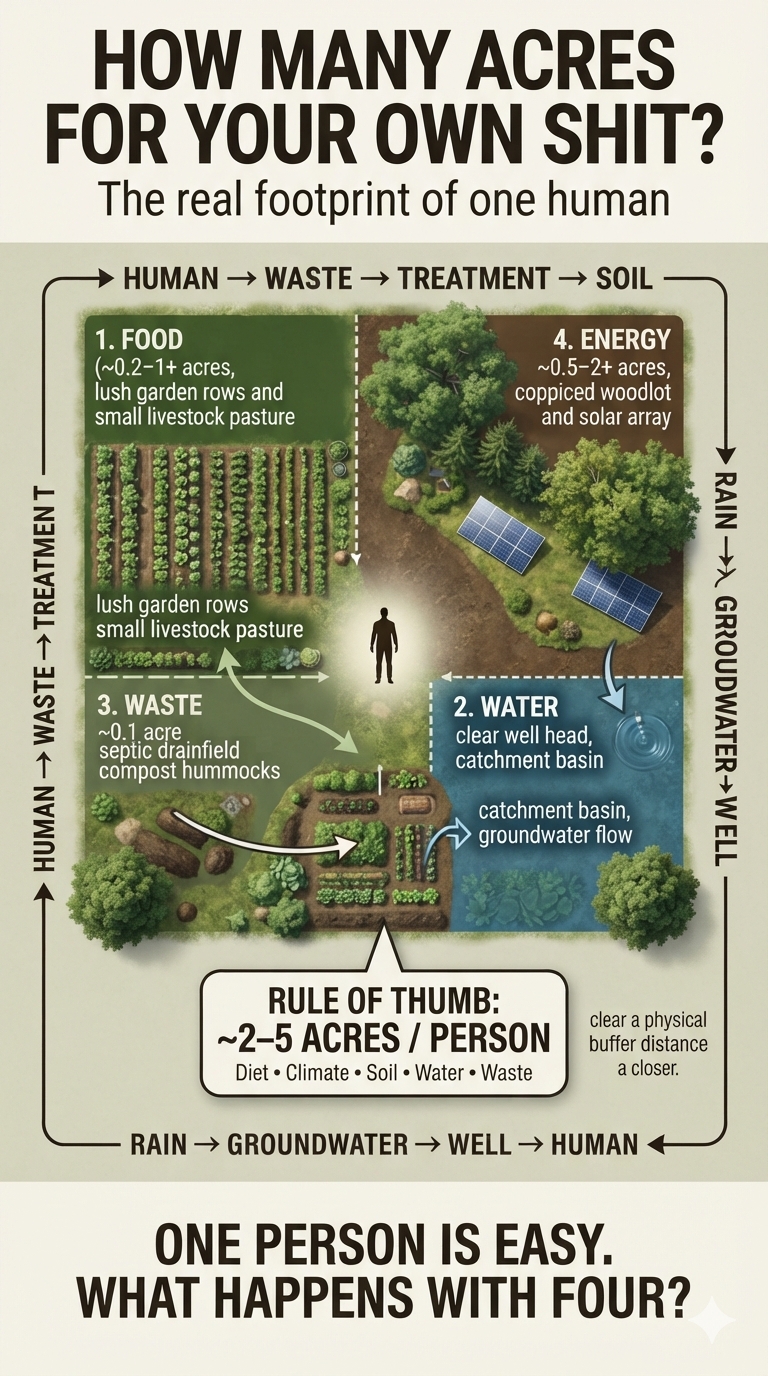
Tonight’s homework assignment: How much land do I need for my own shit? (AKA The Eat n’ Poop Experiment)

Both literally and figuratively.

This is an experiment I’ve been working on for years. And when you actually try to do it—when you have to think about where your food comes from, where your water comes from, and what happens to everything that comes out of you—you gain a very different perspective.

And yes, sometimes the experiment even comes down to a question like: Do I eat the worm, or don’t I?

Food and water are big problems.

But getting rid of what comes out of you can be an even bigger problem.

I’ve been meeting quite a few other people who are “doing it”—trying to become more self-sufficient, reduce their dependence on centralized systems, and figure out what is actually required to sustain a human being.

So I thought a good test for me would be to reevaluate the whole concept at two scales:

Macro. And micro.

Tonight is micro night.

How many acres do you need for your own shit?

A commonly cited homesteading rule of thumb is roughly 2–5 acres per person for a fairly self-sufficient setup—but that’s not a universal number. It depends enormously on your diet, soil, climate, water supply, livestock, energy needs, and how much of your waste you can safely recycle.

And that’s where it gets interesting.

Food production:
You might be able to produce a substantial amount of plant food on a fraction of an acre. Add grains, livestock, dairy, or meat, and the land requirement can increase dramatically.

Water:
You need a reliable source of potable water—and potentially enough watershed, recharge area, storage, or infrastructure to keep that supply reliable.

Waste:
This is the part people tend to overlook.

Your sewage system doesn’t just need a place to put sewage. It needs soil, treatment capacity, separation from groundwater and drinking-water sources, and enough suitable land for the system to function safely.

In Pennsylvania, for example, wastewater land-treatment systems can require significant separation distances from private drinking-water wells. That means the geometry of the property can matter almost as much as the number of acres.

And then there’s the really interesting question:

What if the waste isn’t actually waste?

Humanure, composting systems, graywater, nutrient cycling, orchards, biomass…

At the right scale—and with proper treatment—some things we call “waste” become inputs into another system.

So tonight I’m starting at the smallest possible unit:

One human.

How much land does one human actually need to provide food, water, and a safe place to put—or recycle—everything that comes out of them?

How many acres do you need for your own shit?

Then we’ll scale it up.

Because four people don’t necessarily require four times the land. And four people sharing a watershed, a food system, and a waste-treatment system creates an entirely different problem.

Tonight: micro.
Next: macro.

MACRO

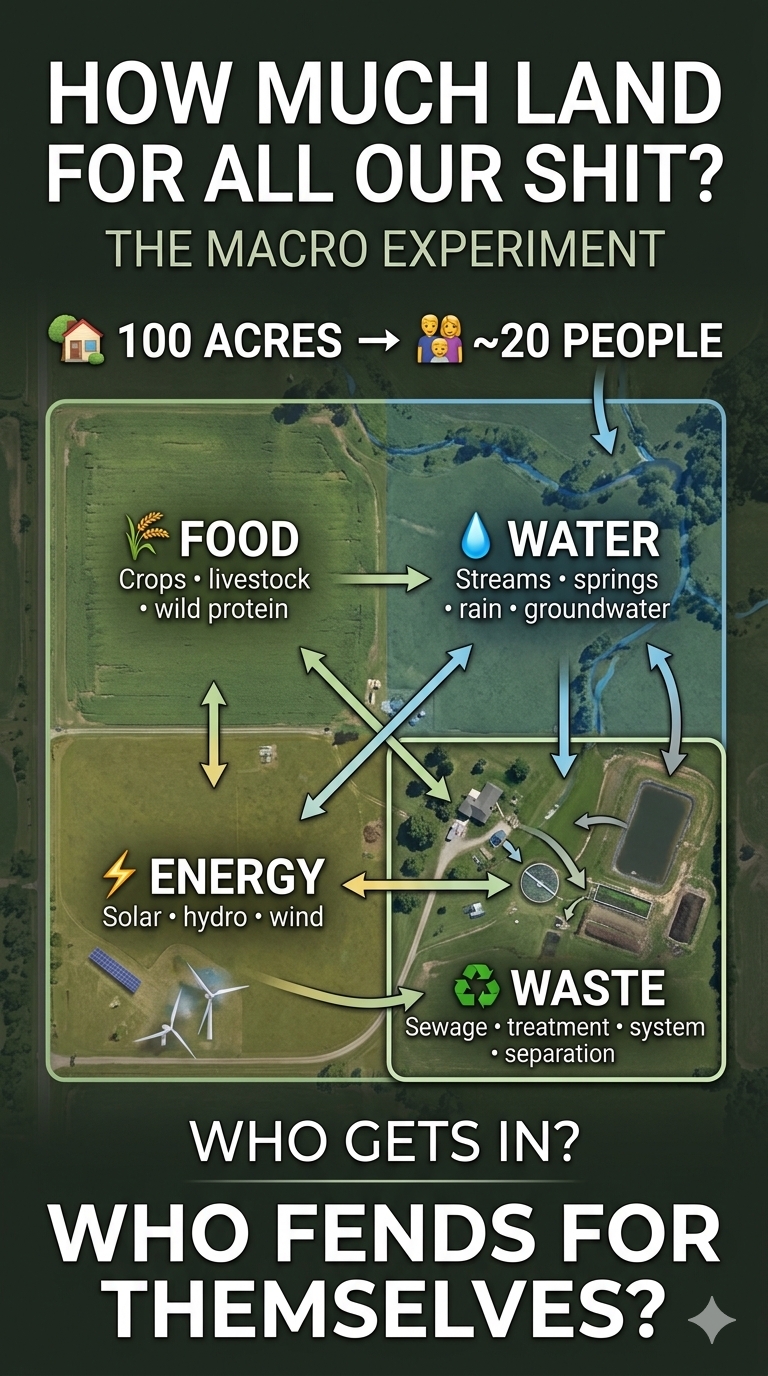
Tonight’s homework assignment: How much land do we need for all our shit?

AKA: The “Who Will Fend for Themselves?” Experiment

Last night was micro: How much land do I need for just me?

Tonight is macro: How much land do we need for me, my family, and company?

In two different experiments—one in New Zealand and one in Pennsylvania—families have been trying to find the answer.

Interestingly, both case studies arrived at a remarkably similar result: if you can optimize the use of roughly 100 acres, you can support about 20 people, although toward the lower end of what we would consider a modern standard of living.

And that’s when the bigger problem became evident.

As part of our long-term planning, we had to determine who would be allowed to come live with us in a crisis such as climate change.

There were eight of us. We figured our parents would need to be among the first to come. That added six, bringing us to 14. Then we started adding siblings, their partners, and their children. We quickly exceeded 25.

So the real question became:

Who gets invited?

And who is left to fend for themselves?

That sounds like an abstract thought experiment when you have plenty of land, food, water, and energy. It becomes a very different question when those resources have a hard limit. And as climate change accelerates—and the number of grandchildren continues to grow—these questions are no longer really about “future generations.”

They are about our own descendants.

They are the people who may actually have to confront the new realities we are leaving them.

That’s the part of the experiment I find hardest to calculate.

Not how many people the land can sustain.

But who gets to be one of them.

Notes

In New Zealand, Ganantchian Claire said:

Human waste is a very easy “problem “. Composting is super easy, safe, and valuable. Water of course depends where you are. Stream, or roof water are easy gravity fed, groundwater requires energy to bring it up. Food, acreage… as you say, depends entirely on your soil and climate. My opinion is a cow or a couple of goats are the easiest quickest way to get food security as milk covers all your needs. My experience is plants are great, but unreliable as crops can be devastated in a flash by pests or weather events. To avoid starvation, I would never give up my milking cow. One could actually survive with no land at all just walking a cow along the roadsides. A bit extreme, but why not?

In Pennsylvania, USA, I replied:

Nice! Thanks. “Real food” is the hardest thing in my environment as well, especially in the winter. When I say real food, I mean exactly what you said—food security. Eating vegetation is not something I can do for any extended period, and winter makes that particularly difficult.

Though your winters get cooler, I assume they aren’t quite as extreme as Pennsylvania’s, are they?

This becomes particularly relevant when we get to the “macro” experiment.

You also raise another important point with your example of “walking a cow along the roadsides.” In our experiment, we set it up as a game. One of the rules is that you can’t use other people’s land.

That, too, depends on where you live—and on what is considered public property versus private property. Ultimately, I think this is a debate that is likely to intensify as climate migration itself intensifies.

As for waste management, this also appears to be heavily dependent upon location.

In Pennsylvania, the largest long-term problem is waste management, followed by food, then water. But if you don’t manage waste properly, water quickly becomes your biggest problem. Contamination of drinking-water supplies from inadequate or poorly located waste management has been a long-term issue.

Traditionally, you needed at least 10 acres if you could not “perc” your lot.

Collecting rainwater isn’t necessarily a viable solution either. There simply isn’t enough precipitation in many locations across the continental U.S. And in several states, there are legal restrictions on collecting or impeding the flow of water unless you specifically own the water rights.

That’s what makes this experiment so interesting.

The answer isn’t just “How much land do I need?”

It’s where is the land, what can it produce, where does the water come from, and where does the poo go?

How many acres do you have available and how many people do you think you could sustain?

Ganantchian replied:

Interesting conversation. It highlights one of the biggest obstacles to self sufficiency is regulations.

We have 100 acres of land. 25 acres retired to native bush and wetlands, 50 acres very steep of very poor quality soil, 25 acres of which have been planted in poplars. And 25 acres of gently slopping with average quality soil.

I reckon we would comfortably feed 20 people in a localised system ie no fossil fuels or synthetic fertilisers use. Because of the poor inherent quality of our soil, manure from animals and us is the most valuable resource. If composted properly, it is safe to use around fruit and nut trees, which we have planted over 100 over the farm.

Our climate is very mild and with usually good rainfall although we do get drought. Rainwater is vital for drinking as I drunk water from our creek as an experiment and got quite sick 😂 Although it’s fine when boiled.
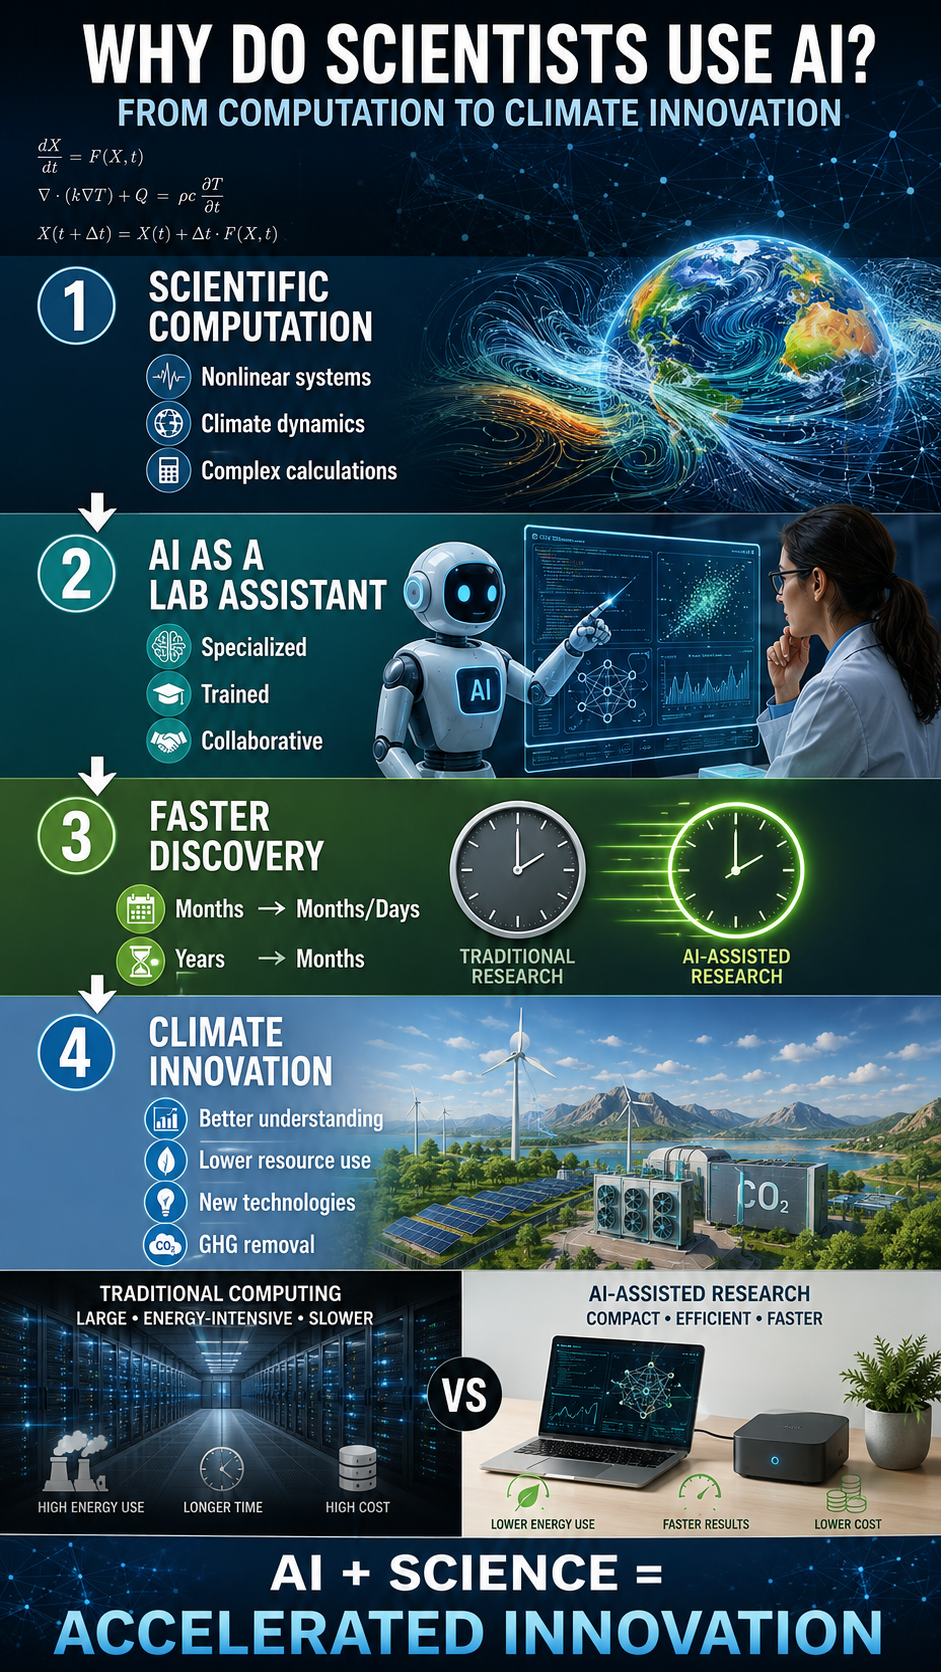
But again, the biggest hurdle is having to pay land rates. Which at the moment the livery horses cover. They do take up 90% of our grazing land… so currently the farm can only sustain 1 or 2 people… All because we are forced to fund Growth in the region, new roads, infrastructure for cars which I loathe, airport extensions which I vowed to never use again…

Hence it is very difficult to prepare for the unfolding multi crisis while the authorities are impeding our progress.

I responded:

Yes, very interesting indeed. Our macro experiment was intended to demonstrate how many people we could sustain on similar acreage. The result was almost identical.

Two families of four acquired 135 acres. About 35 acres were “public rights of way,” and another 20 acres were steep slopes and other unlivable acreage. Some of those 35 acres consisted of three streams, so potable water wasn’t a problem. One of the streams originated from a spring on the property and tested safe for drinking.

We had a cattle and chicken farmer adjoining the property. We exchanged our tillable acreage, about 65 acres, for him to grow feedstock in exchange for him raising a couple of cows and some chickens for us. There were also fish, small game, deer, and other protein sources. That left us about 15 acres for vegetables.

We did not fully develop and complete the land-management plan because it was not economical at the time. However, we did a thorough plan for being able to survive the winters. Solar panels offered the best and cheapest energy source. Small hydroelectric systems installed in the streams could add additional wattage. In addition, a small windmill could pump water up the steep slope to a small reservoir, which could be used as a “battery” for hydropower when the sun wasn’t shining.

Sewage ended up being the limiting factor.

Without sewage, we could sustain about 38 people. With sewage, that number dropped to about 25. The three streams were great for eating and drinking, but they limited where we could build sewage treatment systems without having rainwater runoff contaminate the drinking water and food sources.

The end result was a self-sustaining property of roughly 100 acres that could provide enough food, water, and energy for 20–25 people.

That is when the bigger problem became evident.

As part of our long-term plan, we had to determine who would be allowed to come live with us in a crisis such as climate change. There were eight of us. We thought our parents would need to be the first to be saved. That was an additional six, bringing the total to 14. If all of our siblings, their mates, and kids were included, we quickly exceeded 25.

So that became the bigger issue.

Who would be on the list of people invited versus the list of people to fend for themselves?

As climate change accelerates and the number of grandchildren grows, these questions are no longer about future generations. They are about our own descendants being forced to confront the new realities they will inherit.

She asked:

did you give up?

Yes, I equally feel that I only can provide for close loved ones. It might become different if our local community wakes up. But so far, most of my neighbors think the crisis is a distant worry for the next generation. I’m more than happy to open my gardens to as many people as possible. As long as they are on the same page, and putting in the hard yards.

People seem to think we have time. But the systems you are describing take years to put into place. 50 years ago is when humanity should have gone down that track.

Now… we barely have time to prepare for our small family groups…

Makes me ponder if I’ve done it in the right place as the local population (walking distance) is about 2000 people. 99% of whom rely entirely on being fed by supermarkets and takeaways…

I replied:

No, we didn’t give up. We achieved the goals of the study.

I was the climatologist, economist, and estate planner, as well as the land-management executive. What became obvious was that the physics, science, and logic of a crisis weren’t going to be the real problem.

The security of the infrastructure from outside threats—and the internal trust required to manage the “financial trust fund”—were going to be the larger crisis within the crisis.

One would hope that a crisis would bring us—humanity—together.

Unfortunately, the opposite appears to be true.

Fear and greed are inherent problems that get amplified in a crisis.

That was probably the most important thing we learned from the experiment.

bookmark_borderScientists Using AI: From Computational Efficiency to Climate Innovation

by Daniel Brouse and Sidd Mukherjee

Why Do Scientists Use AI?

The short answer is:

We’ve conducted case studies on the use of AI in a wide variety of environments, including everything from the dynamics of nonlinear chaotic systems to songwriting and musical production.

All produced similar results—benefits to the environment, the economy, and society.

For instance, the climate education and graphics used for this post are based on this scientific paper as well as the publicly accessible version.

If I had created them manually, the costs in time, labor, energy, and resources would have been substantial. Using AI, the direct dollar cost to me was effectively zero, the graphics were generated in about a minute, and the estimated natural-resource cost was roughly $0.067 per image.

By comparison, producing similar graphics through traditional methods could easily have cost hundreds of dollars when accounting for labor, software, revisions, and associated natural-resource use. Mathematically, the AI-generated version required approximately 0.005% of those resources—just five thousandths of one percent of the traditional cost. These savings are equivalent to a reduction in environmental impact.

The benefits—in both environmental savings to the planet through reduced physical-resource use and in the ability to produce and distribute education—far outweigh the costs.

Most importantly:

The only effective way to stop the acceleration of climate change is through the reduction of fossil-fuel combustion.

However, the most likely way of reversing the trajectory of climate change is through people using AI to develop previously unthought-of methods and technologies that can fundamentally change how we produce, consume, and manage resources—and potentially remove greenhouse gases from the atmosphere.

Anti-Science and Technology Rhetoric

Unfortunately, the lack of science and technology literacy is at the root of many of society’s problems. Anti-AI opinions are ironically very similar to the anti-science rhetoric used by climate-change deniers.

Climate-change deniers tend to have little, if any, experience as climate scientists. They often show signs of impaired executive function: the brain’s ability to plan, analyze, and think abstractly. This makes processing complex or nuanced information nearly impossible, fostering an aversion to science, mathematics, and logic. Their thinking becomes rigid, emotionally driven, and black-and-white, leaving them highly susceptible to political propaganda, conspiracy theories, and fear-based messaging. Unable to reason critically or tolerate uncertainty, they cling to misinformation and reject rational discourse—no matter how much evidence is presented.

The same holds true for anti-technology opinions expressed in public. The ill-informed individual has likely never used AI in the role of a climate scientist. Scientists train their own highly specialized AI assistants. AI is artificial SUPPLEMENTAL intelligence. This is not how the ordinary individual usually interacts with AI.

In my case, I have spent years developing multiple specially trained “lab assistants” that have learned from scores of our own work. When Sidd and I started, our work had to be done on Ohio State computers and supercomputers that Sidd helped create. Things like “a floating decimal” were, and still are, a significant problem. Problems that needed solving would take months or years to process. The amount of energy spent on computation was enormous compared with today.

Things have changed for the better.

This year, we were able to establish third-derivative behavior across multiple climate indicators—extremely important developments in climate science that confirm that the acceleration rate of climate change is itself accelerating. This work was completed within four months. Historically, I would have been unlikely to complete this work in my lifetime if it were not for AI.

In the meantime, the United States has gone extremist in anti-science and anti-technology ideology, much to the detriment of science and scientists in the U.S. In fact, we are now working on bringing up our own AI computer using Chinese technology. It will be running on DeepSeek. The single computer will do the work of what used to take at least a dozen servers to accomplish, at a fraction of the price. It will not be run in a data center. It will not be costing society anything. In fact, it will be greatly benefiting society and helping to solve the climate crisis.

So, the next time you want to voice your opinion about AI, do your homework first. Start by getting at least a master’s-level education in climate science. Then spend years training your AI assistants. After completion, I would be happy to discuss AI with you.

bookmark_borderTipping Point Season

by Daniel Brouse

Introduction: What Is Tipping Point Season?

The first tipping point season was 2023–2024, when global temperatures exceeded +1.5°C for an extended period. During that season, nine tipping points became observable:

  • Greenland Ice Sheet Collapse
  • West Antarctic Ice Sheet Collapse
  • Labrador–Irminger Seas/SPG Convection Collapse
  • East Antarctic Subglacial Basins Collapse
  • Arctic Winter Sea Ice Collapse
  • East Antarctic Ice Sheet Collapse
  • Amazon Rainforest Dieback
  • Boreal Permafrost Collapse
  • Atlantic Meridional Overturning Circulation (AMOC) Collapse

This phenomenon occurred simultaneously with El Niño. ENSO is not a cause of climate change; rather, it is a manifestation of the climate system’s accumulated energy. Most of that accumulated climate energy is stored in the oceans. Every several years, much of this heat is brought toward the surface in an oscillating pattern.

Over the last 30 years, El Niño events have continued to occur at their historical frequency of roughly every 2 to 7 years, but their intensity has dramatically increased. A recent August 2026 study by the University of Michigan revealed that El Niño events have become nearly 40% stronger over the last few decades compared with the pre-industrial era.

The last 30 years have borne witness to three of the most powerful “Super El Niño” events in recorded history, alongside an exceptionally strong event currently unfolding in 2026. The extreme heat released by this “supersized” El Niño is expected to temporarily push the entire planet above the 1.5°C global warming limit by late 2026 and into 2027.

A Planetary Feedback Network

This tipping point season is pushing the climate system even further, with traditionally non-connected tipping points and feedbacks beginning to couple with one another. One example is the coupling of a Pacific El Niño and an Atlantic Niña.

Usually, the Pacific and Atlantic pretty much “do their own thing.” But this year is different. The climate system has been supercharged with energy, and that energy is manifesting in some strange and surprisingly interconnected ways. The unusual co-occurrence of a Pacific El Niño and an Atlantic Niña illustrates how strongly connected Earth’s climate system is. Although the Pacific and Atlantic are separate ocean basins, the atmosphere links them through planetary-scale circulation patterns.

The deeper significance is the connection itself.

A thermal anomaly in the Pacific can reorganize tropical convection. That atmospheric reorganization can propagate through the global circulation system, altering pressure and winds over the Atlantic. Those winds can change ocean upwelling and sea-surface temperatures. The resulting ocean anomaly can then modify atmospheric moisture, convection, and storm development.

The signal can extend even farther through the North Atlantic jet stream and atmospheric wave patterns, influencing weather regimes across Europe and the United Kingdom.

This is not a single atmospheric current traveling around the planet. It is a coupled network of atmospheric and oceanic responses operating across different spatial and temporal scales.

What begins as: PACIFIC WARMING

became: ATMOSPHERIC REROUTING

then: ATLANTIC COOLING

and ultimately:

REGIONAL WEATHER + HYDROCLIMATIC CONSEQUENCES

The climate system is therefore not a collection of isolated ocean basins and weather systems. Energy moves through the connections. The atmosphere carries the signal. The oceans respond. Feedbacks propagate. One planet. One interconnected climate system.

This tipping point season makes observable, for the first time in history, the coupling, interaction, and amplification of feedbacks—and their collective pushing of tipping points into their second derivation.